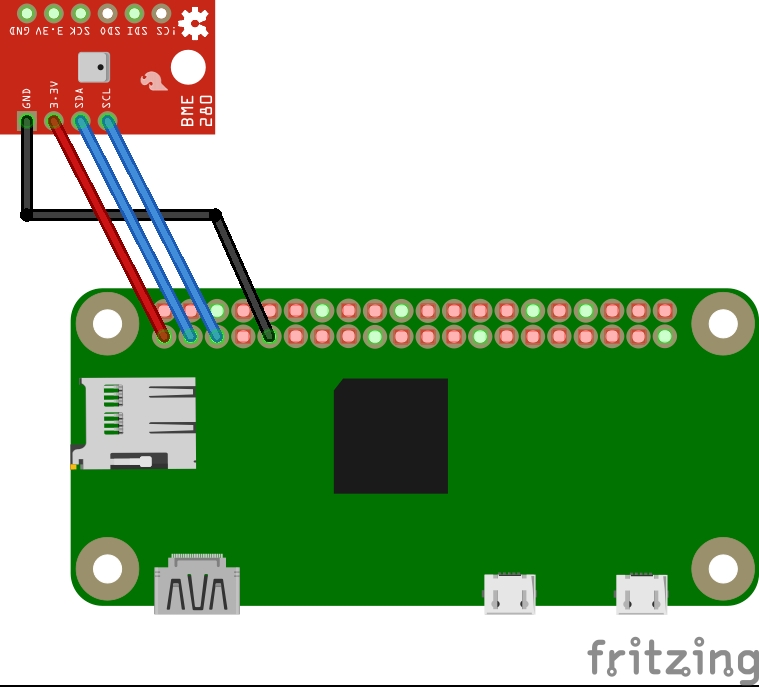
Web server using a Raspberry Pi and BME280 sensor to graph the humidity and temperature over time. The data can be accessed over a web browser.
sudo raspi-config
# enable I2S
Run full setup
./setup.shThe temp_app.py is the flask application that creates the webpages. This flask app will be loaded by the fastcgi plugin of lighttpd.
The database will be filled by a cronjob that triggers the python script append_db.py every x minutes (5min).
The webserver has 3 views, The home page, history page and settings page.
In the current view, the current temperature and humidity taken from the sensor is displayed on the web page. This page updates every 10 seconds, and has a link to the historic view.
The history view has a couple features. The first is a to and from date input, which uses a date time picker plugin. Combined with a submit button, this allows you to view the temperature and humidity data within any date time range easily. The next feature are four radio buttons, to easily see the last 3, 6, 12, and 24 hours of data. There is also a link to go abck to the home page.
The main view are 2 tables combined with Google Charts graphs. The tables both scroll, and the charts display data across the time selected. The times are displayed in your own time zone, as it is determined from your browser.
Edit the settings of the application.
Manual test webserver
source venv/bin/activate
python3 temp_app.py
Manual messurement to db
./cron_trigger.shTake a peak at the db db
venv/bin/python get_data.py- Send data through http calls and not static pages that need to be reloaded
- Improve home page with gauges for temperatures
- Improve the settings page to control more settings (cron frequency, ...)
- Improve pages for viewing on mobile
- More options to view the data
- Be able to export the data
