xLabels get cut off and some are not displayed
Bscheef opened this issue · comments

Hi
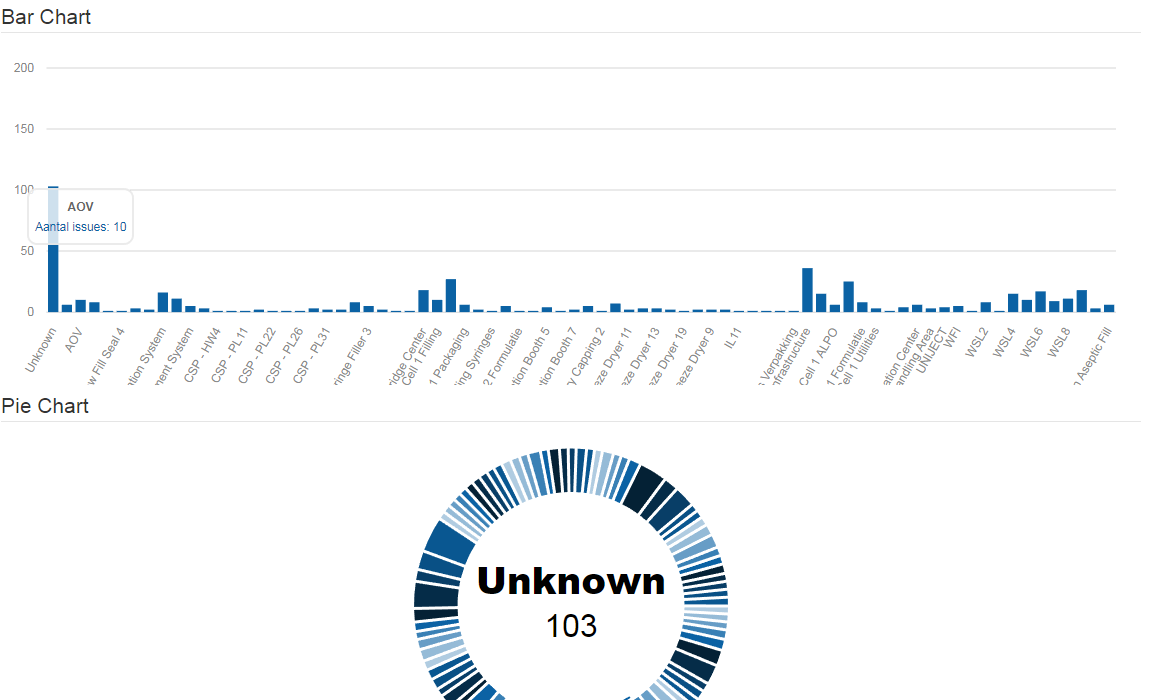
I have a barchart and piechart which users can create based upon certain fields in my database.
First of all, there's a chance that the xLabels are way too long and something just cuts them of. I have looked around the issues pages like #745, #316 and even @JelteF's #447 and #455 fixes. But I don't seem to understand how I have to fix this.
Second of all, there are some cases in which it also gets a lot of bars to be displayed. Then my bar chart just decides to leave some labels away. I've set the xLabelAngle to 60 (90 doesn't change anything) and even used xLabelMargin: 0. I have found issues like #235 but I have not found similar issues on this where the issue openers had the xLabels turned in an angle.
UPDATE:
I just gave the svg element inside the div a fixed height using this code:
$('svg').height(700);
Comments on how to autosize the chart is also welcome!
I still haven't solved the second issue
Note: The Pie Chart element is not covering the labels
I removed the data in the script in order to make it easier to read
Morris.Bar({
element: "barChart",
data: [
{kolom: "Unknown", issues: 103}
{allMyOtherData}
],
xkey: "kolom",
ykeys: ["issues"],
labels: ["Aantal issues"],
xLabelAngle: 60
});
I hope someone can help me out on this one.
Thanks in advance

I am facing the same problem. Did you solved it?

The same problem with me

I had a similar problem, I added an extra blank area under the graphic for the text to appear, and thus my problem was solved. I am sharing my sample code.
Js Part
var bar=new Morris.Bar({ element: 'capacityWorkShopChart', data: piedata, xkey: 'y', ykeys: ['a'], labels: ['@StandartLibrary.Lang.Resources.CapacityOccupancyRate'], barColors: ["#B21516", "#1531B2", "#1AB244", "#B29215"], lineWidth: '1px', //fillOpacity: 0.8, smooth: true, hideHover: false, xLabelAngle: -90, // gridTextSize: 10, //padding: 200, //resize: false fillOpacity: 0.6, behaveLikeLine: true, resize: true, pointFillColors: ['#ffffff'], pointStrokeColors: ['black'], lineColors: ['gray', 'red'], hideHover: 'auto', padding: 30 });
Html Part
<div class="col-md-12"> <div id="capacityWorkShopChart" style="height: 500px; width: 100%; padding-bottom: 40px;"></div> <div id="capacityWorkShopChartLegend"></div> <div id="capacityWorkShopEmpty" style="height: 250px; width: 100%;"> </div> </div>
