LogTrail - Log Viewer plugin for Kibana
Introduction
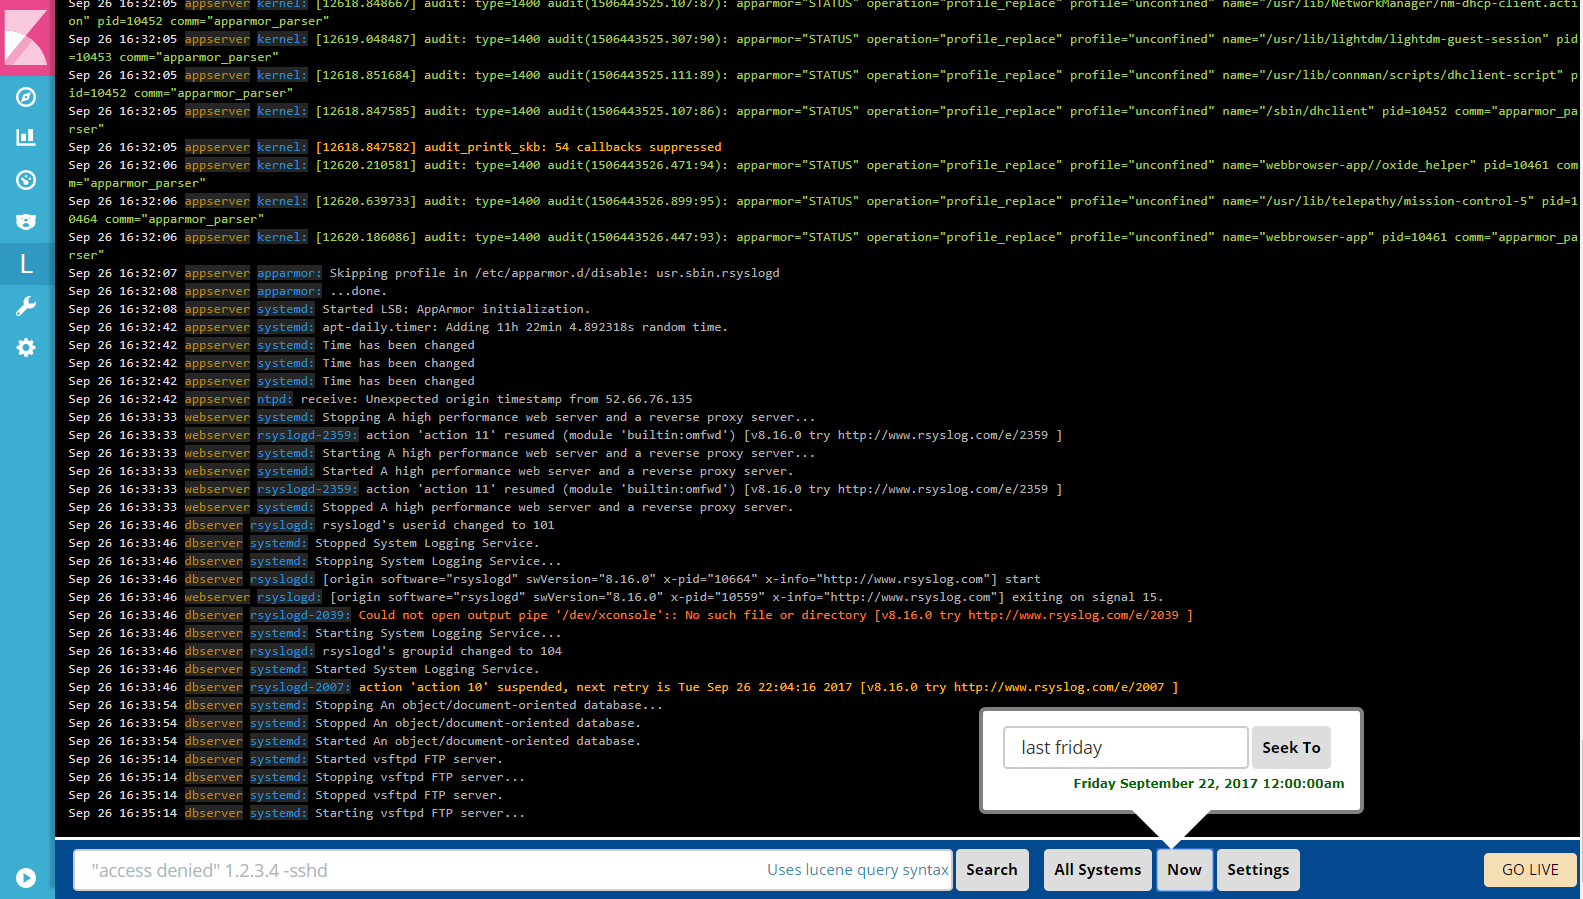
LogTrail is a plugin for Kibana to view, analyze, search and tail log events from multiple hosts in realtime with devops friendly interface inspired by Papertrail.
Features
- View, analyze and search log events from a centralized interface
- Clean & simple devops friendly interface
- Live tail
- Filter aggregated logs by hosts and program
- Quickly seek to logs based on time
- Supports multiple Elasticsearch index patterns each with different schemas
Installation
- Prerequisites
- Download and install Elasticsearch , Logstash and Kibana
- Logtrail is supported and tested with Kibana 4.x and 5.x
- Install logtrail plugin (requires restart of Kibana after install)
- Kibana 4.x :
./bin/kibana plugin -i logtrail -u https://github.com/sivasamyk/logtrail/releases/download/0.1.7/logtrail-4.x-0.1.7.tar.gz - Kibana 5.2.0 :
./bin/kibana-plugin install https://github.com/sivasamyk/logtrail/releases/download/0.1.8/logtrail-5.2.0-0.1.8.zip
Configuration
If you are already shipping logs/events to Elasticsearch
- If you have already setup logging infrastructure with events getting indexed in ES,
you need to map the current event fields in ES to logtrail specific fields. This can by done by editing
logtrail.jsonfile located inside./plugins/logtraildirectory (for 4.x the directory is./installedPlugins/logtrail/). Edit the following fields:- default_index - Elasticsearch index where the syslog events are stored (default: logstash-*)
- While using an index name other than
logstash-*, make sure respective .raw fields are created in ES index.
- While using an index name other than
- default_time_range_in_days - Default time range in days to search when time is not specified using Seek button. Example: Value of 30 means logtrail will search only in logs from last 30 days, unless time is specified using Seek button. Value of 0 means logtrail will search in all available logs by default.
- display_timezone - Timezone to display the timestamp in Event Viewer. e.g.
America/Los_Angeles. Default value oflocalwill use the timezone of browser. The time specified inSeek Topopup will always use browser timezone. - display_timestamp_format - Format to display the timestamp in Event Viewer. For list of valid value refer here
- fields - Edit this parameter to map the event fields in ES to logtrail fields
- timestamp - maps to @timestamp field inserted by logstash. This will be used for querying internally. Logtrail recommends @timestamp to be stored in UTC in ES.
- display_timestamp - the formatted timestamp displayed in the events view. By default mapped to @timestamp
- hostname - hostname from where the events were received. Also used by hostname filter
- program - program that generated this event.
- message - actual event message. This field will be used by search.
- default_index - Elasticsearch index where the syslog events are stored (default: logstash-*)
- Example: If the event fields names are @timestamp, host, process, message the mapping should be
"mapping" : {
       "timestamp" : "@timestamp",
       "display_timestamp" : "@timestamp",
       "hostname" : "host",
       "program": "process",
       "message": "message"
   }
- Each line displayed in the events view is of format:
display_timestamp hostname program:message - Any changes in
logtrail.jsonrequires restart of Kibana
If you are starting fresh
- Before using the plugin make sure there are events indexed in Elasticsearch
- Configure logstash to receive syslog events
- Start logstash agent with following configuration to receive syslog events.
input {
  tcp {
    port => 5000 # syslog port. can be changed
    type => syslog
  }
  udp { #optional. required if syslog events are sent using UDP.
    port => 5000
    type => syslog
  }
}
#Do not change the contents of filter codec
filter {
  if [type] == "syslog" {
    grok {
      match => { "message" => "%{SYSLOGTIMESTAMP:syslog_timestamp} %{SYSLOGHOST:hostname} %{DATA:program}(?:\[%{POSINT:pid}\])?: %{GREEDYDATA:syslog_message}" }
    }
    date {
      match => [ "syslog_timestamp", "MMM  d HH:mm:ss", "MMM dd HH:mm:ss" ]
    }
  }
}

output {
  elasticsearch {
    hosts => ["localhost:9200"]  #change host as required
  }
}
- Configure rsyslog to send data to logstash
- In Ubuntu
- As root, edit /etc/rsyslog.conf or /etc/syslog.conf to include following line at the end
- To send syslog events using TCP
*.* @@<logstash-agent-ip>:<port>- To send syslog events using UDP*.* @<logstash-agent-ip>:<port>- Restart rsyslog to activate the changessudo service rsyslog restart - Logs & Events from Windows, Java, Python, PHP, Perl, Ruby, Android, Docker, .Net can be shipped using syslog protocol.
- For more configuration options refer to Papertrail Configuration Help.
- In Ubuntu
- As root, edit /etc/rsyslog.conf or /etc/syslog.conf to include following line at the end
- To send syslog events using TCP
- Beats/Fluentd can also be used to ship events to ES and fields can be mapped using
fieldsparameter inlogtrail.json - Switching back to Kibana main view from logtrail will not work (known bug). Workaround: Please change the URL directly in address bar.