dodged stat_gradientinterval() with thinner thickness: how to dodge without space between groups?
DominiqueMakowski opened this issue · comments

Hi! I had a tiny question, with dodged gradients, I reduced the thickness, but then the dodging create space in between each "group". I can reduce it by fiddling with position_dodge(width), but it's tough to automatize (so that there is no space regardless of the range of x). Is there a possibility to dodge it so that the 3 colors below remain "collated" together?
Any pointers are welcome, and sorry if I missed something obvious!
library(tidyverse)
library(ggdist)

dat <- data.frame(y = rnorm(1000),
                  x = rep_len(1:8, 1000),
                  g = rep_len(c("A", "B", "C"), 1000))

# How to reduce the space in each x-group between the 3 colors?
dat |>
  ggplot(aes(x = x, y = y)) +
  ggdist::stat_gradientinterval(
    aes(fill = g),
    geom = "slab",
    thickness = stat(thickness(0.5)),
    position = position_dodge(width = 0.7)
  )
Created on 2022-11-17 by the reprex package (v2.0.1)

Ah yup, understandable that figuring it out is a pain, there are a number of different parameters at play here. This diagram of parameters from the slabinterval vignette is supposed to help but I can see how it might not be clear:
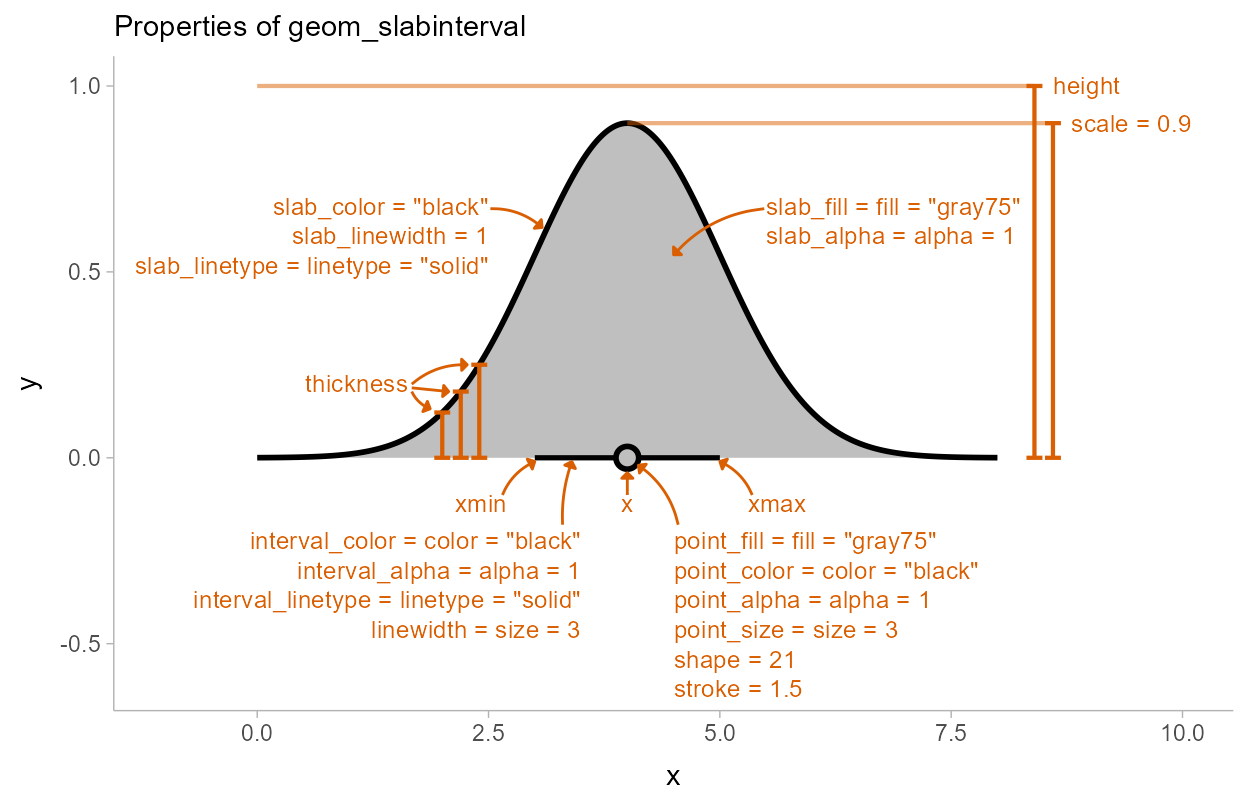
The space between slabs is governed by the scale parameter (default 0.9), which is the proportion of the geometry's height (or width --- I should add that to the diagram) taken up by the slab.
So in your case, I'd start with scale = 1:
dat |>
  ggplot(aes(x = x, y = y)) +
  ggdist::stat_gradientinterval(
    aes(fill = g),
    geom = "slab",
    position = "dodge",
    scale = 1
  )
Then, to reduce the amount of space taken up by the geoms, reduce their width --- but do this for the geom, not just as a parameter to dodge (if you just do it for the dodge, the geoms will overlap because the dodging will be less than their width. If you do it for the geom, the geom's width is used automatically in the dodge):
dat |>
  ggplot(aes(x = x, y = y)) +
  ggdist::stat_gradientinterval(
    aes(fill = g),
    geom = "slab",
    position = "dodge",
    width = 0.5,
    scale = 1
  )
turns out to be so simple 🙈 thanks a lot!
no prob!