NGINX App Protect DoS has been released early July 2021. You may refer to this doc https://docs.nginx.com/nginx-app-protect-dos/ for more information, including getting trial license for testing.
The purpose of this repo is to provide an easy setup for learning and demonstrating NAP DoS.
I have cloned the NAP DoS dashboard from https://github.com/f5devcentral/nap-dos-elk-dashboards into this repo for ease of setup.
-
Build NAP DoS Docker image
Follow the instruction in the official doc to build a local docker container app-protect-dos image. https://docs.nginx.com/nginx-app-protect-dos/deployment-guide/learn-about-deployment/#docker-deployment-with-nginx-app-protect -
Clone the repo
git clone https://github.com/mcheo-nginx/nap-dos-demo.git
cd nap-dos-demo
- Step up the stacks
docker-compose -f docker-compose.yaml up -d
The stack consists of 5 containers:
- NGINX App Protect DoS instance
- Juice Shop as backend app server
- Legitimate container to generate good traffic
- Attacker container to generate attack traffic
- Elasticsearch for NAP DoS dashboard
- Complete Elasticsearch setup
Use browser to visit http://localhost:5601, once the page loads successfully which means startup has completed, execute the following steps:
Step 3.1
curl -X PUT "localhost:9200/_cluster/settings?pretty" -H 'Content-Type: application/json' -d'
{
  "transient": {
    "cluster.routing.allocation.disk.threshold_enabled": "false"
  }
}'

Step 3.2
curl -X PUT "localhost:9200/_all/_settings?pretty" -H 'Content-Type: application/json' -d'
{
	"index.blocks.read_only_allow_delete": null
}
'

Step 3.3
cd elk

curl -XPUT "http://localhost:9200/app-protect-dos-logs"  -H "Content-Type: application/json" -d  @apdos_mapping.json

curl -XPOST "http://localhost:9200/app-protect-dos-logs/_mapping"  -H "Content-Type: application/json" -d  @apdos_geo_mapping.json

Step 3.4
KIBANA_CONTAINER_URL=http://localhost:5601

jq -s . kibana/apdos-dashboard.ndjson | jq '{"objects": . }' | \
curl -k --location --request POST "$KIBANA_CONTAINER_URL/api/kibana/dashboards/import" \
    --header 'kbn-xsrf: true' \
    --header 'Content-Type: text/plain' -d @- \
    | jq
- Enable NAP DoS logging
Edit nginx/nginx.conf file and uncomment the following 2 lines:
#app_protect_dos_security_log "/etc/app_protect_dos/log-default.json" syslog:server=elasticsearch:5261;

#access_log syslog:server=elasticsearch:5561 log_dos if=$loggable;
Execute NGINX reload
docker exec -it nap-dos-demo_nginx_1 nginx -s reload
You may browse the Juice Shop application at http://localhost
- Generate baseline traffic
docker exec -it nap-dos-demo_legitimate_1 /bin/bash
cd /home
chmod 755 good.sh
./good.sh
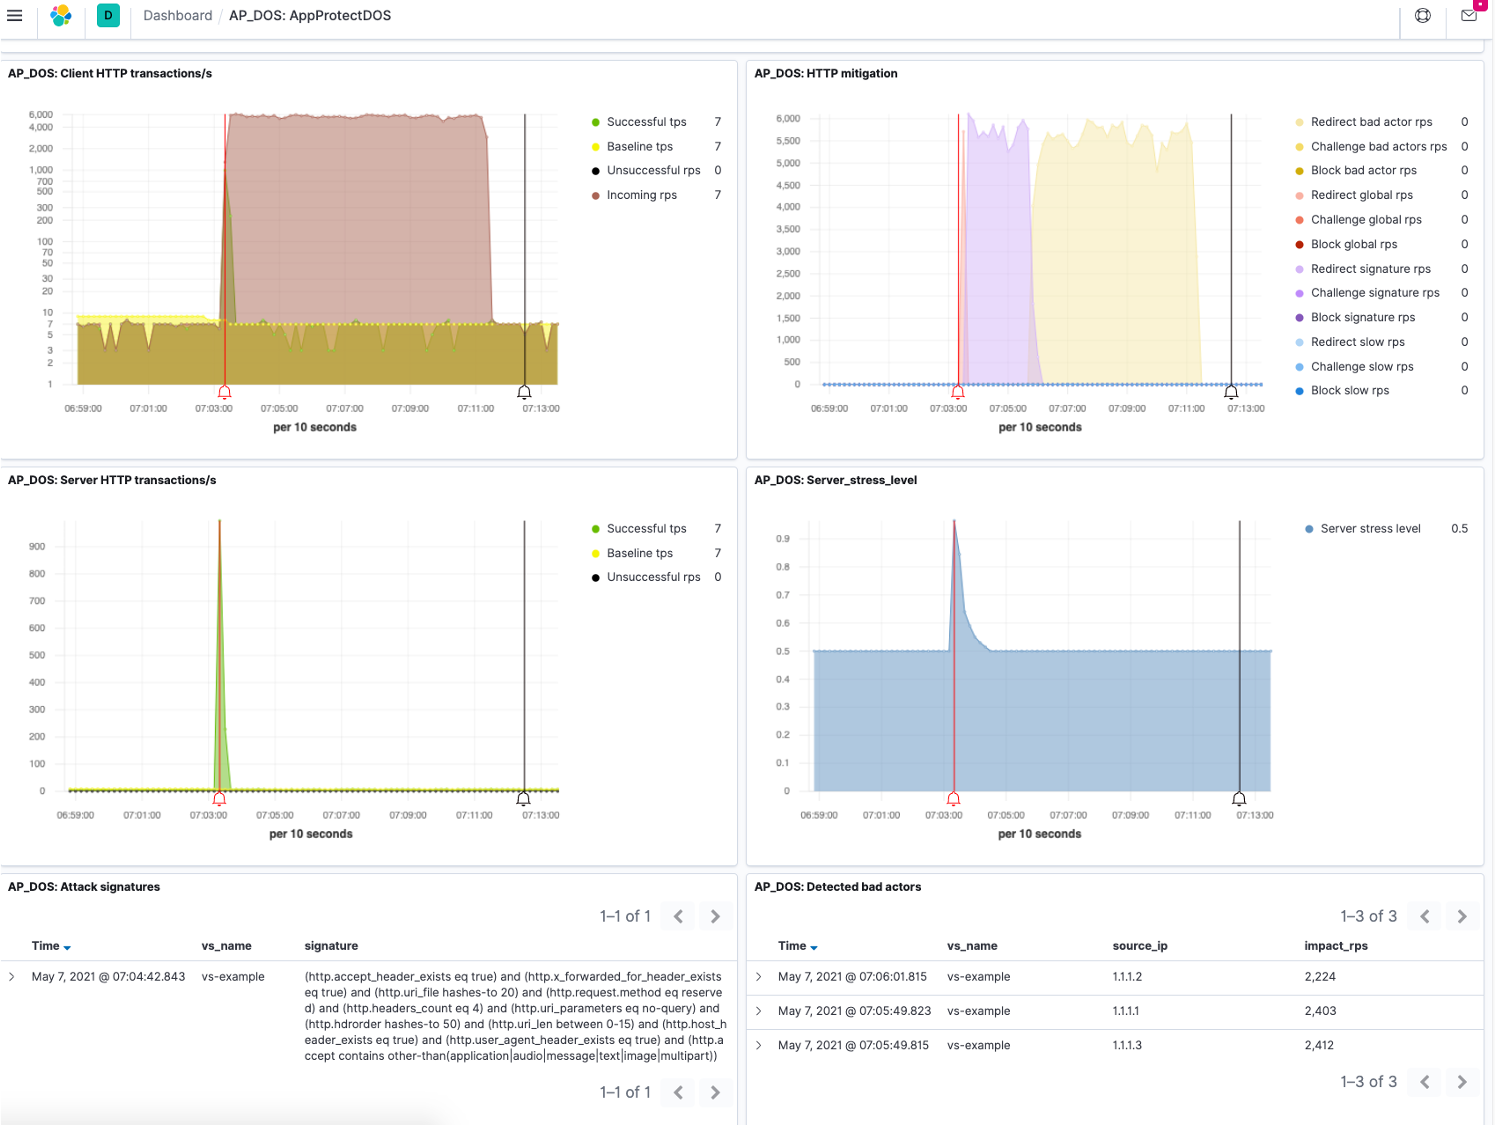
For a start, let it runs for at least 8-10 minutes. Let NAP DoS does its initial baselining. If everything is working as expected, Elasticsearch AP_DOS: AppProtectDOS dashboard should display charts.
You may visit the Elasticsearch dashboard at http://localhost:5601
- Default dashboard has filter, apply or remove filter as you wish.- Generate attack traffic
While the good traffic still running at the background, you may start the attack traffic
docker exec -it nap-dos-demo_attacker_1 /bin/bash
cd /home
chmod 755 bad.sh
./bad.sh
The general idea is NAP DoS leverage on its ML to perform behaviour dos mitigation. No manual (human) tuning, re-tuning required.
- When the attack happens, a sharp increase of traffic in "AP_DOS: Client HTTP transaction/s" panel and "AP_DOS: Server HTTP transactions/s"
- NGINX detects server stress, spike in "AP_DOS: Server_stress_level" panel
- Initially, NGINX will goes into self defense mode by doing global challenge. Red patch (Redirect/Challenge global RPS) shows in "AP_DoS: HTTP Mitigation" panel
- Once NAP DoS gather sufficient data and generate dynamic attack signatures in response to this particular attack, attack signature shows in "AP_DoS: Attack Signatures" panel, purple patch (Redirect/Challenge signatures RPS) shows in "AP_DOS: HTTP Mitigation" panel. At thsi time NAP DoS is doing targeted mitigation instead of global mitigation.
Note: This dynamic attack signature is crafted for this specific attack, highly accurate and reduce false positive. If attacker re-tool and tweak its attack, NAP DoS will auto regenerate a new dynamic signature for the new attack. - If the attack prolongs and those source IP has been identified as bad actors in "AP_DOS: Detected bad actors" panel, yellow patch (Redirect/Challenge bad actors RPS) shows in "AP_DOS: HTTP Mitigation" panel
- Despite the attack traffic keeps coming in (high traffic in "AP_DOS: Client HTTP transaction/s" panel), NAP DoS has mitigate and send only legitimate traffic to backend server (lower traffic in "AP_DOS: Server HTTP transactions/s" panel). As a good user, you may visit the page in http://localhost and it is working fine.
- There is Start and End bell flag in the charts that signifiy start and end of attack.
