info@logscape.com in conjunction with ben.newton@excelian.com
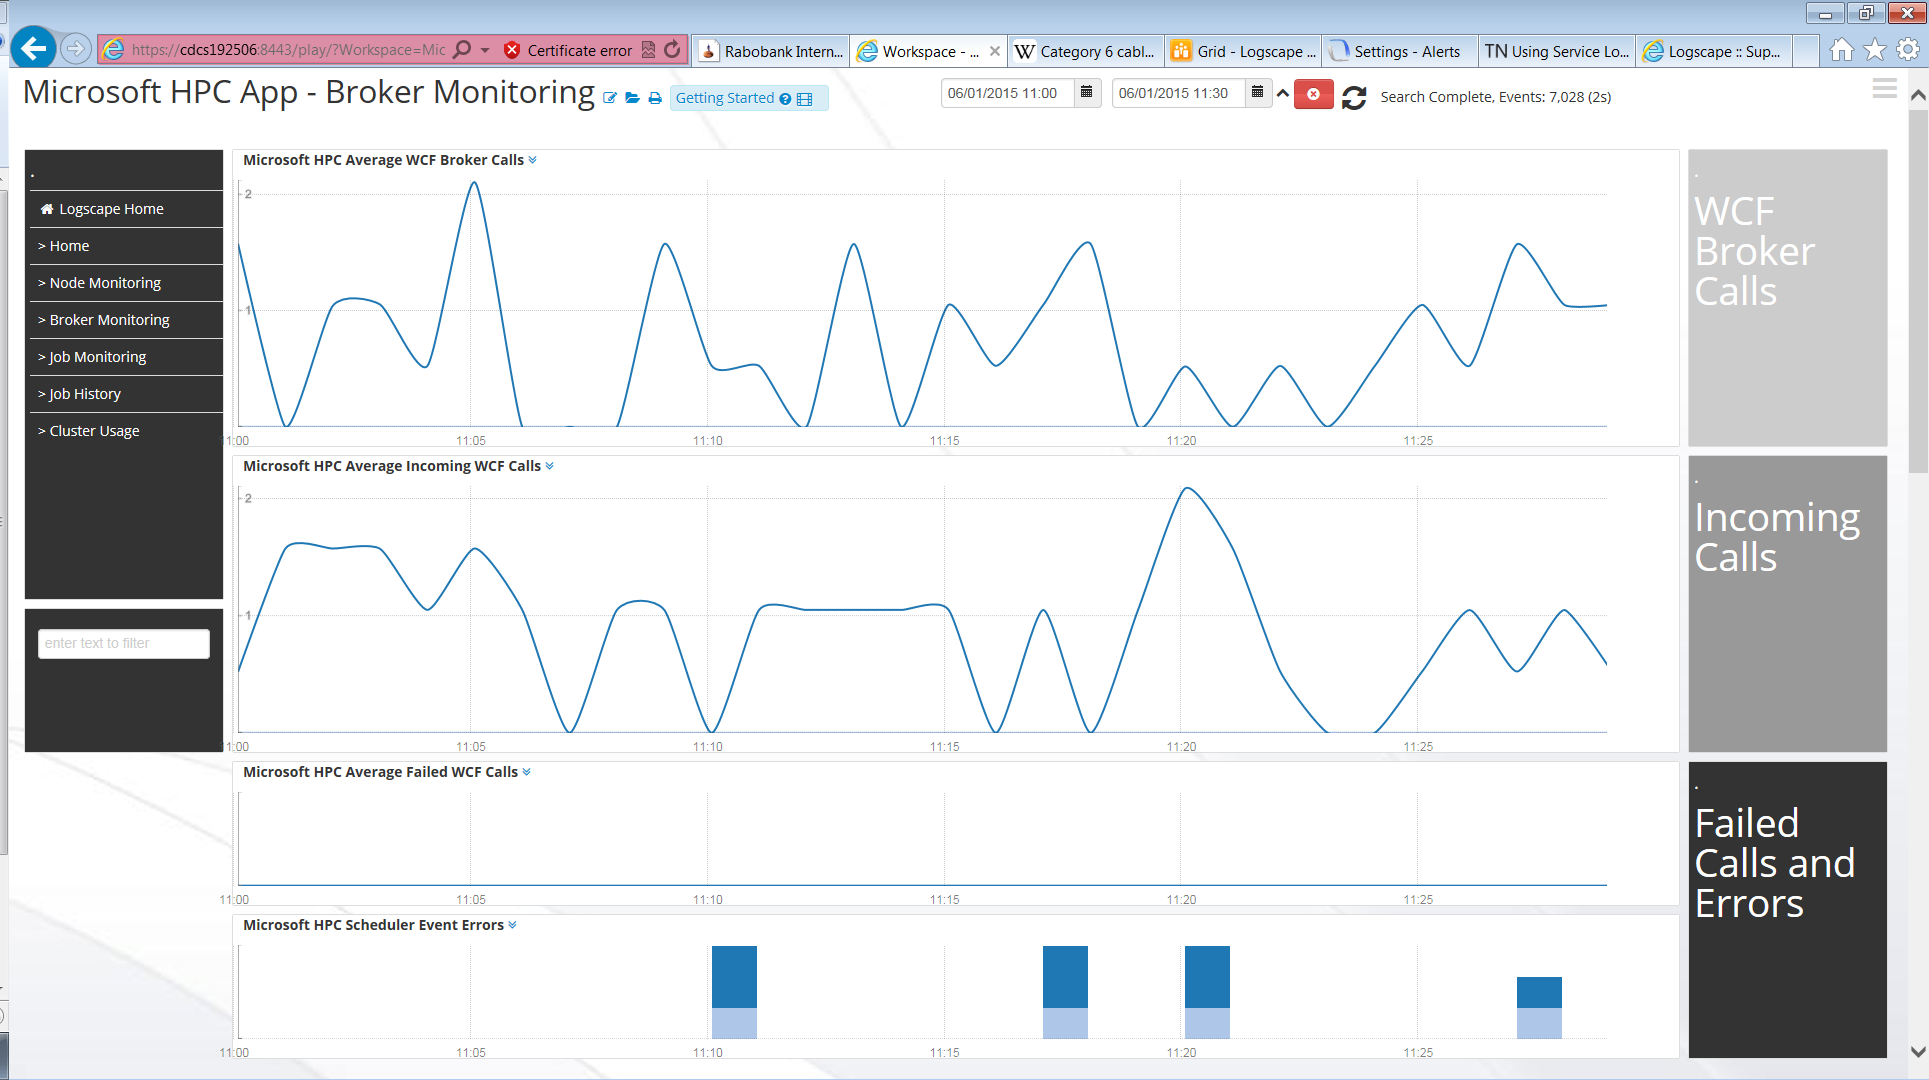
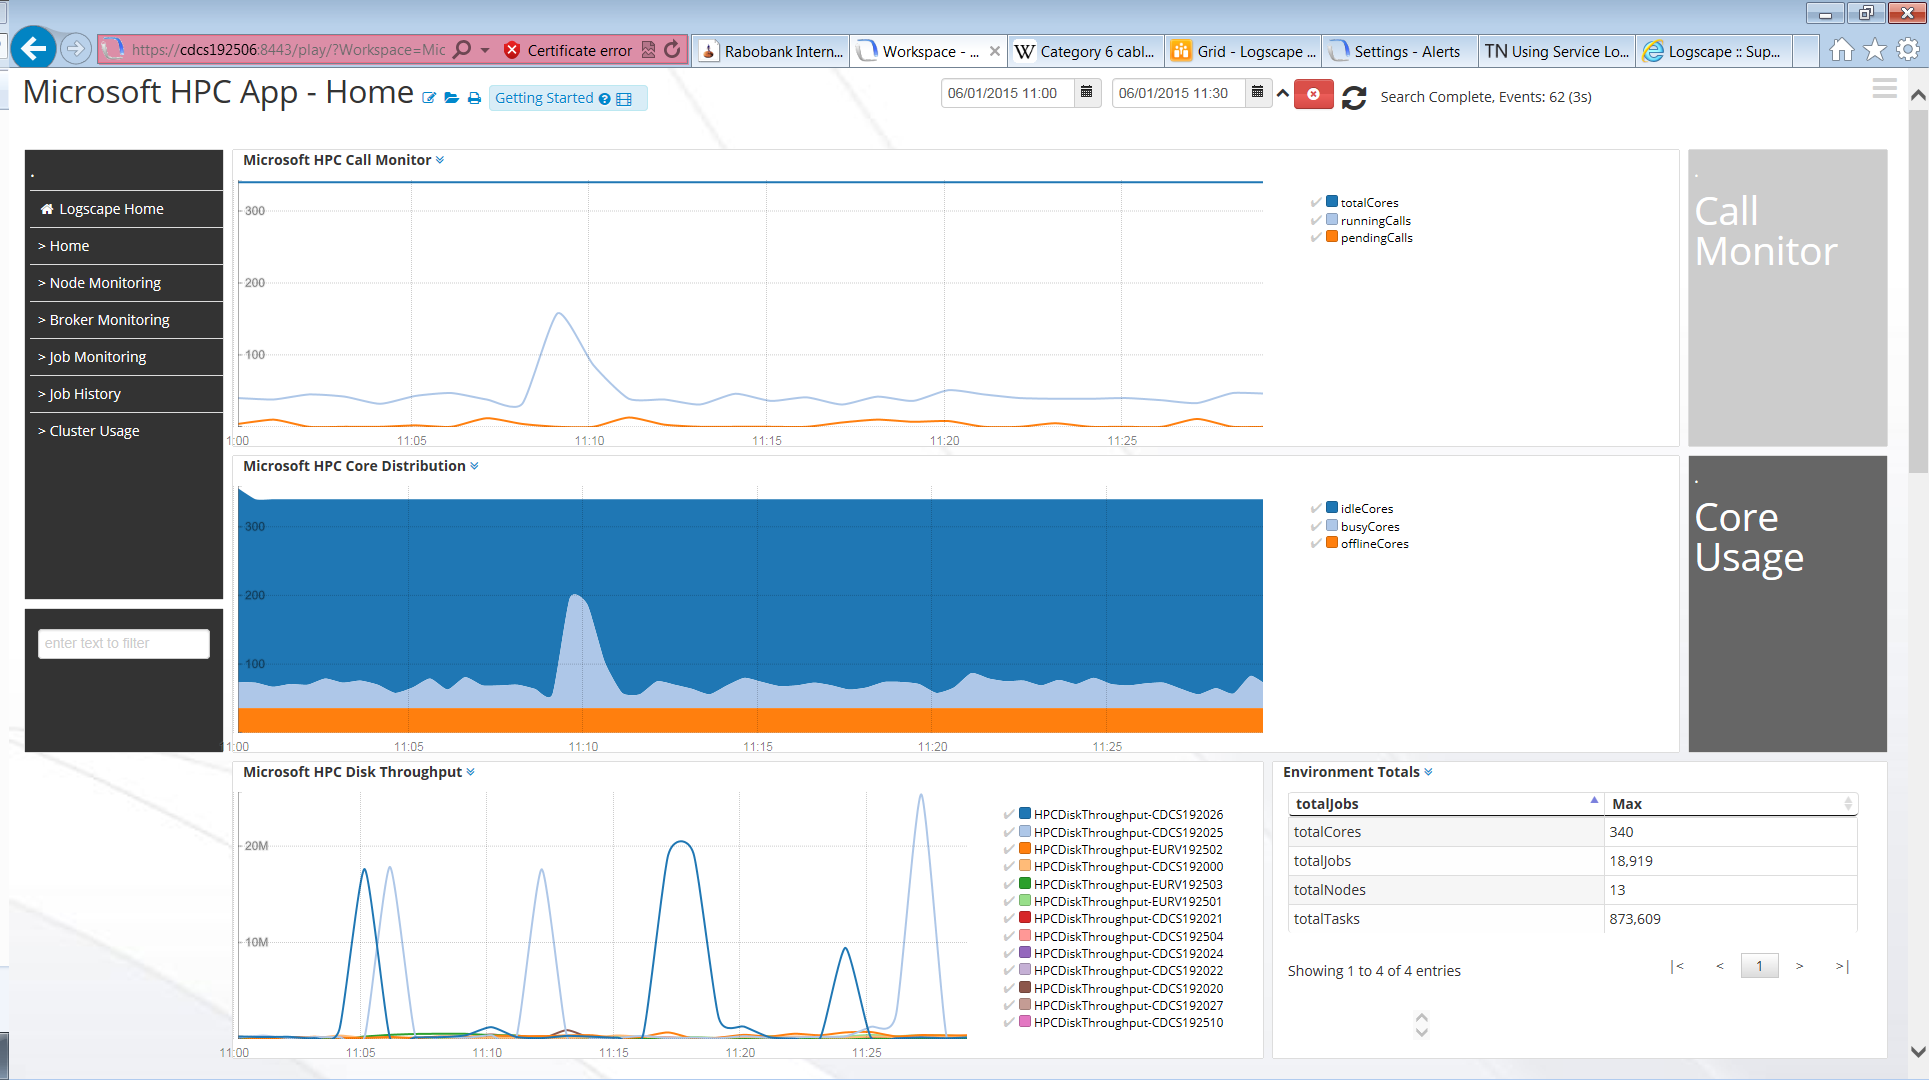
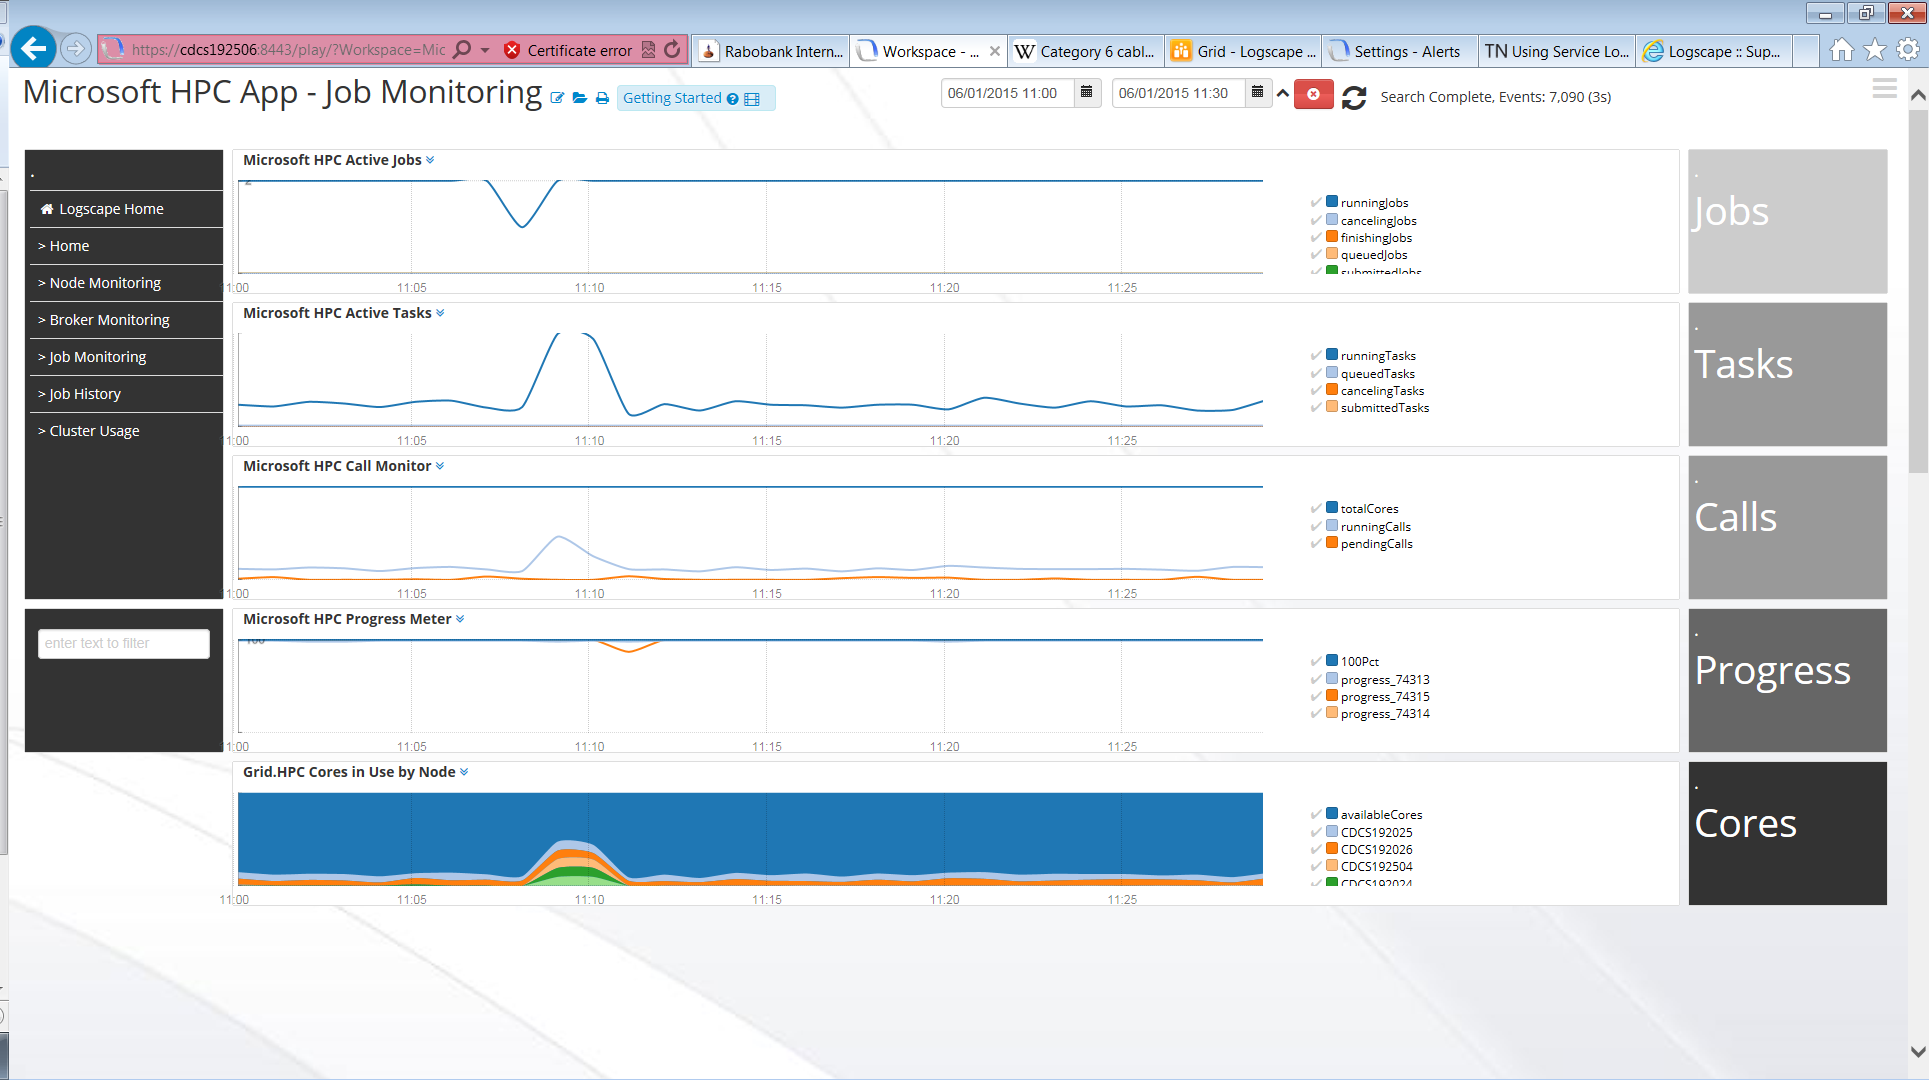
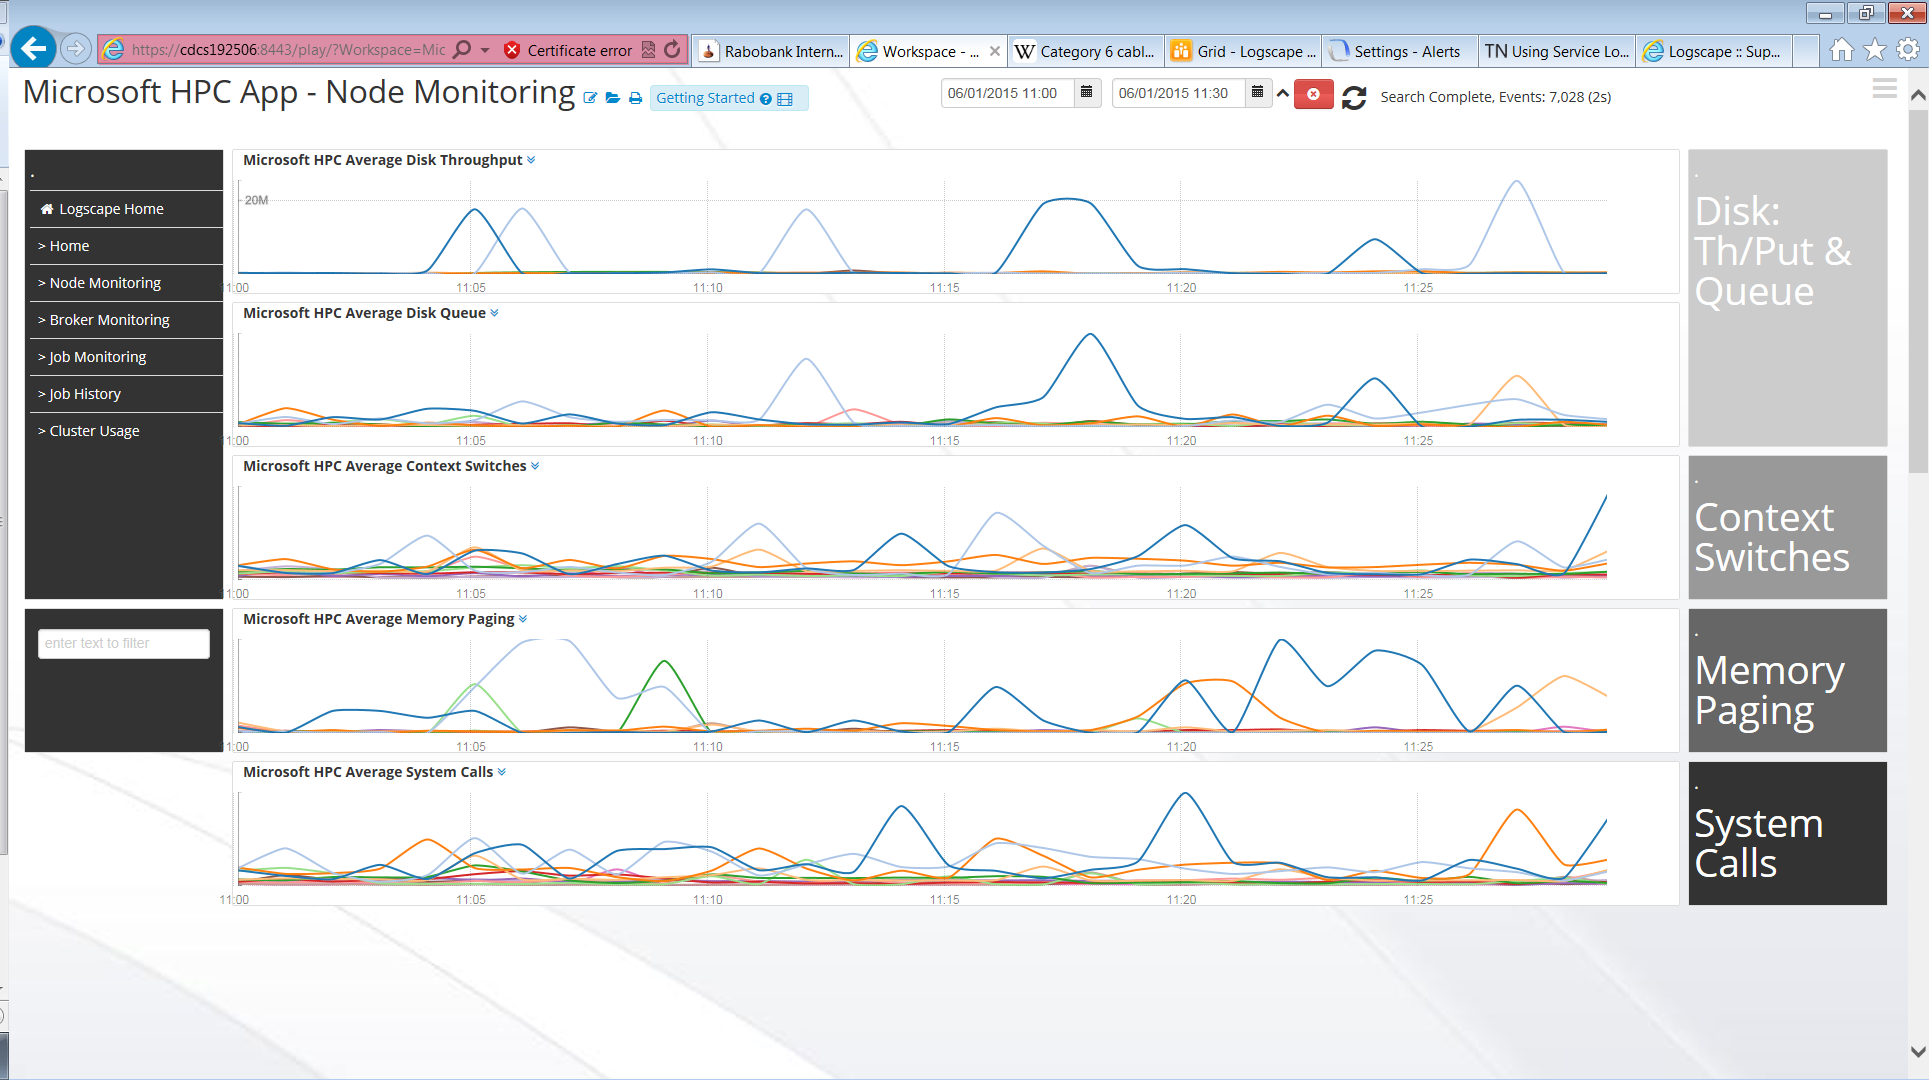
The Microsoft HPC App 1.1 is designed to provide monitoring of an HPC Server 2012 SP1 (or greater) environment.
The three main sources of information: -Powershell: running the cmndlet to pull data from the HeadNode. -SQL: pulling information directly from the database. -Logs: Uncompressing the HPC Server log files.
This app runs scripts and SQL queries at various times, creating output files and then allowing Logscape to ingest them directly.
The HPC LogParser is documented separately, please read the LogParserReadme.txt for details on how to configure and use it.
MicrosoftHPCApp-1.1.bundle = A bundle file which does NOT include the HPC Log Parser EXAMPLE_bundle_with_Log_Parser = A bundle file WITH an HPCParser service.
If you wish to use the LogParser in batch mode, follow the separate instructions and edit the bundle file accordingly.
Make sure to guarantee that their is only one bundle file in the app when it is deployed.
-
Edit the following file: lib/config.properties You need to provide the SQL connection details, see QuickStart.txt for more on this.
-
Edit the Bundle file to ensure you are running the scripts on the Headnode and on the preferred timeframe. For more on Bundle files, check the Logscape documentation.
-
If you are using the LogParser, follow the configuration in the separate documentation.
For each script, you pick the run time and which script to run.
NOTE The lib folder has 2 node metric scripts: NodeMetrics and NodeMetricsFull. NodeMetricsFull includes disk space and processor. However, it is assumed a user will already be using the Logscape Windows App and that this would be duplication. Therefore, by default NodeMetrics is included in the bundle file.
This app extracts a lot of data from the HPC environment. Here is a description of the types provided:
--Constant Metrics hpc_Overview = Outputs the number of jobs in any particular state (running,submitting etc) as well as Core and Node states. hpc_CallTotals = Summary amount of total calls and pending calls. Outputs 0 if no calls are running. hpc_Node = For each Node, performance metrics such as cores in use and disk queue.
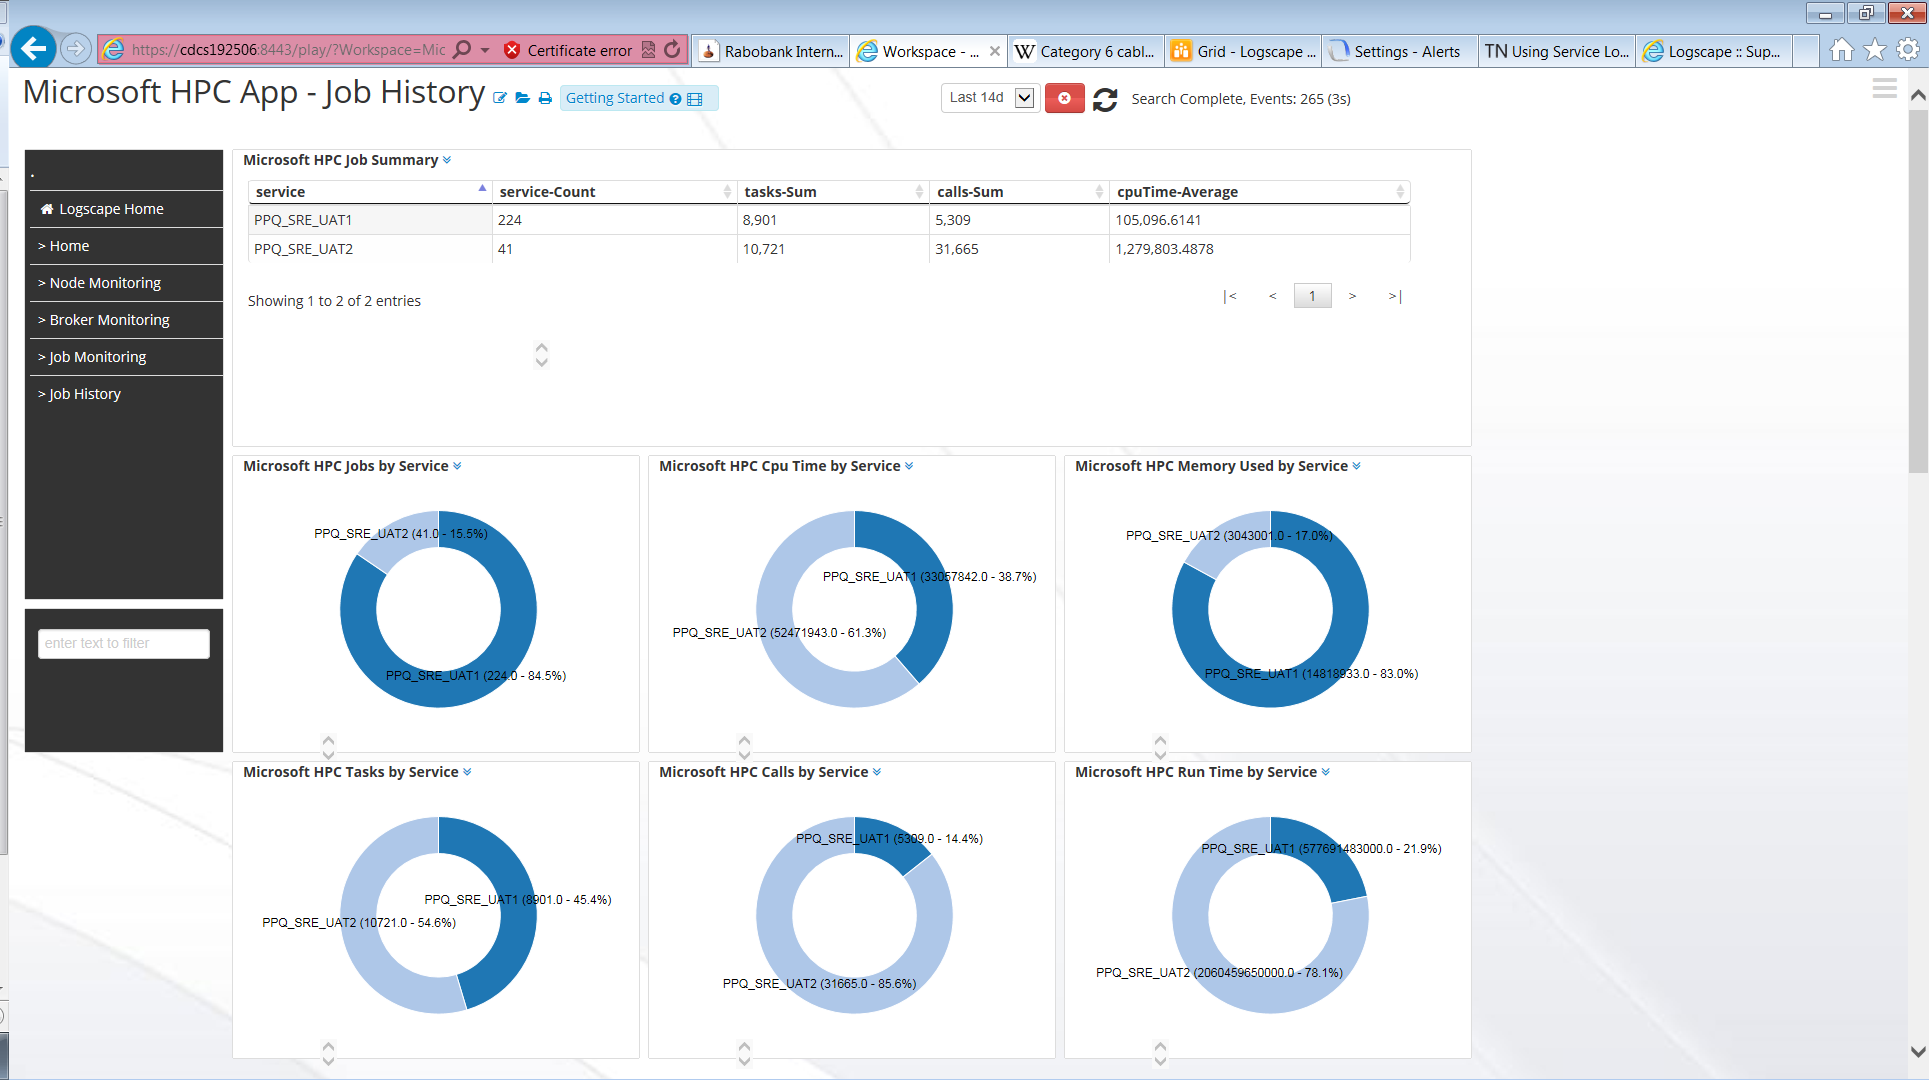
--Event Driven Metrics hpc_JobHistory = For each completed Job, it's type, terminating event, run time and tasks hpc_SchedEvents = From the Scheduler, event viewer events relating to HPC hpc_CallIndividuals = For each running job, the progress, amount of calls completed and run time. Data only outputted when calls are running.
-- Daily Metrics hpc_Metrics = For each day, an aggregate count of jobs, calls and grid run-time in seconds and minutes for each service type. hpc_Usage = For each Day, a summary of Cluster Utilisation and Availability
This software is provided as written under the GNU license, without any warranty (express or implied) as to it's functionality.
