


Build several tables related to COVID-19 notifications in Brazil in 2020 from public datasets provided by Brazilian Federal Government Organizations.
The Coronavirus Disease 2019, shortly named COVID-19, is a contagious diseased caused by the SARS-CoV-2 virus. The first known case was reported in Wuhan, China, in December 2019. Since then the disease is spreading worldwide leading it to be classified as an ongoing pandemic by World Health Organization (WHO) in March 2020.
Despite WHO's recommendations to people and governments in order to slow down the contamination rate, there were not standard actions to fight against the disease. Some governments who followed the WHO recommendations, such as New Zealand, had reported small number of cases and deaths. On the other hand, there were governments who activelly fought against its population minimizing the disease effects and spreaded fake news about it had several problems. Brazil falls at this second category.
In this project we are crossing hospitalization data containing some charateristics of the patient reported on a notification report and geographical data such as city coordinates, city area and estimated population. This project uses data from the year 2020 but the patients reports are still being updated in 2021 as new discoveries are done.
In this project we have two kinds of data: the geographical related and the patient related.
📝 Table of Contents The geographical information in this datasets allow an analysis about the effects of the area, perimeter and population size, at city level, in the number of hospitalization notifications.
This dataset comes from a shape file provided by the brazilian Institute for Applied Economic Research (IPEA). The data was converted in tabular form by QGIS, calculating the city centroids, getting its coordinates and calculating each city area and perimeter in degree-units. The projection standard addopted here was the EPSG:4618-SAD69
| Column | Description | Source |
|---|---|---|
key (string) |
Concatenated strings where the first two letters are the initials of an federative unit and the following letters is the non-ascii characteres in the city name | IPEA |
NOME_UF (string) |
Federative Unit initials. | IPEA |
CODIGO_UF(float) |
Federative unit code. | IPEA |
xcoord (float) |
Estimated city's centroid Latitude. | IPEA |
ycoord (float) |
Estimated city's centroid Longitude. | IPEA |
area_perimeter_area (float) |
Estimated city's area in square degree. | IPEA |
area_perimeter_perimeter (float) |
Estimated city's perimeter in degrees. | IPEA |
The files to generate this dataset is in the meshsubdirectory.
📝 Table of Contents This dataset is provided by the Brazilian Institute of Geography and Statistics (IBGE) and contains information about populational estimatives by city in 2020.
| Column | Description | Source |
|---|---|---|
UF (string) |
Federative unit initials. | IBGE |
COD. UF (string) |
Federative unit initials. | IBGE |
COD. MUNIC (string) |
City code. | IBGE |
NOME DO MUNICÍPIO (string) |
City name. | IBGE |
POPULAÇÃO ESTIMADA (string) |
Population estimative in 2020. | IBGE |
This dataset is provided by the Brazilian Institute of Geography and Statistics (IBGE) and contains details aboutl the structural territorial organization of Brazil.
| Column | Description | Source |
|---|---|---|
UF (int) |
Federative unit code. | IBGE |
Mesoregião geográfica (string) |
Mesoregion code. | IBGE |
Nome_Mesoregião (string) |
Mesoregion name. | IBGE |
Microrregião Geográfica (string) |
Microregion code. | IBGE |
Nome_Microrregião (string) |
Microregion name. | IBGE |
Município (string) |
Partial city code. | IBGE |
Código Município Completo (string) |
Full city code. | IBGE |
Nome_Município (string) |
City name. | IBGE |
Distrito (string) |
Partial district code. | IBGE |
Código de Distrito Completo (string) |
Full district code. | IBGE |
Nome_Distrito (string) |
District name. | IBGE |
📝 Table of Contents This is a small dataset written by hand containing the following columns:
| Column | Description | Source |
|---|---|---|
code_uf (int) |
Federative unit code. | IBGE |
uf_name (int) |
Federative unit name. | IBGE |
uf (int) |
Federative unit initials. | IBGE |
📝 Table of Contents
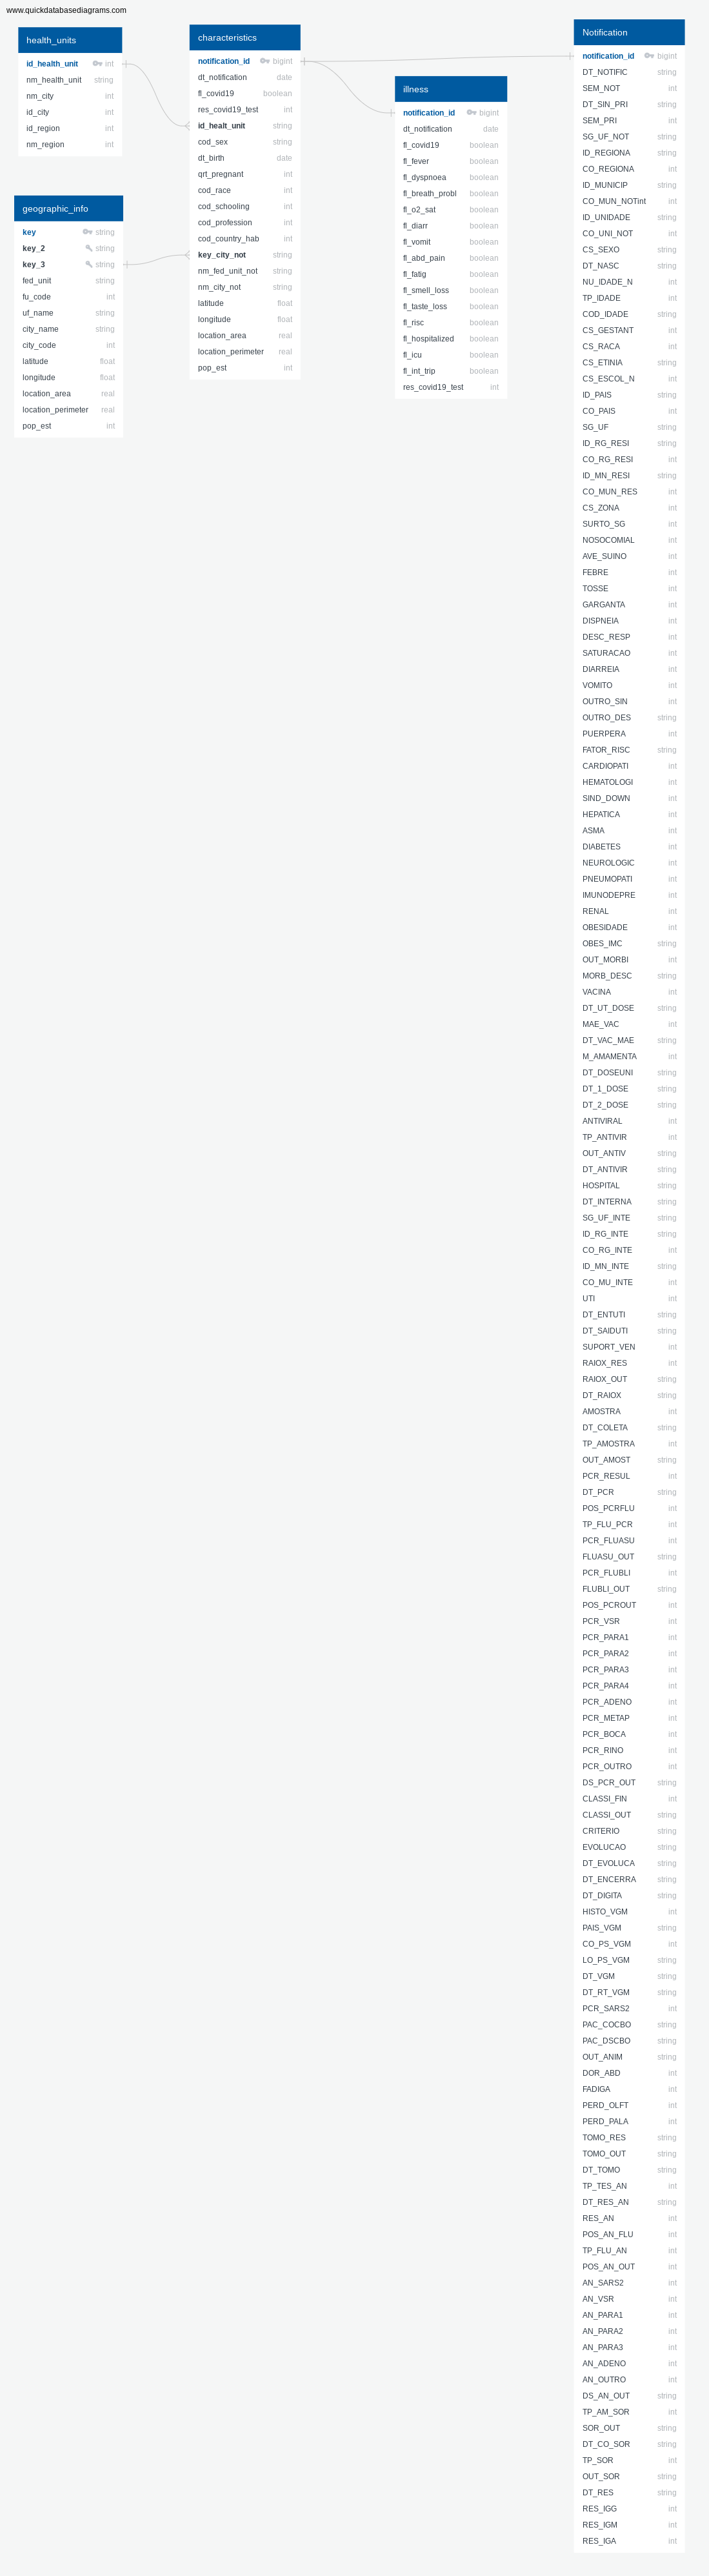
The geographic_info dimension table is generated by joining and transforming the data related to the geographic-related datasets mentioned above.
| Column | Description | Source |
|---|---|---|
key (string) |
Key value where the first two characteres is the federative unit initials and the following characteres are the city name without non-ascii characteres. |
POP2020_20210331.xls |
key_2 (string) |
Key value composed by the federative unit name and city name without the non-ascii characteres. |
geo_info.csv |
key_3 (string) |
Key value composed by the federative unit name and city name with non-ascii characteres replaced by asciicharacteres. |
geo_info.csv |
fed_unit (string) |
Federative unit initials. | POP2020_20210331.xls |
fu_code (int) |
Federative unit initials. | geo_info.csv |
uf_name (string) |
Federative unit name. | uf_brazil.csv |
city_name (string) |
City name. | POP2020_20210331.xls |
city_code (string) |
City code. | POP2020_20210331.xls |
latitude (float) |
City centroid latitude. | geo_info.csv |
longitude (float) |
City centroid longitude. | geo_info.csv |
location_area (float) |
City area. | geo_info.csv |
location_perimeter (float) |
City perimeter. | geo_info.csv |
pop_est (float) |
Estimated population size. | POP2020_20210331.xls |
The patient-related dataset contain a more details that are covered in the documentation at input/notification/data-docs/subdirectory. Here we will focuses only on the final tables and its source. These information comes from file INFLUD-05-04-2021.csv provided by Brazilian Health Ministry which contains hospitalized patient data in Brazil at 2020. All columns sources in the tables below comes from this table.
📝 Table of Contents This table contains informations about the health unit where a patient is hospitalized.
| Column | Description | Column Source |
|---|---|---|
id_health_unit (int) |
Health unit identification number. | CO_UNI_NOT |
nm_health_unit (string) |
Health unit name. | ID_UNIDADE |
nm_city (string) |
City name where the health unit is in. | ID_MUNICIP |
id_city (int) |
City code where the health unit is in. | CO_MUN_NOT |
id_region (float) |
Region code where the health unit is in. | CO_REGIONA |
nm_region (float) |
Region name where the health unit is in. | ID_REGIONA |
📝 Table of Contents This table contains information about the patient's characteristics.
| Column | Description | Column Source |
|---|---|---|
notification_id (int) |
Notification code generated by monotonically_increasing_id() Spark method. |
monotonically_increasing_id() |
dt_notification (date) |
Notification date. | DT_NOTIFIC |
fl_covid19 (boolean) |
If is suspicious the patient has COVID-19 (True) or not (False). |
SURTO_SG |
res_covid19_test (int) |
Result of COVID-19 test. | RES_IGG |
id_health_unit_notific (int) |
Health unit code. | CO_UNI_NOT |
cod_sex (string) |
Patient sex code. | CS_SEXO |
dt_birth (date) |
Patient date of birth. | DT_NASC |
qrt_pregnant (int) |
Quarter of pregnancy. | CS_GESTANT |
cod_race (int) |
Code of race. | CS_RACA |
cod_schooling (int) |
Patient schooling code. | CS_ESCOL_N |
cod_profession (int) |
Patient profession code. | PAC_DSCBO |
key_city_not (int) |
Foreign key to join city notifications with geographic_info dimension table |
SG_UF_NOT, ID_MUNICIP |
nm_fed_unit_not (string) |
Federal unit name where the notification was registered | SG_UF_NOT |
| nm_city_not (int) | Name of the city where the notification was registered | ID_MUNICIP |
| cod_country_hab (int) | Patient living country code. | CO_PAIS |
📝 Table of Contents This table contains information about diagnostics of some illness the patient has.
| Column | Description | Column Source |
|---|---|---|
notification_id (int) |
Notification code generated by monotonically_increasing_id() Spark method. |
monotonically_increasing_id() |
fl_covid19 (bool) |
Flag that identifies if the problems are related to COVID-19 (True) or not (False). |
SURTO_SG |
fl_fever (bool) |
Flag that identifies if the patient has fever (True) or not (False). |
FEBRE |
fl_dyspnoea (bool) |
Flag that identifies if the patient has dyspnoea (True) or not (False). |
DISPNEIA |
fl_breath_probl (bool) |
Flag that identifies if the patient has any breath difficulties (True) or not (False). |
DESC_RESP |
fl_o2_sat (bool) |
Flag that identifies if the patient has blood O2 saturation (True) or not (False). |
SATURACAO |
fl_diarr (bool) |
Flag that identifies if the patient has diarrhea (True) or not (False). |
DIARREIA |
fl_vomit (bool) |
Flag that identifies if the patient is puking (True) or not (False). |
VOMITO |
fl_abd_pain (bool) |
Flag that identifies if the patient has abdominal pain (True) or not (False). |
DOR_ABD |
fl_fatig (bool) |
Flag that identifies if the patient has fatigue (True) or not (False). |
FADIGA |
fl_smell_loss (bool) |
Flag that identifies if the patient has smell loss (True) or not (False). |
PERD_OLFT |
fl_taste_loss (bool) |
Flag that identifies if the patient has taste loss (True) or not (False). |
PERD_PALA |
fl_hospitalized (bool) |
Flag that identifies if the patient needs to be hospitalized (True) or not (False). |
HOSPITAL |
fl_icu (bool) |
Flag that identifies if the patient needs to go to inencive care unit (True) or not (False). |
UTI |
fl_int_trip (bool) |
Flag that identifies if the patient went abroad recently (True) or not (False). |
HISTO_VGM |
res_covid19_test (int) |
Code of the sorological COVID-19 test. | RES_IGG |
📝 Table of Contents
To execute this project you'll need a dl.cfg file containing an AWS access and secret ID for an IAM User role with permissions of write and read an S3 bucket. The content of this file must be in the following format:
[AWS]
AWS_ACCESS_KEY_ID=A******************5
AWS_SECRET_ACCESS_KEY=E**************************************S
You will need to install Python 3.7.6 with PySpark 2.4.3 installed. After installing Python, you can install PySpark by running the following command:
pip install pyspark==2.4.3
- In order to run
PySpark 2.4.3, you will need to installJava JDK 8.- We strongly recomment to use a specific virtual environment in Python to execute this project. Click here to know more about virtual environments in Python or here to know more about virtual environments in Anaconda.
You should also install all other packages listed on requirements.txt file in order to emulate the same Python environment this project was developed. You can do this by running:
pip install -r requirements.txt
To execute this project you only need to download this repository, activate the virtual environment with Python 3.7.6 and PySpark 2.4.3 in it and run the following command:
python lake.py
- You can run this code in test mode without accessing a
S3bucket. To do this you just have to uncomment the lines478and479and comment the lines469to476inlake.py.- The test files are in
inputandoutputsubirectories in this repository.
After a few seconds you should see the following lines in your command line:
        0 artifacts copied, 70 already retrieved (0kB/20ms)
YY/MM/DD HH:MM:SS WARN Utils: Your hostname, username resolves to a loopback address: XXX.X.X.X; using XXX.XXX.X.X instead (on interface wlp3s0)
YY/MM/DD HH:MM:SS WARN Utils: Set SPARK_LOCAL_IP if you need to bind to another address
YY/MM/DD HH:MM:SS WARN NativeCodeLoader: Unable to load native-hadoop library for your platform... using builtin-java classes where applicable
Using Spark's default log4j profile: org/apache/spark/log4j-defaults.properties
Setting default log level to "WARN".
To adjust logging level use sc.setLogLevel(newLevel). For SparkR, use setLogLevel(newLevel).
If the file was successfully finished you should see a sample of the final table:
--------+------------------+--------+
-------------+------------------+-------+
|notification_id|dt_notification|fl_covid19|res_covid19_test|id_health_unit|cod_sex|  dt_birth|qrt_pregnant|cod_race|cod_schooling|cod_profession|cod_country_hab|key_city_not|nm_fed_unit_not|fu_code_not|nm_city_not| latitude| longitude|location_area|location_perimeter|pop_est|
+---------------+---------------+----------+----------------+--------------+-------+----------+------------+--------+-------------+--------------+---------------+------------+---------------+-----------+-----------+---------+----------+-------------+------------------+-------+
|             90|     2019-12-29|     false|            null|       2372967|      F|1989-12-31|           5|       2|            1|          null|              1|   cearacati|             CE|         23|    Aracati|-37.68638|-4.6802797|   0.10000686|         2.1396823|  74975|
|           5295|     2019-12-29|      true|            null|       2372967|      F|1969-12-28|           5|       4|            0|          null|              1|   cearacati|             CE|         23|    Aracati|-37.68638|-4.6802797|   0.10000686|         2.1396823|  74975|
|          11807|     2019-12-29|     false|            null|       2372967|      M|1953-12-27|           6|       4|            2|          null|              1|   cearacati|             CE|         23|    Aracati|-37.68638|-4.6802797|   0.10000686|         2.1396823|  74975|
|          14341|     2019-12-29|     false|               2|       2372967|      M|1964-12-27|           6|       1|            1|          null|              1|   cearacati|             CE|         23|    Aracati|-37.68638|-4.6802797|   0.10000686|         2.1396823|  74975|
|          16768|     2019-12-29|     false|            null|       2372967|      M|1937-12-26|           6|       4|            1|          null|              1|   cearacati|             CE|         23|    Aracati|-37.68638|-4.6802797|   0.10000686|         2.1396823|  74975|
+---------------+---------------+----------+----------------+--------------+-------+----------+------------+--------+-------------+--------------+---------------+------------+---------------+-----------+-----------+---------+----------+-------------+------------------+-------+
And you should also see the results of the quality checks:
############
Running quality check for output/health_units:
Number of rows and columns: (6675,6)
############

############
Running quality check for output/illness:
Number of rows and columns: (1189742,18)
############

############
Running quality check for output/geographic_info/*/*.parquet:
Number of rows and columns: (16671,17)
############

############
Running quality check for output/characteristics:
Number of rows and columns: (1181724,21)
############
In this quality check is important to notice that
characteristicstable can't be greater than theillnesstable. However the dataset can be smaller because of theinner joinwithgeographical_infodataset. Unfurtunatelly there is no standardization between government city databases and the COVID-19 Notifications databases.
📝 Table of Contents
The following questions can be answered with the characteristics table:
- How many COVID-19 notifications we have per...
- City.
- State.
- Health Unit.
- Are pregnant women are more susceptible to have COVID-19? If yes, at which quarter?
- Has the schooling degree, profession or age any relation with the COVID-19 cases?
This project uses Spark as an engine to process the data and was tested with 450 MB of data input. Spark alocates data in memory to run it's calculations and in situations we are running out off memory the engine will persist the data in disk.
Spark works with resilient distributed datasets (RDD) that are well suited to work in big data scenarios. So we don't need to worry about the programming.
Only the POP2020_20210331.xls input data could increase by 100x. The others input files doesn't grow because this would mean that the number of cities and federative units were increased by 100x. In these static datasets (geo_info.csv,RELATORIO_DTB_BRASIL_DISTRITO.xls, uf_brazil.csv) we are OK to work with non-big data tools.
📝 Table of Contents
If you need to run this script daily at an unpleasent time (like 3AM) you could automate the execution by using the task scheduler of your system or other software you have on your machine after running a script that update your source file POP2020_20210331.xls or replace it with the same information. The lake.py script only transform and load the data from a given source directory, but it doesn't update the files in this source directory.
📝 Table of Contents Amazon S3 can support many parallel connections and it scales on demand. So there's no problem.
- PySpark - Cluster computing system. Good tool to process big datasets.
- QGis - A Free and Open Source Geographic Information System. Good tool to work with shape files.
- Pandas - Good tool analyze small datasets in Python.
- Python - General purpose programming language.
- Quick Database Diagrams - Tool to create entity relationship diagrams.
- @lkellermann - Idea & Initial work