This demo was designed to display data from Devices connected to IoT Center. Application is using InfluxDB v2 to store the data, Telegraf and MQTT.
- device registration in InfluxDB
- two types of device - virtual and mobile
- remove device from InfluxDB
- remove associated device data
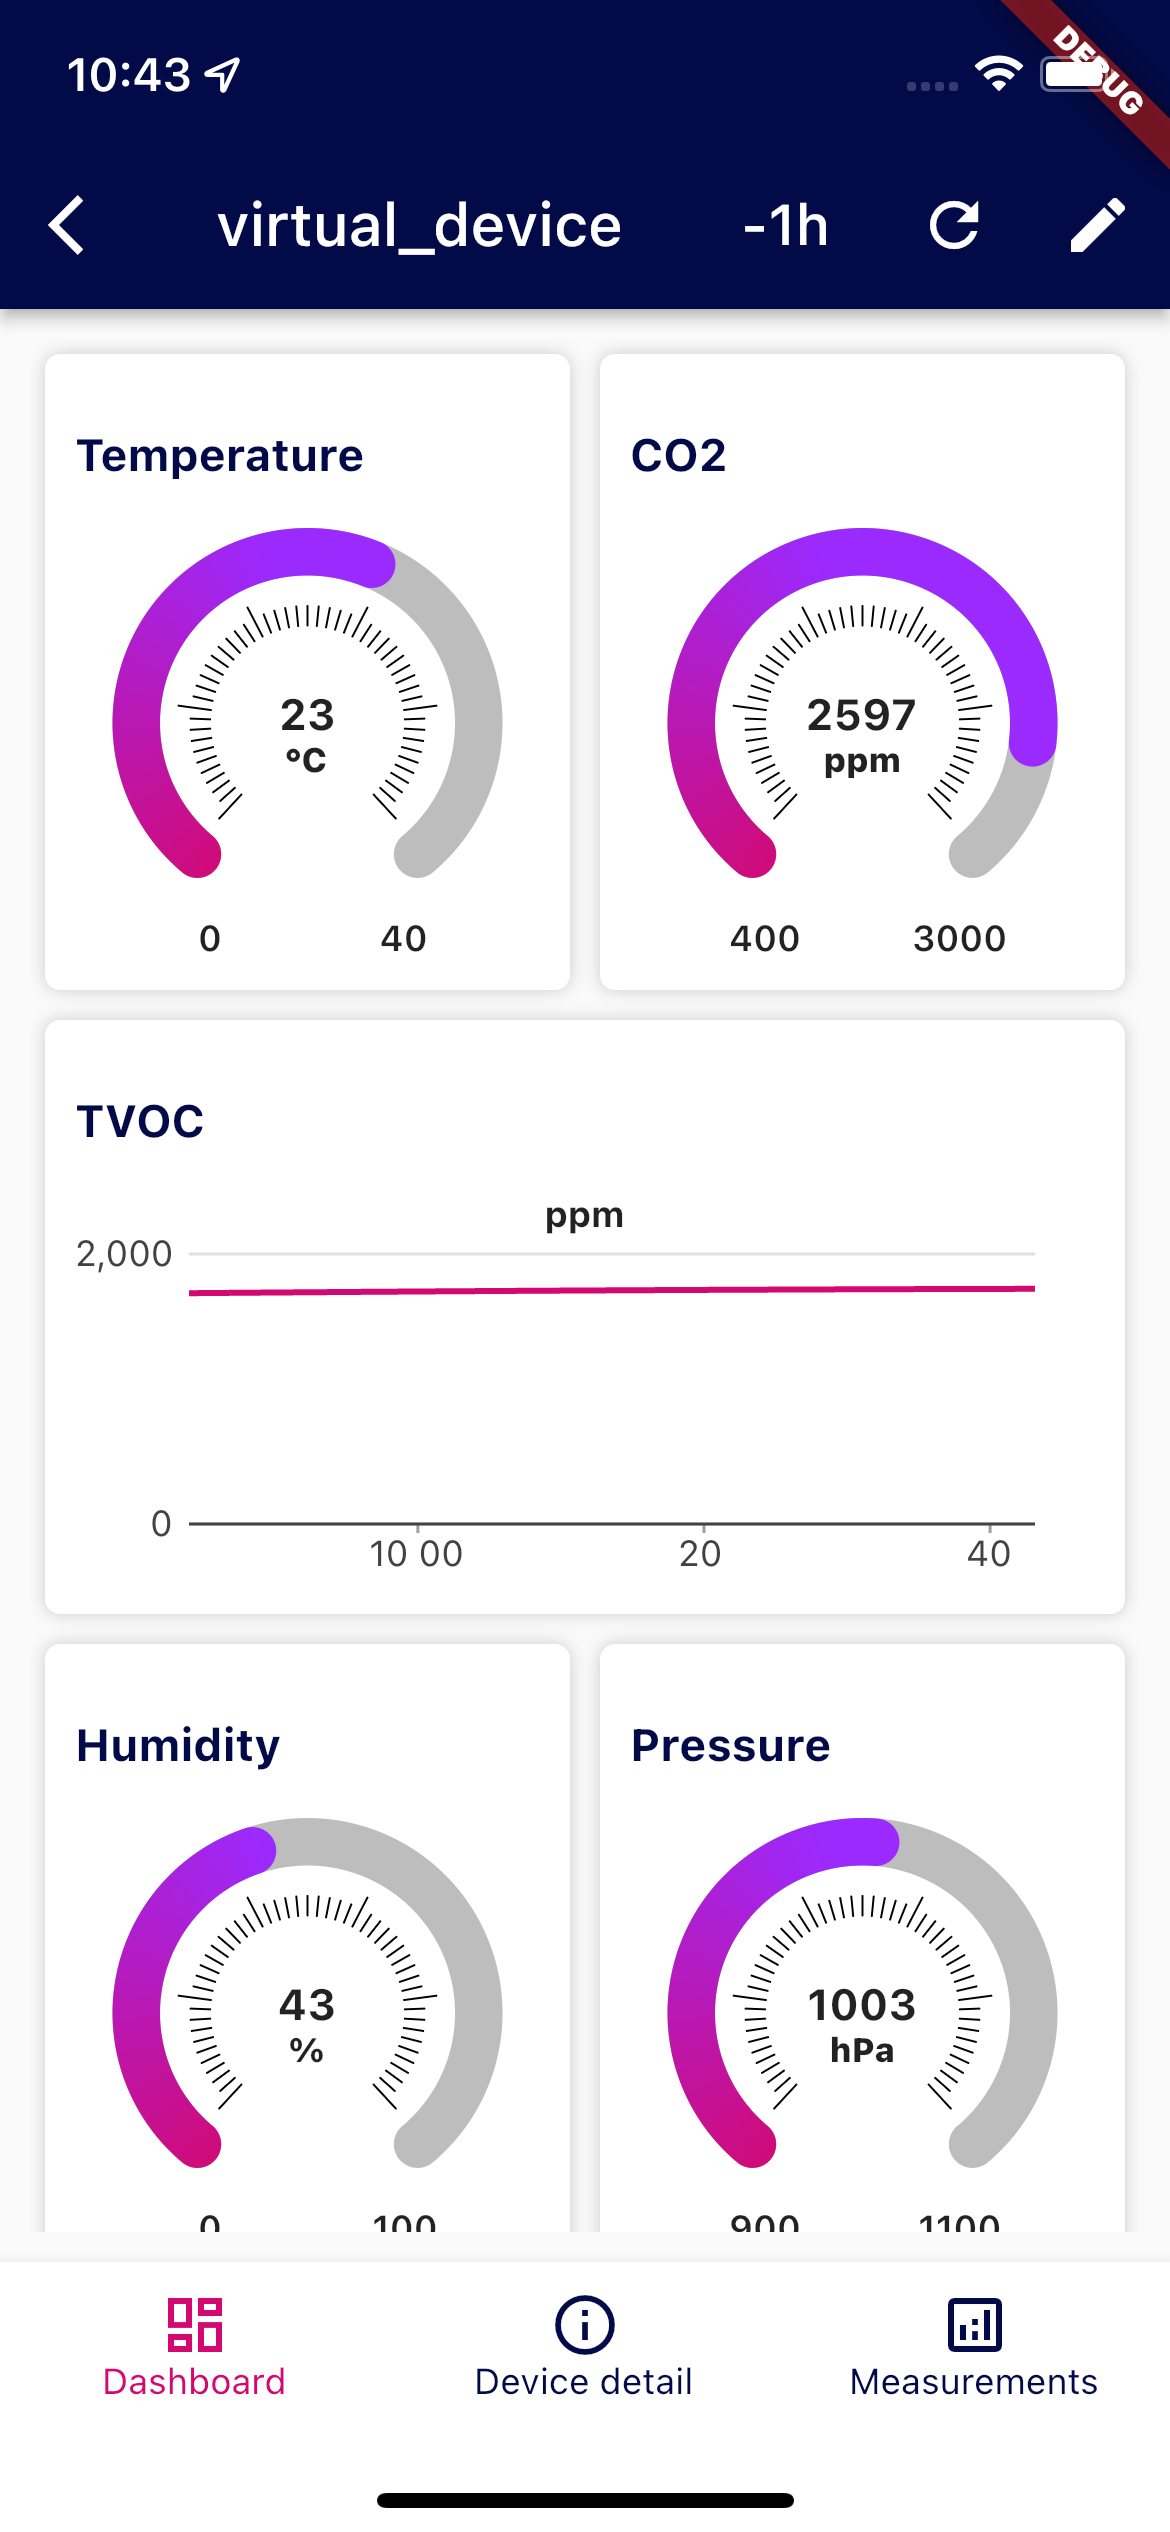
- displaying device info and measurements
- data visualizations in gauge or simple chart
- can use different dashboards for one device
- write testing data to InfluxDB for virtual device
- write sensor data to InfluxDB for mobile device
- dashboard registration in InfluxDB
- two types of dashboards - virtual or mobile
- pair dashboard with device
- editable charts parameters
- customizable - adding and deleting charts
- event based sensor listening
- requesting permission from user
- normalized object for simple write
- detect available sensors
- Flutter - Install Flutter, online documentation
- Docker - Get started with docker
- InfluxDB with mosquitto and telegraf
- you need following ports:
- 1883 (mqtt broker)
- 8086 (influxdb 2.0 OSS)
- for start use docker-compose.yaml:
docker-compose up
- you need following ports:
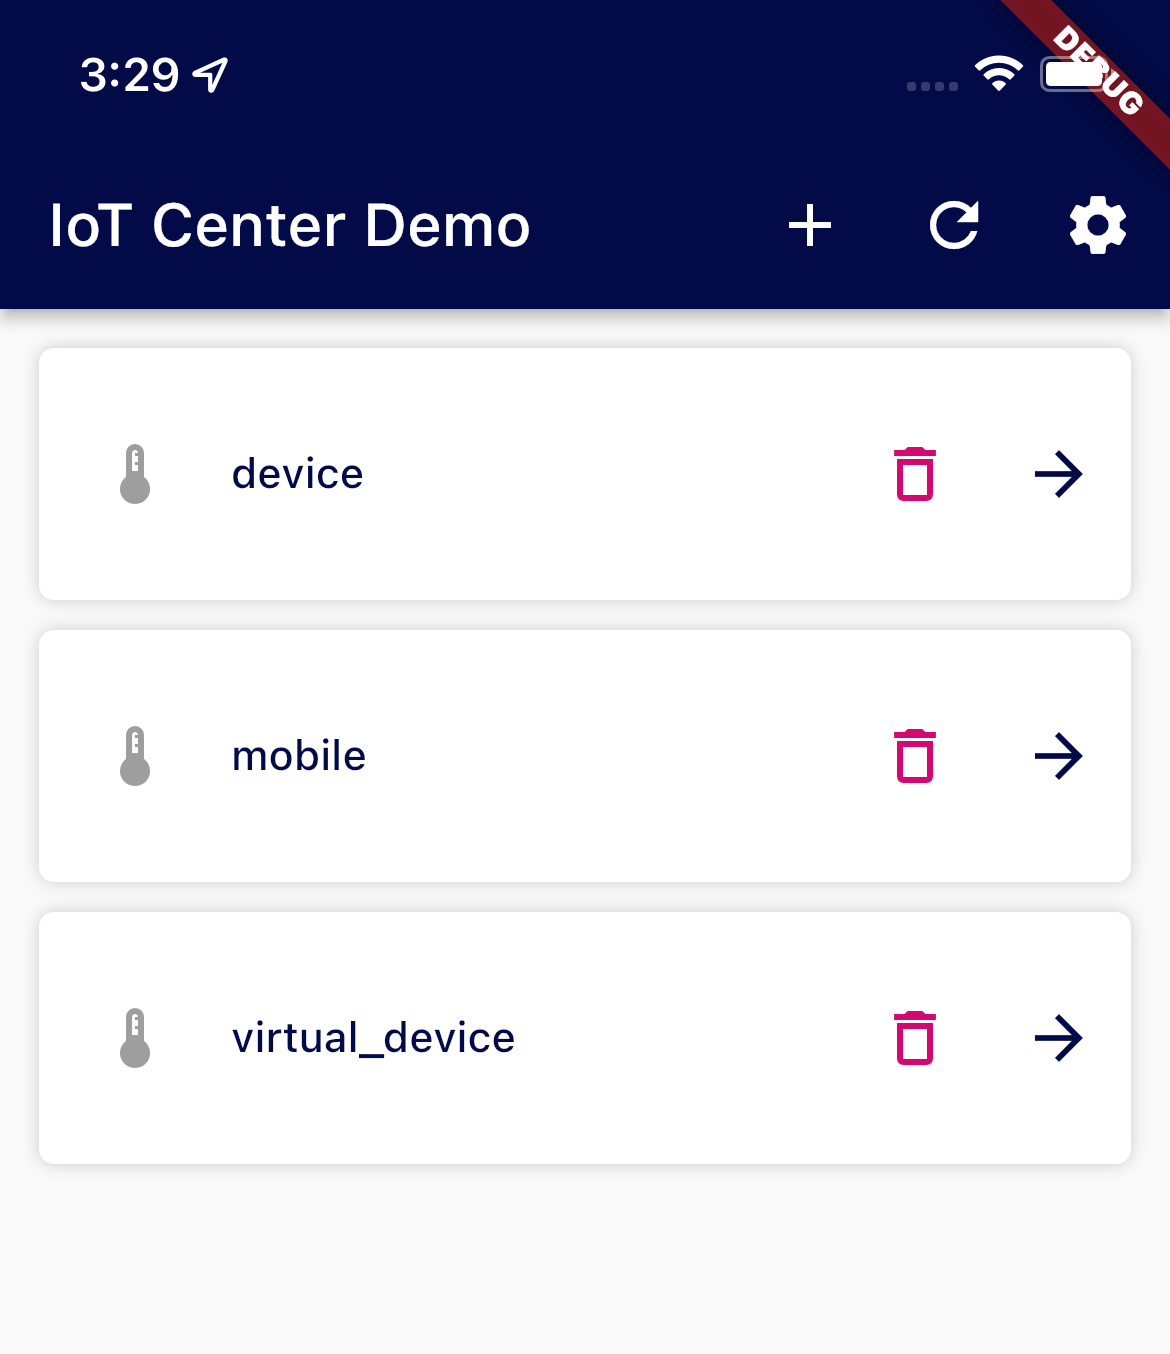
Home page contains device ListView.
App bar on this screen contains basic functions:
Each device tile contains DeviceId and following actions:
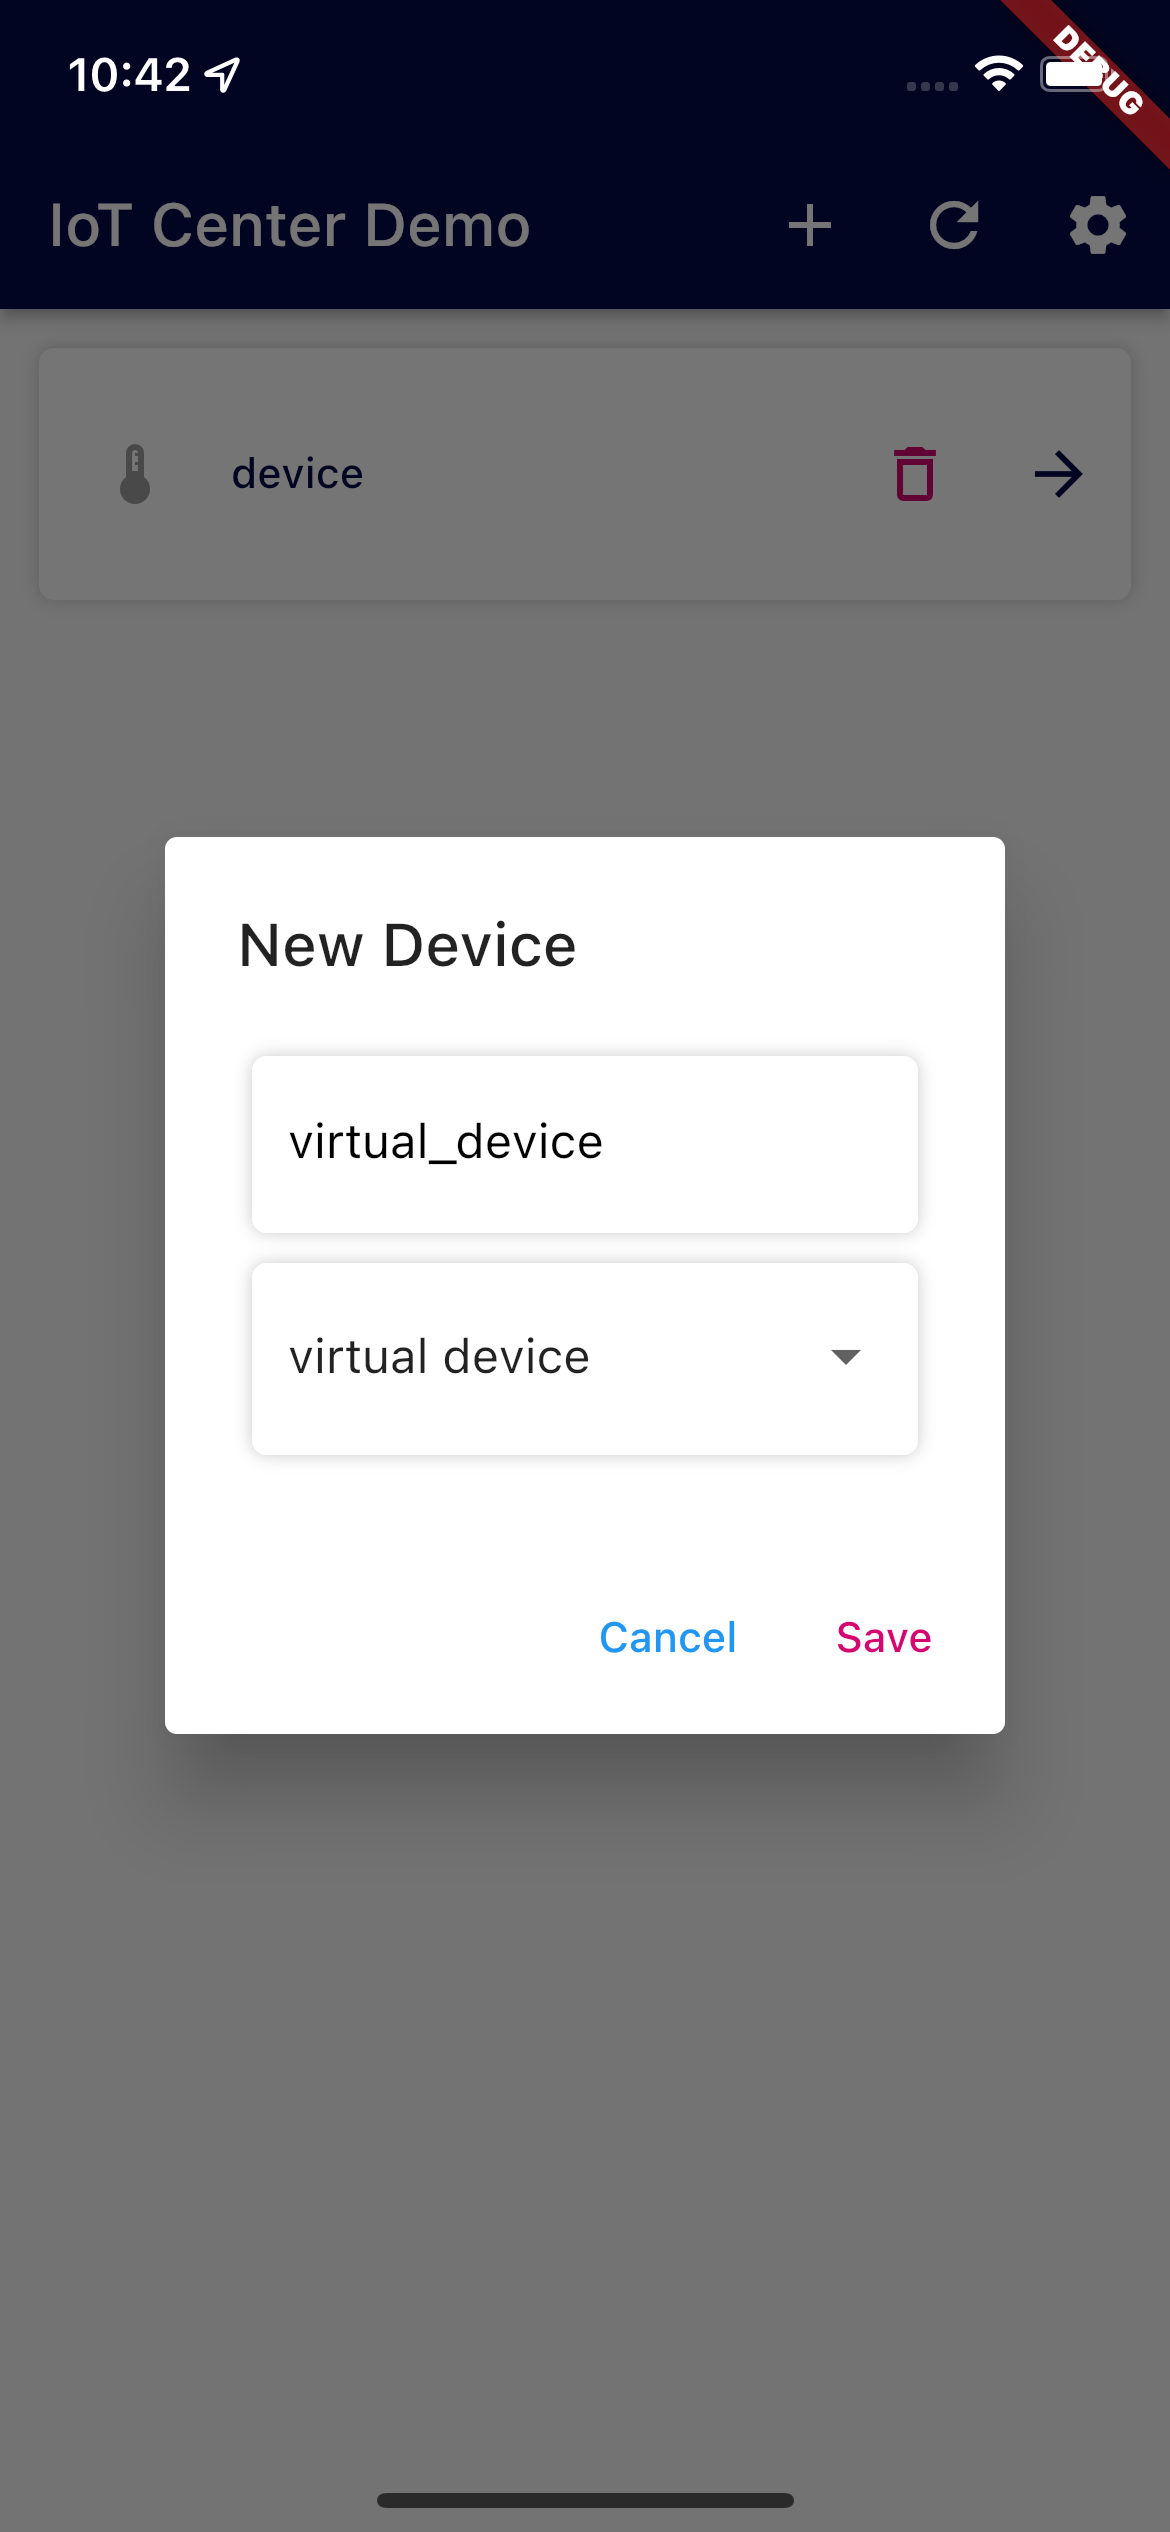
To TextBox enter device id, in DropDownList select type of device and click to Save for create. Device is automatically
registered in InfluxDB - it's write as point via WriteService with its authorization.
Example of creating device point in InfluxDB - createDevice:
var writeApi = _influxDBClient.getWriteService();
var point = Point('deviceauth')
          .addTag('deviceId', deviceId)
          .addField('key', authorization.id)
          .addField('token', authorization.token);
writeApi.write(point);
Creating device IoT authorization via AuthorizationsApi - _createIoTAuthorization:
var authorizationApi = _influxDBClient.getAuthorizationsApi();
var permissions = [
  Permission(
          action: PermissionActionEnum.read,
          resource: Resource(
                  type: ResourceTypeEnum.buckets,
                  id: bucketId,
                  orgID: orgId,
                  org: org)),
  Permission(
          action: PermissionActionEnum.write,
          resource: Resource(
                  type: ResourceTypeEnum.buckets,
                  id: bucketId,
                  orgID: orgId,
                  org: org)),
];
AuthorizationPostRequest request = AuthorizationPostRequest(
        orgID: orgId,
        description: 'IoTCenterDevice: ' + deviceId,
        permissions: permissions);

authorizationApi.postAuthorizations(request);Reload active devices (_value field cannot be empty) from InfluxDB using QueryService with following query -
fetchDevices:
from(bucket: "${_influxDBClient.bucket}")
    |> range(start: -30d)
    |> filter(fn: (r) => r["_measurement"] == "deviceauth"
                     and r["_field"] == "key")
    |> last()
    |> filter(fn: (r) => r["_value"] != "")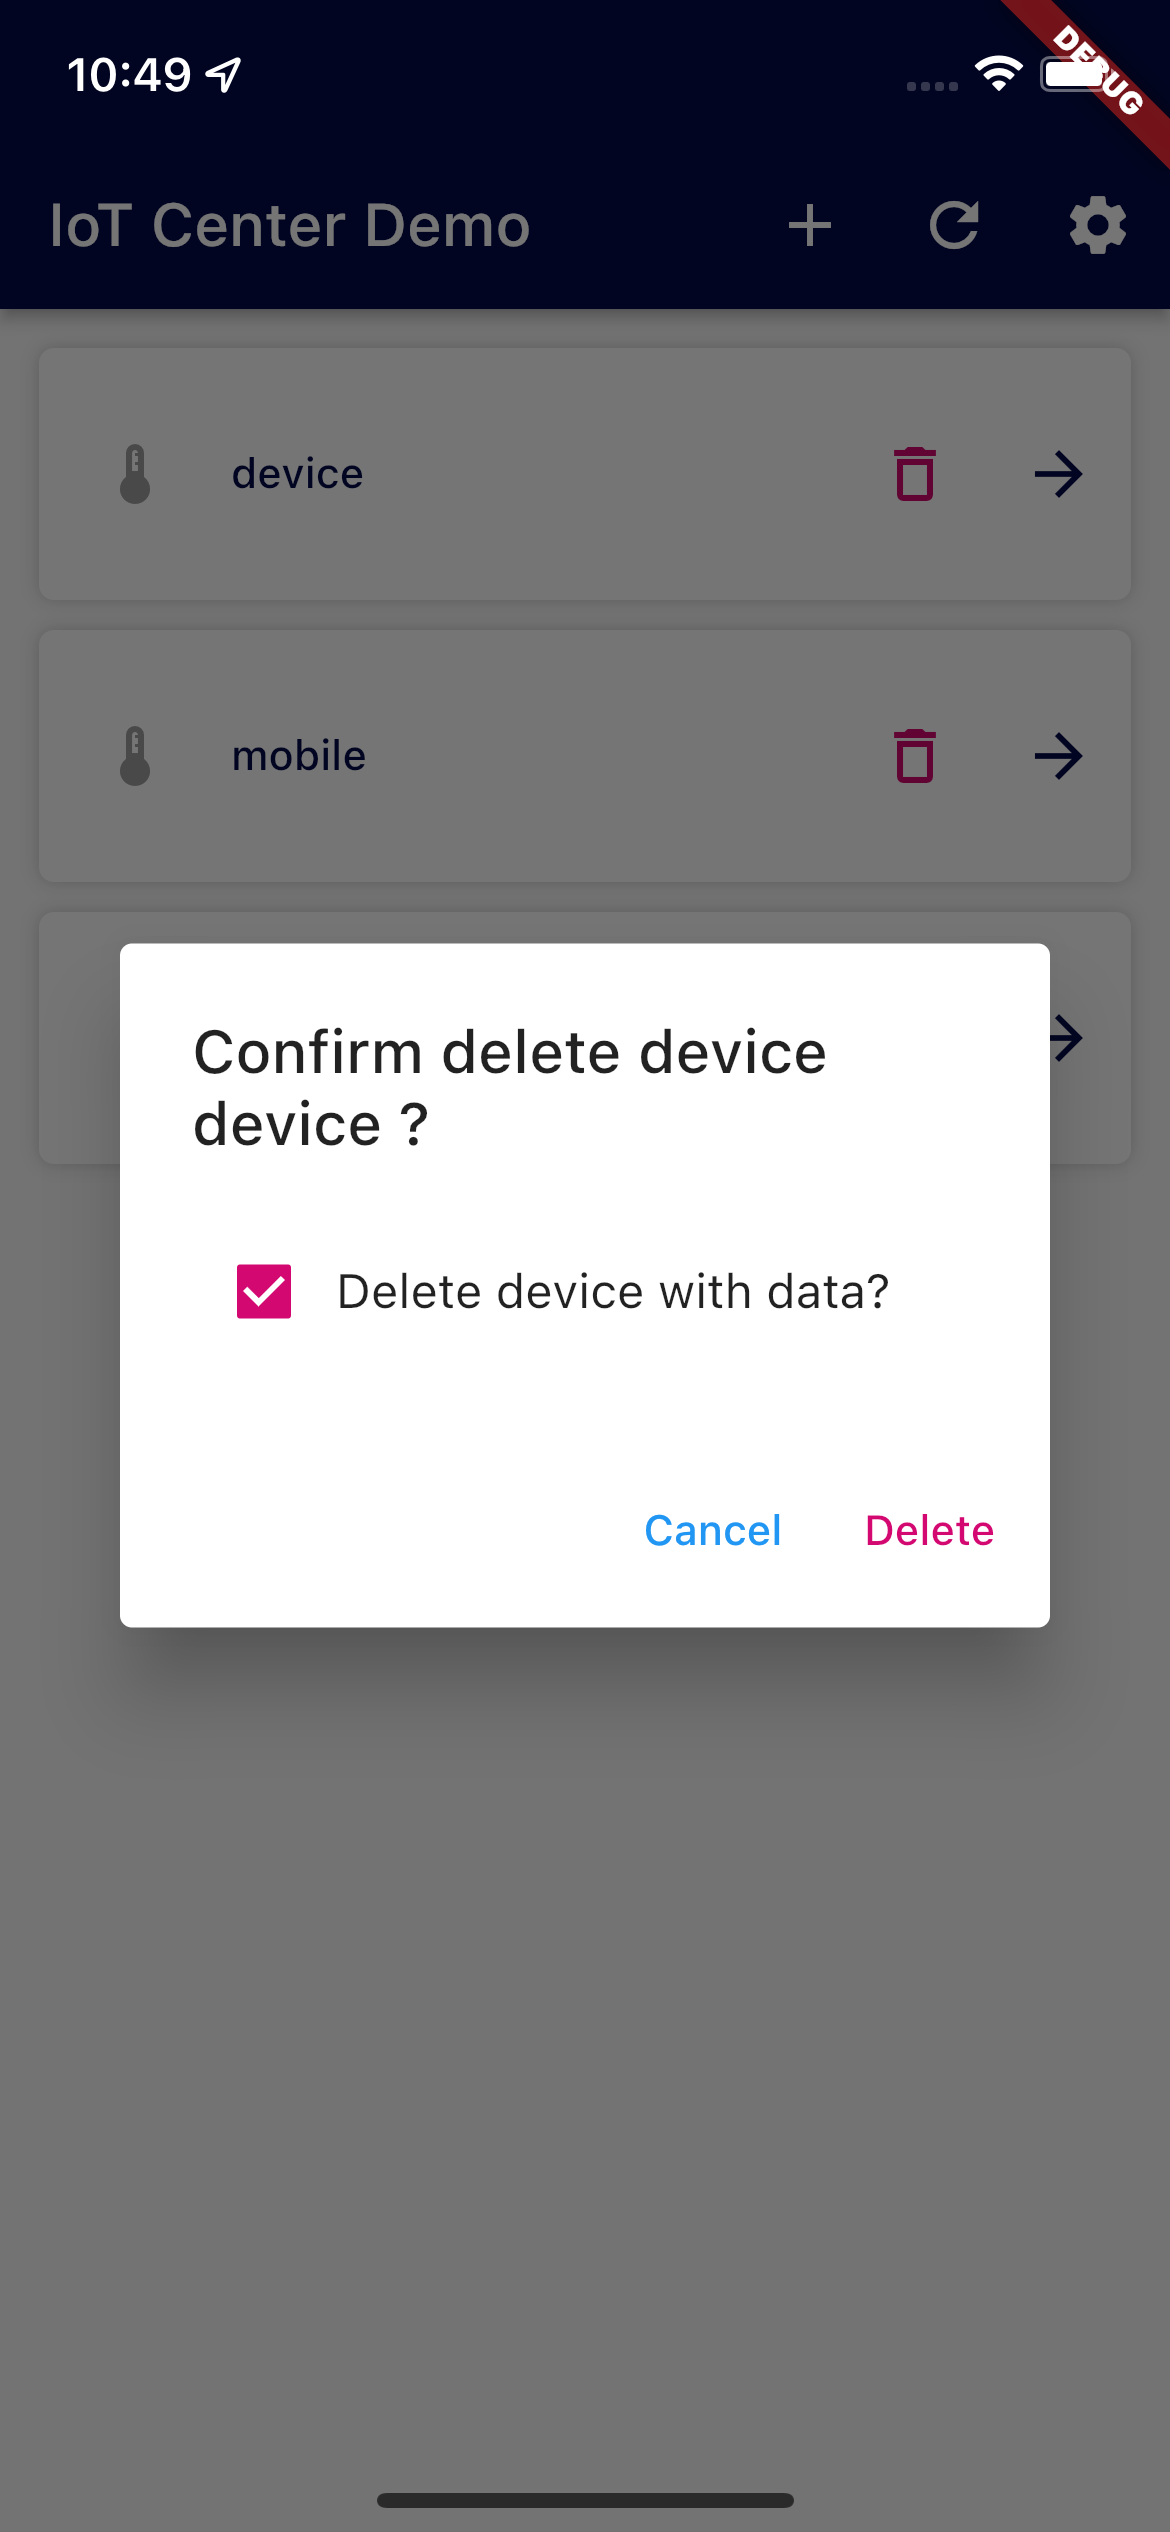
On each tile of device is
for deleting device. After clicking on it, there is confirmation dialog with
CheckBox for choose deleting
device with associated data - if it's checked, data are deleted too.
Example of deleting data via DeleteService - deleteDevice:
var deleteApi = _influxDBClient.getDeleteService();
if (deleteWithData) {
    await deleteApi.delete(
          predicate: 'clientId="$deviceId"',
          start: DateTime(1970).toUtc(),
          stop: DateTime.now().toUtc(),
          bucket: _influxDBClient.bucket,
          org: _influxDBClient.org);
}
After deleting device isn't remove from InfluxDB - in this case deleting is meaning removing of device authorization and IoT Authorization.
Removed device has in InfluxDB empty fields key and token, it means, that device authorization was removed via
WriteService- _removeDeviceAuthorization:
var writeApi = _influxDBClient.getWriteService();
var point = Point('deviceauth')
          .addTag('deviceId', deviceId)
          .addField('key', '')
          .addField('token', '');
writeApi.write(point);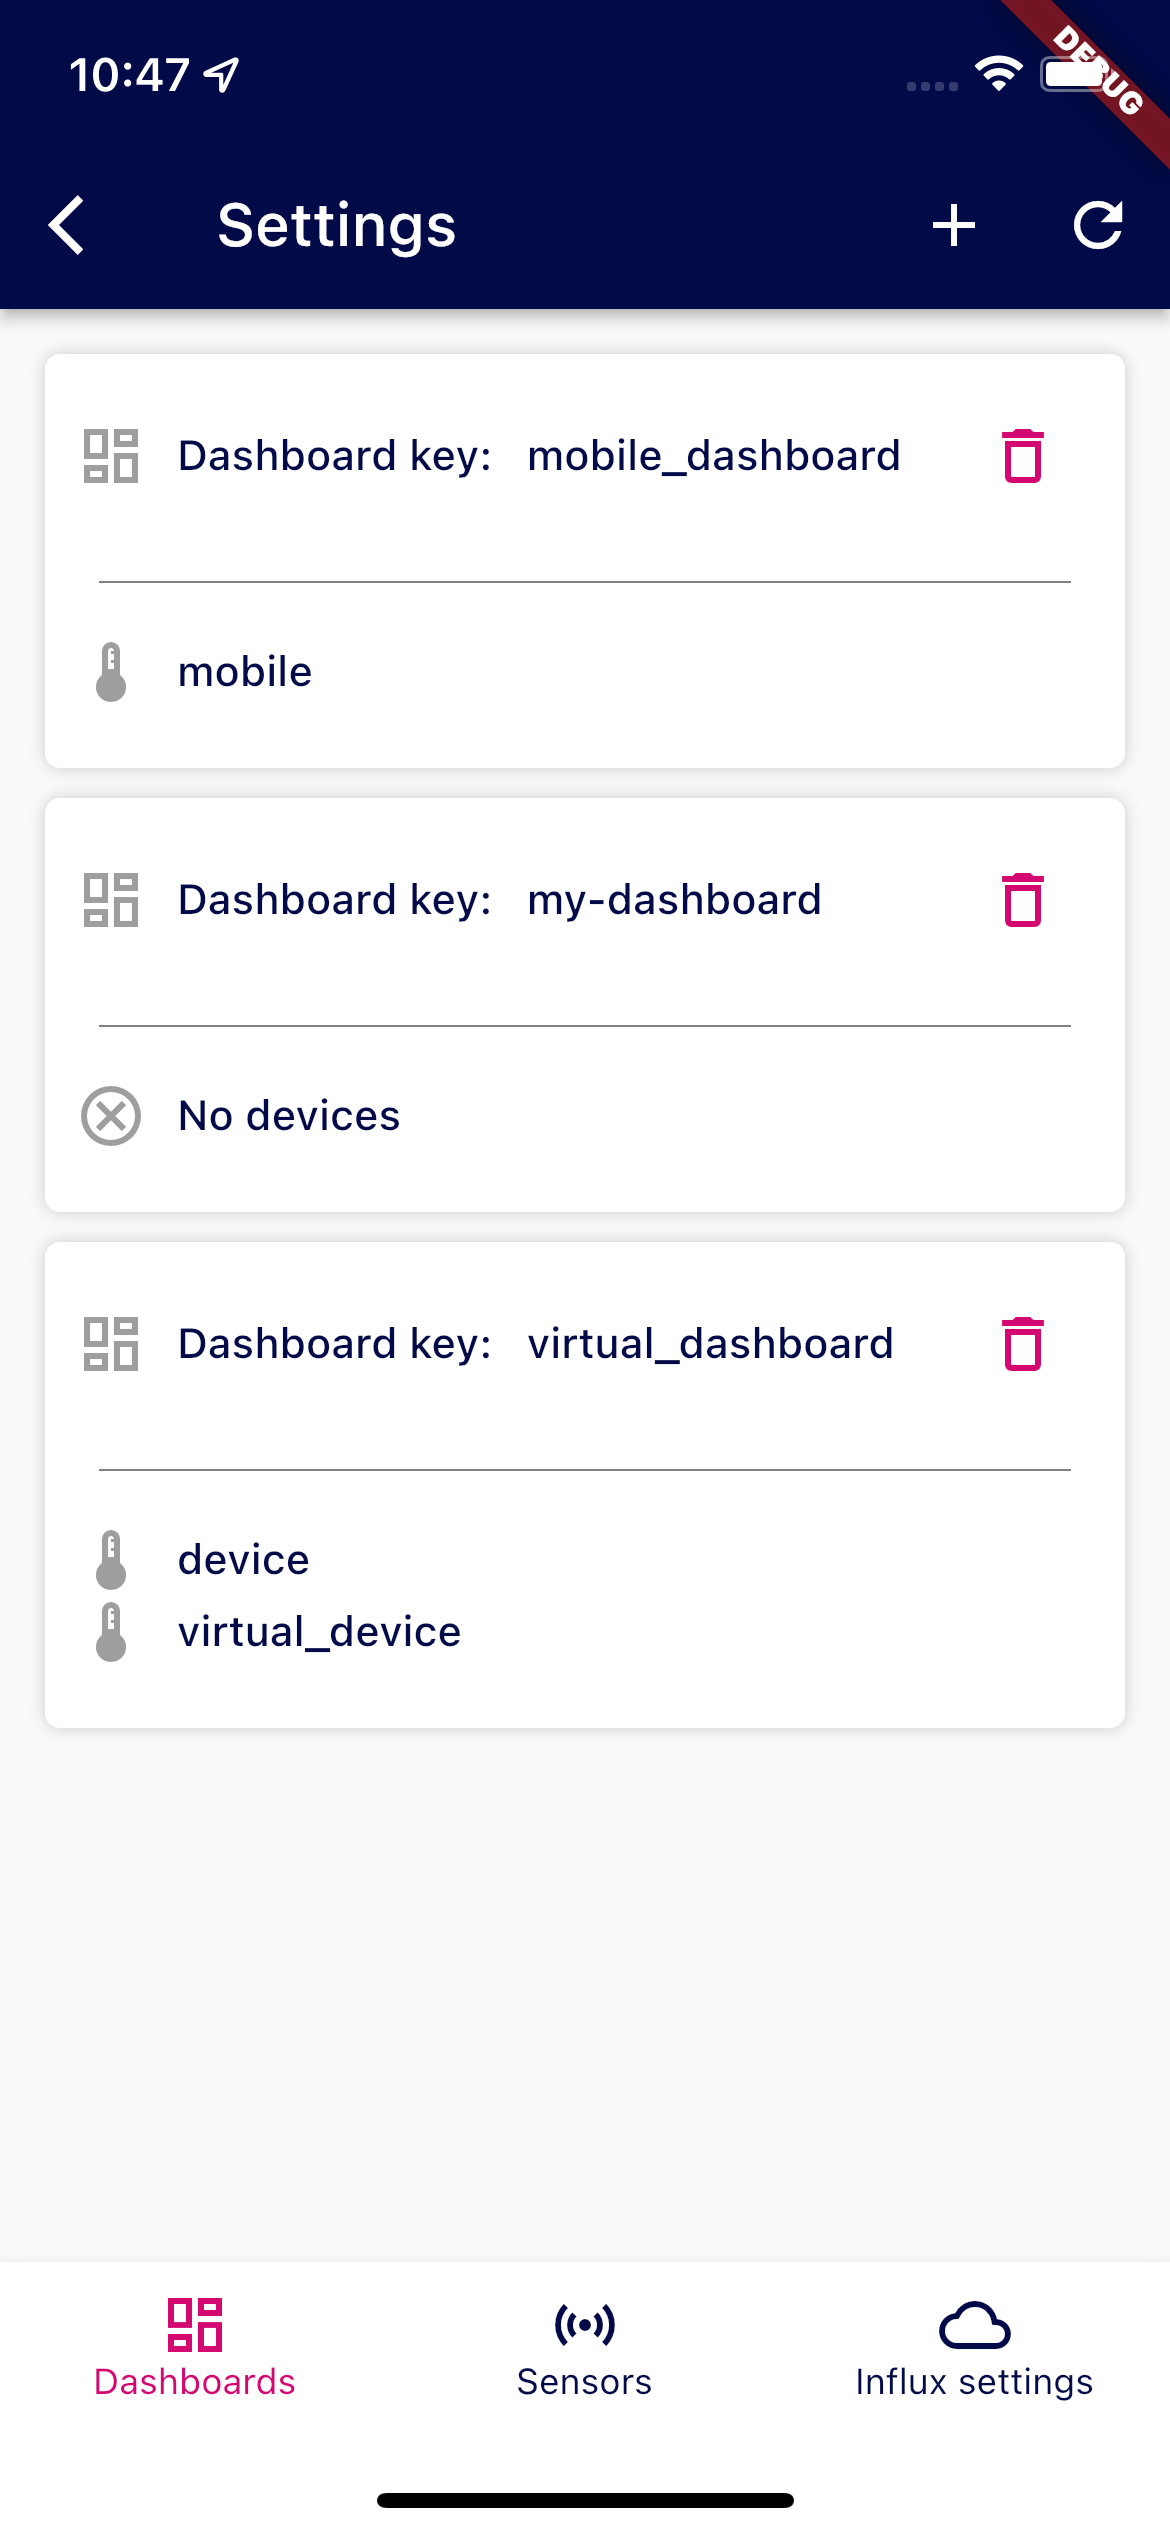
IoT Authorization is also removed, in this case AuthorizationsApi is used - _deleteIoTAuthorization:
 var authorizationApi = _influxDBClient.getAuthorizationsApi();
authorizationApi.deleteAuthorizationsID(key);Dashboard tab contains ListView of all Dashboards stored in InfluxDB, with associated devices.
It uses QueryService to load data - fetchDashboards:
from(bucket: "${_influxDBClient.bucket}")
    |> range(start: -30d)
    |> filter(fn: (r) => r["_measurement"] == "$measurementDashboardFlutter")
    |> last()
For loading associated devices is use QueryService for each dashboard (identify by dashboardKey) -
fetchDashboardDevices:
from(bucket: "${_influxDBClient.bucket}")
    |> range(start: 0)
    |> filter(fn: (r) => r._measurement == "deviceauth")
    |> filter(fn: (r) => r._field == "dashboardKey")
    |> last()
    |> filter(fn: (r) => r._value == "$dashboardKey")
App bar on this tab has this functions:
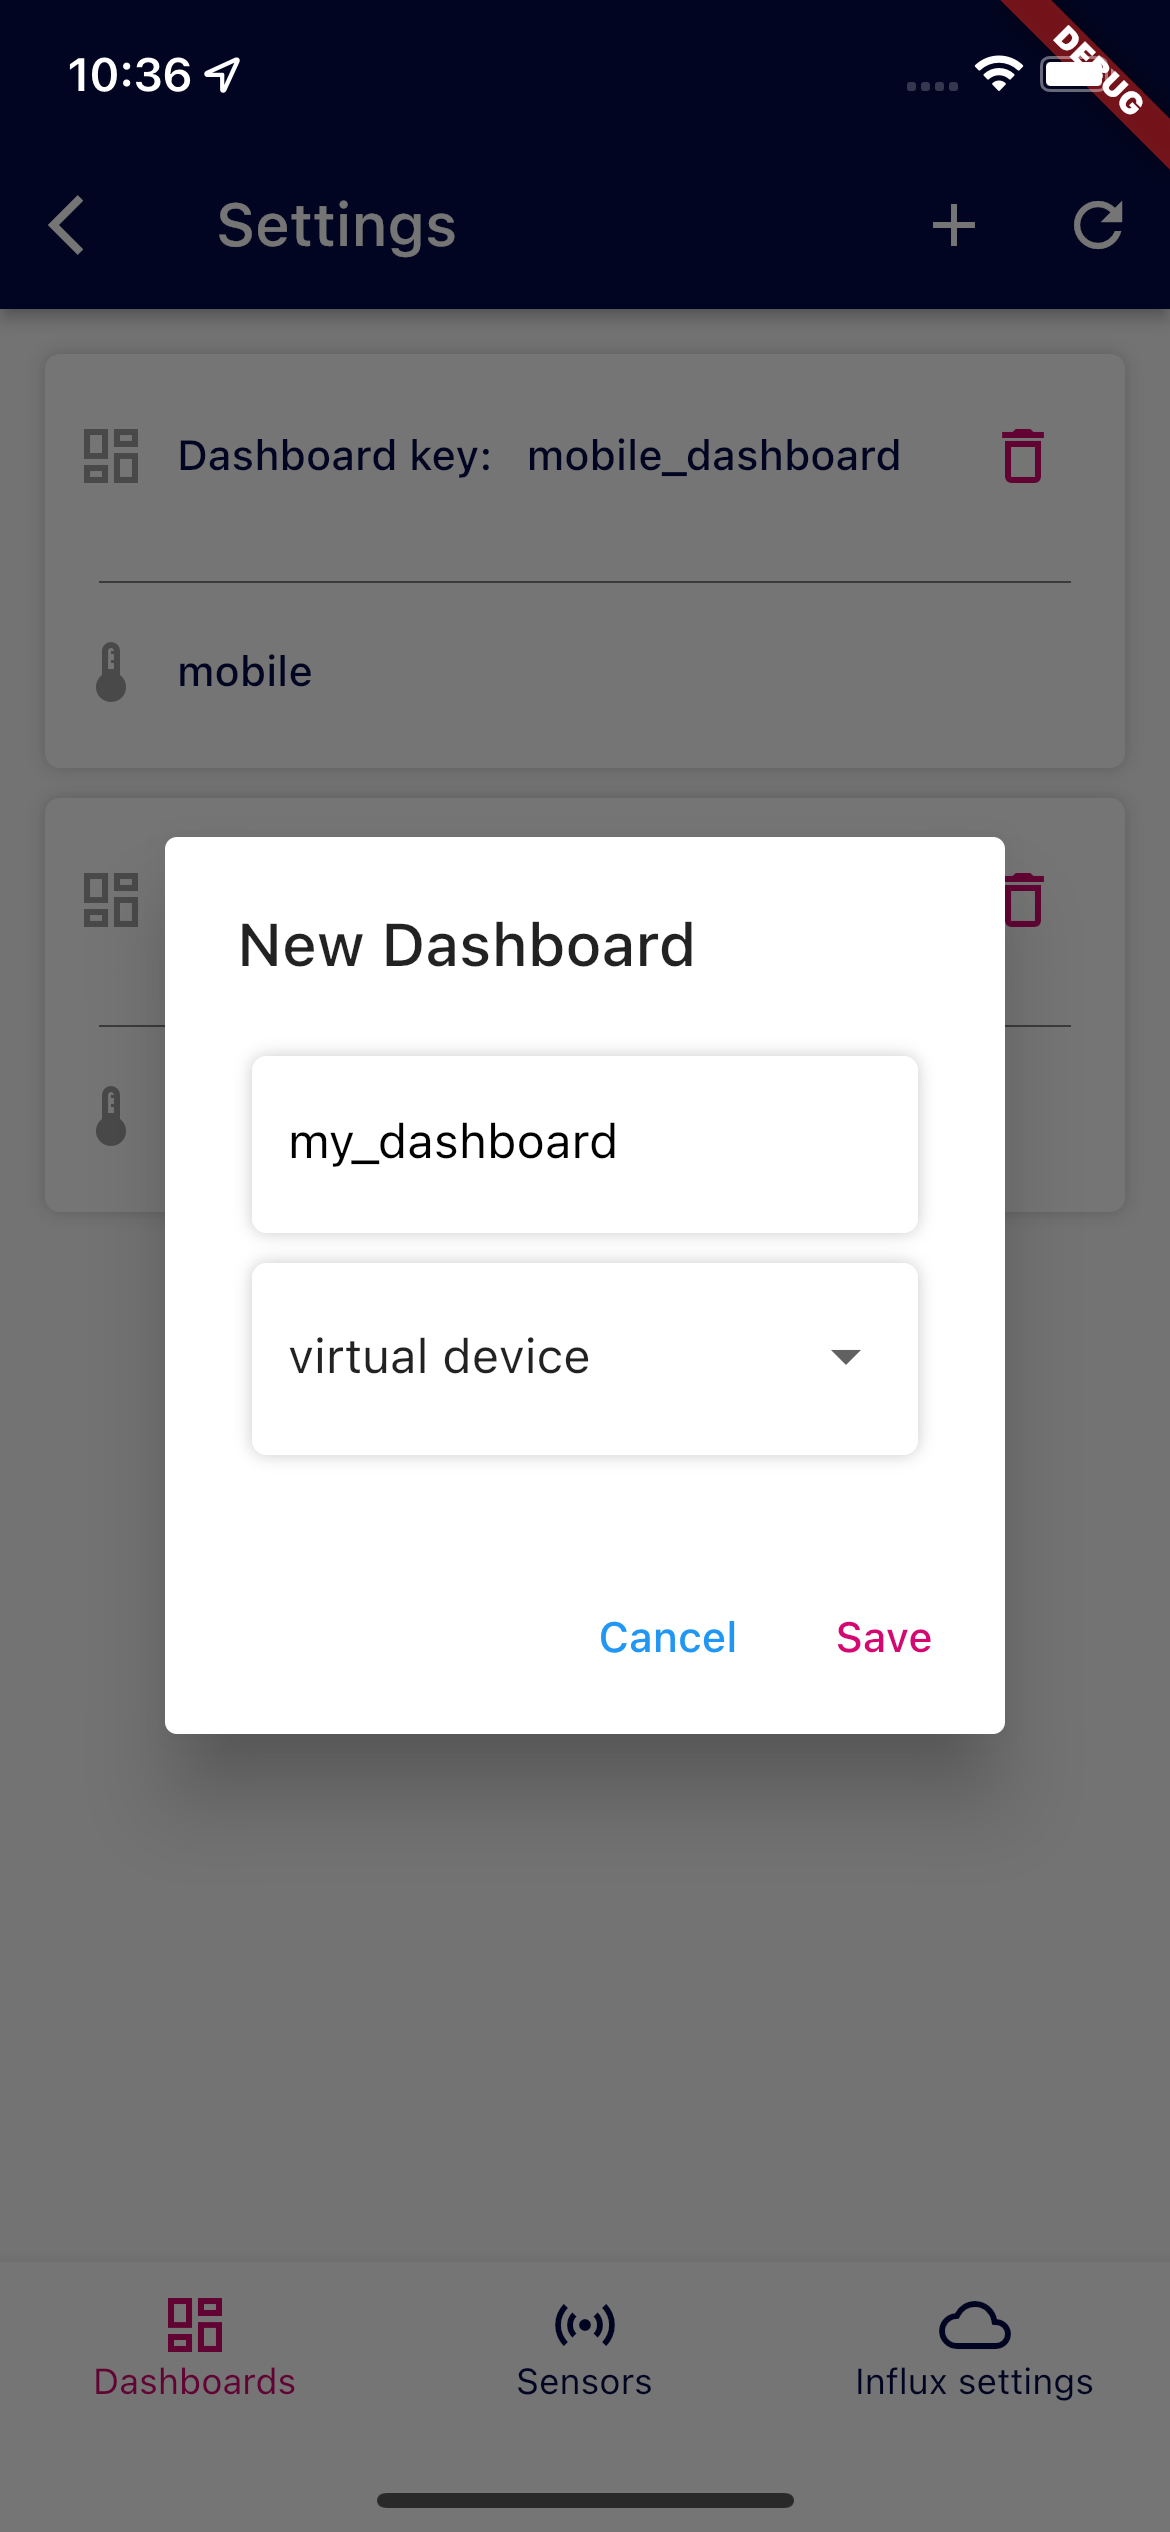
After clicking add new device button dialog is shown - to TextBox enter dashboard id, in DropDownList select
type of dashboard and click to Save for create. Dashboard is automatically registered in InfluxDB - it's write as
point via WriteService.
Example of creating dashboard point in InfluxDB - createDashboard:
var writeApi = _influxDBClient.getWriteService();
var point = Point(measurementDashboardFlutter)
        .addTag("key", key)
        .addTag("deviceType", deviceType)
        .addField("data", dashboardData);
writeApi.write(point);
On each dashboard tile is
for deleting - after clicking on it and after confirmation by
Delete in dialog, dashboard is deleted from InfluxDB
with all associations to devices via DeleteService - deleteDashboard:
var deleteApi = _influxDBClient.getDeleteService();
deleteApi.delete(
  predicate: 'dashboardKey="$dashboardKey"',
  start: DateTime(1970).toUtc(),
  stop: DateTime.now().toUtc(),
  bucket: _influxDBClient.bucket,
  org: _influxDBClient.org);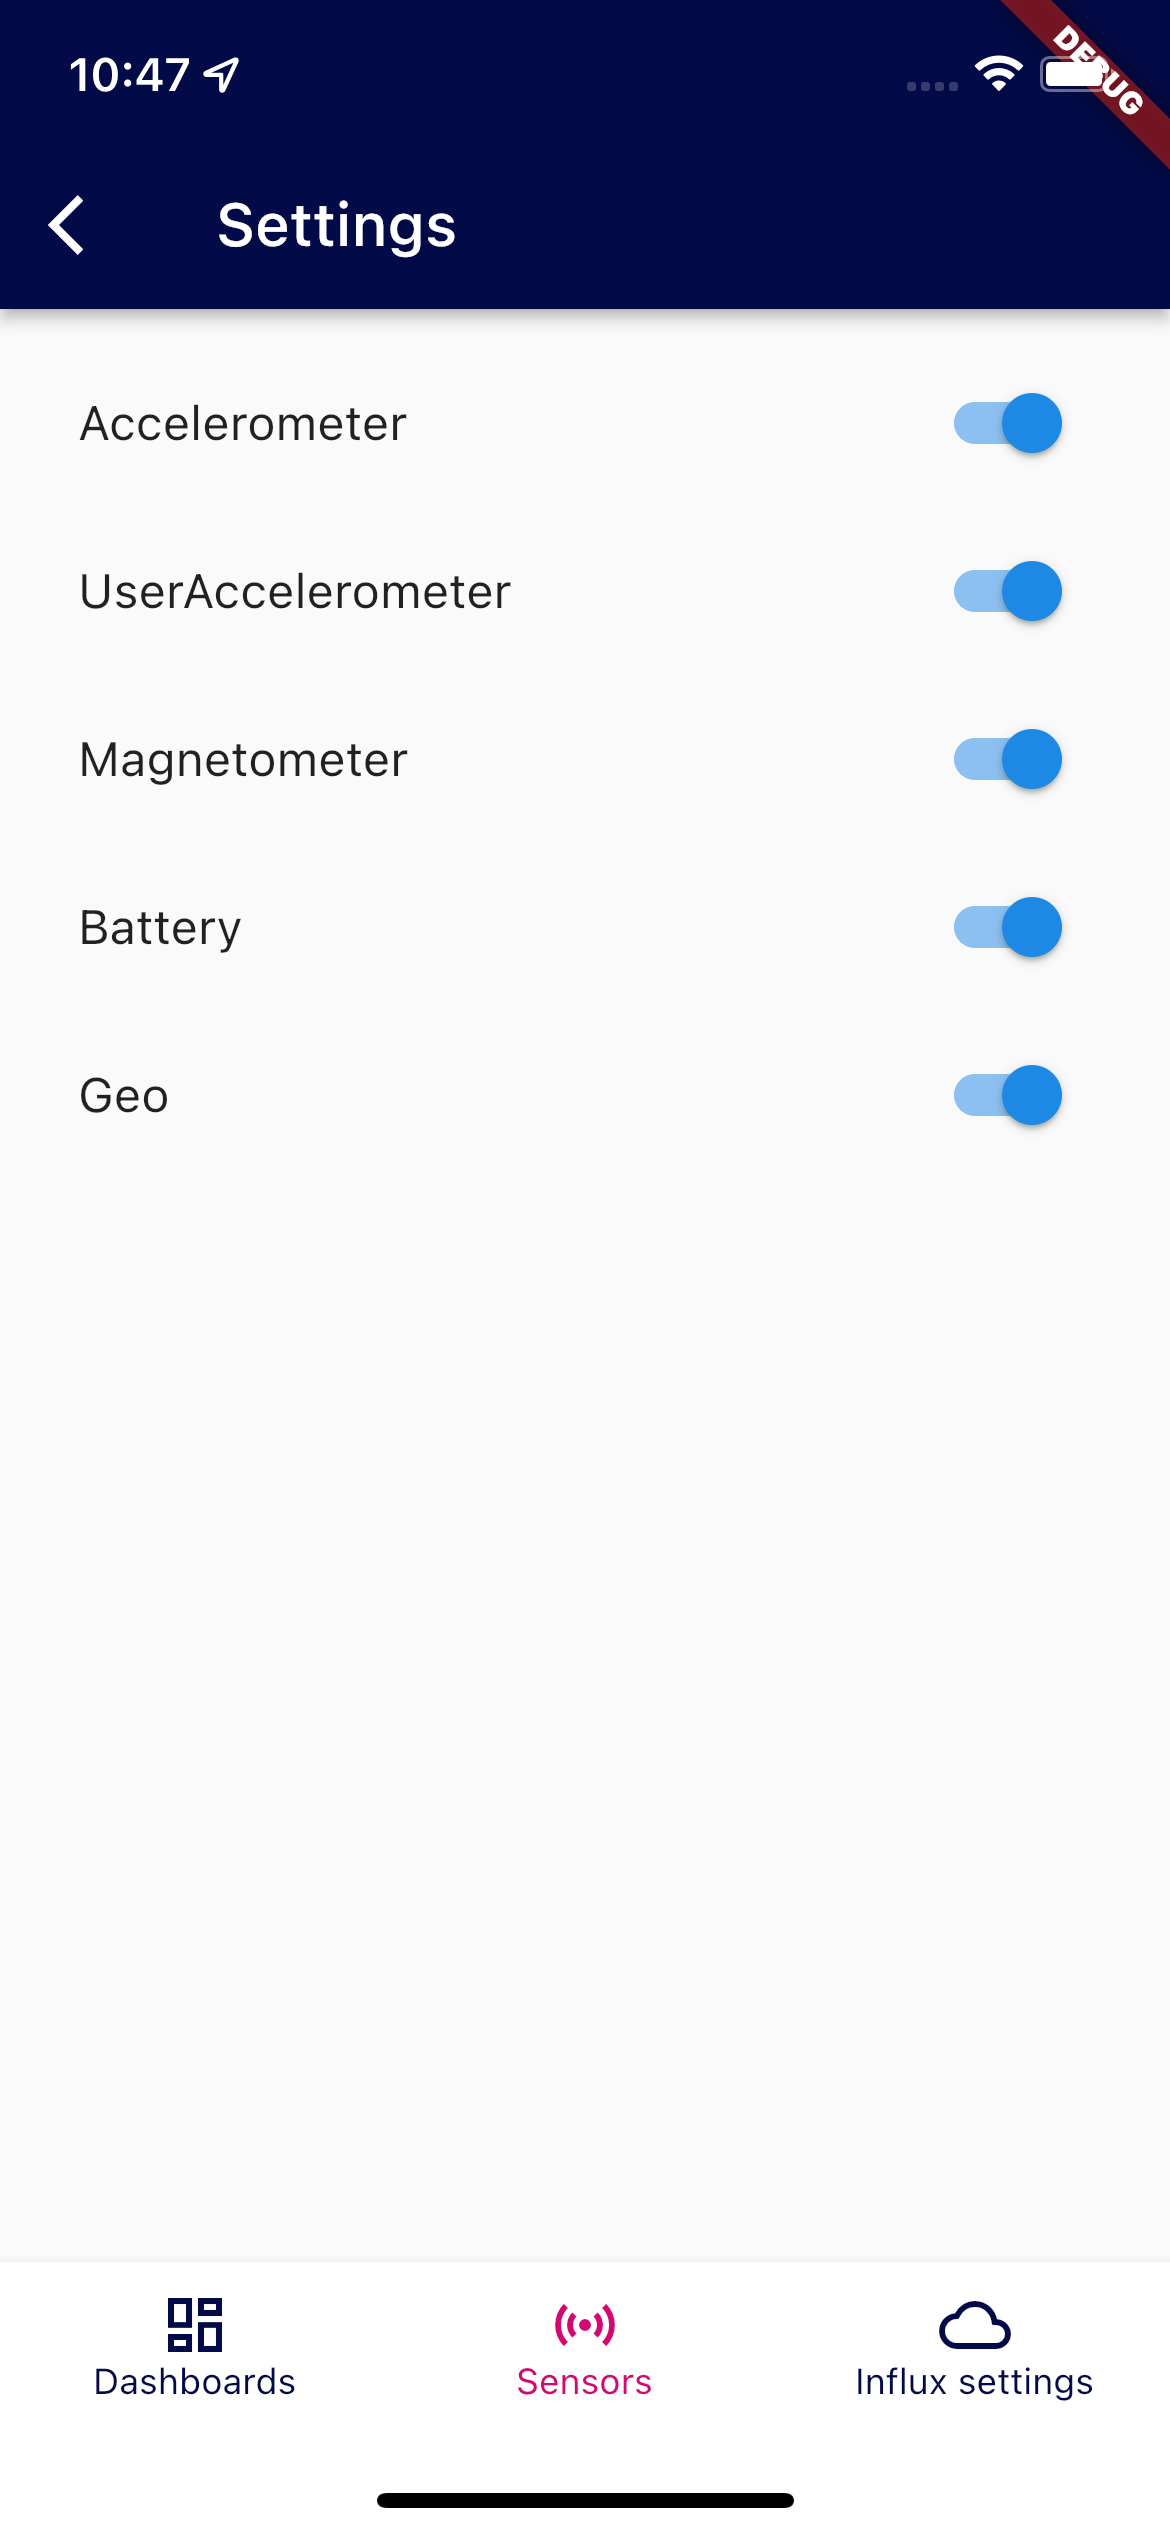
Each sensor is enabled individualy by pressing it's corresponding switch. Sensor sends all data immediately after switch is enabled. Running sensor also show current value underneath its name.
User is asked to allow permission when enables switch if needed. Sensors written in gray are not availeble.
All sensors sends data via events so we have informations when sensor values change.
Sensors are iplemented using dart/flutter libraries:
- sensors_plus
- battery_plus
- environment_sensors
- geolocator
Most of these libraries uses event's to comunicate state changes, some has only getter. Libraries with getters uses Stream.periodic to "convert" getter into events.
All sensors sends events with normalized data:
typedef SensorMeasurement = Map<String, double>;From this map we can simply create object that we can sent into influxdb:
final measurements = metrics.map((key, value) {
  final field = sensor.name + (key != "" ? "_$key" : "");
  return MapEntry(field, value);
});
some sensors sends only one value so it's map has only "" key
Now we have everything we need for inflxudb write.
var writeApi = _influxDBClient.getWriteService();
final point = Point("environment");
point.addTag("clientId", clientID)
  .addTag("device", device)
  .time(DateTime.now().toUtc());
for (var m in measurements.entries) {
  point.addField(m.key, m.value);
}
writeApi.write(point);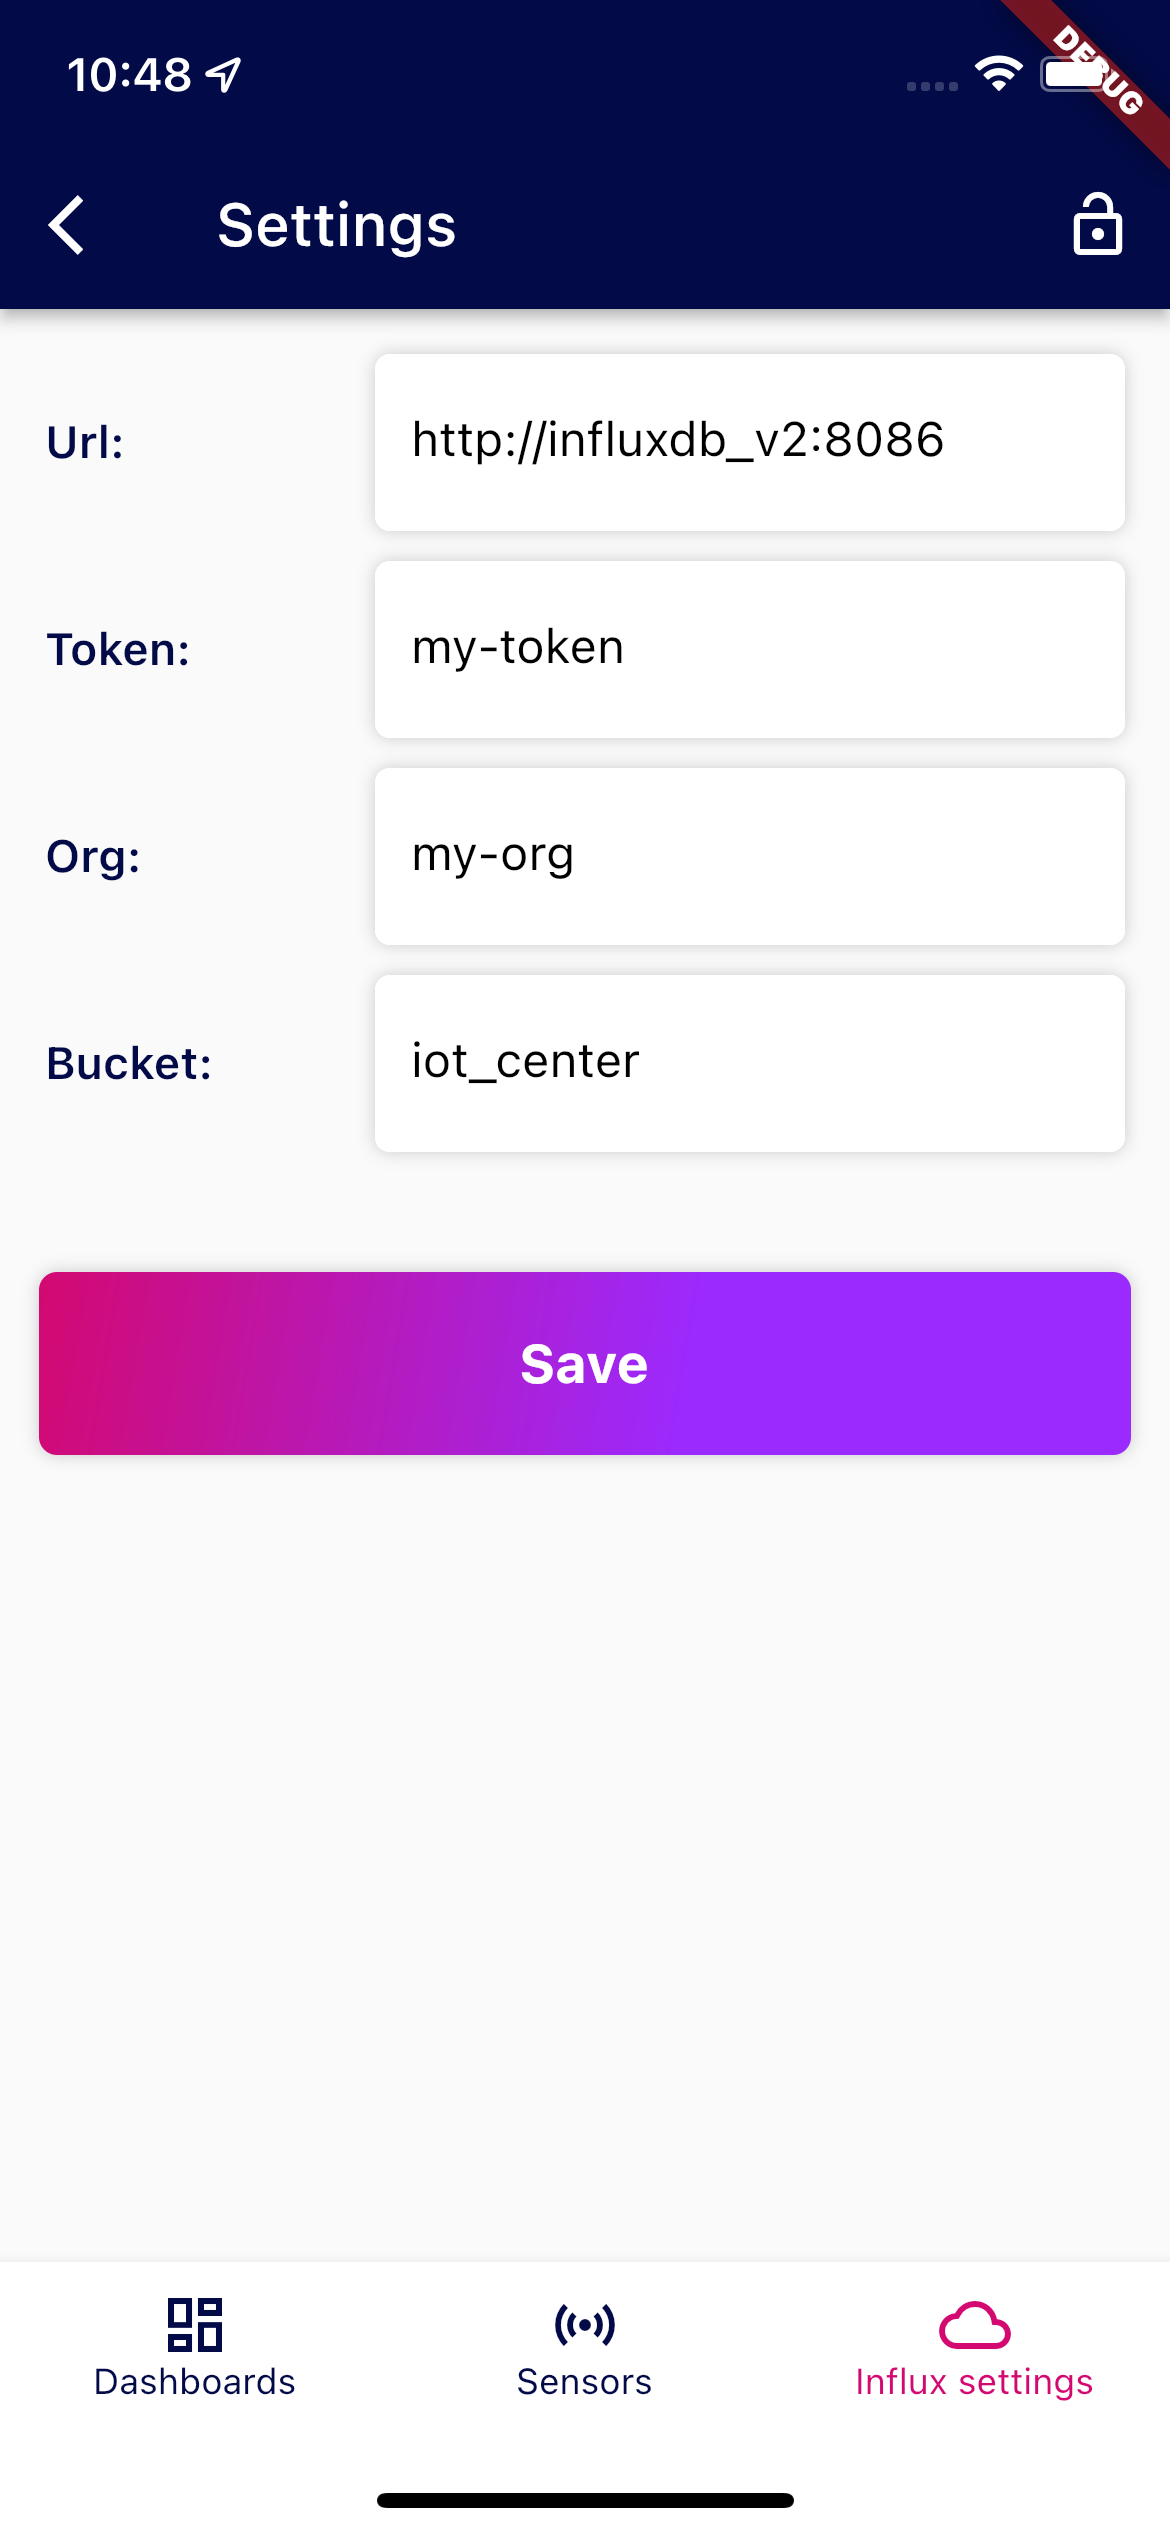
This tab stored credentials for InfluxDB connection. Those credentials are saved locally in SharedPreferences.
App bar on this tab has this functions:
Loading is in method loadInfluxClient:
var prefs = await SharedPreferences.getInstance();
if (prefs.containsKey("influxClient")) {
  _fromJson(json.decode(prefs.getString("influxClient")!));
}
Save credentials is allowed only in editable mode. Method for save is saveInfluxClient:
SharedPreferences prefs = await SharedPreferences.getInstance();
prefs.setString("influxClient", jsonEncode(this));
Dashboard tab contains chart ListView - it's scrollable and contains two different types of charts - gauge and simple.
Both charts use QueryService to get data - fetchDeviceDataField
- Gauge chart display average of all values in selected time range
import "influxdata/influxdb/v1"
    from(bucket: "${_client.bucket}")
        |> range(start: $maxPastTime)
        |> filter(fn: (r) => r.clientId == "${_config.id}"
                    and r._measurement == "environment"
                    and r["_field"] == "$field")
|> mean()- Simple chart display average data for aggregate window
import "influxdata/influxdb/v1"
    from(bucket: "${_client.bucket}")
        |> range(start: $maxPastTime)
        |> filter(fn: (r) => r.clientId == "${_config.id}"
                    and r._measurement == "environment"
                    and r["_field"] == "$field")
        |> keep(columns: ["_value", "_time"])
        |> aggregateWindow(column: "_value", every: $aggregate, fn: mean)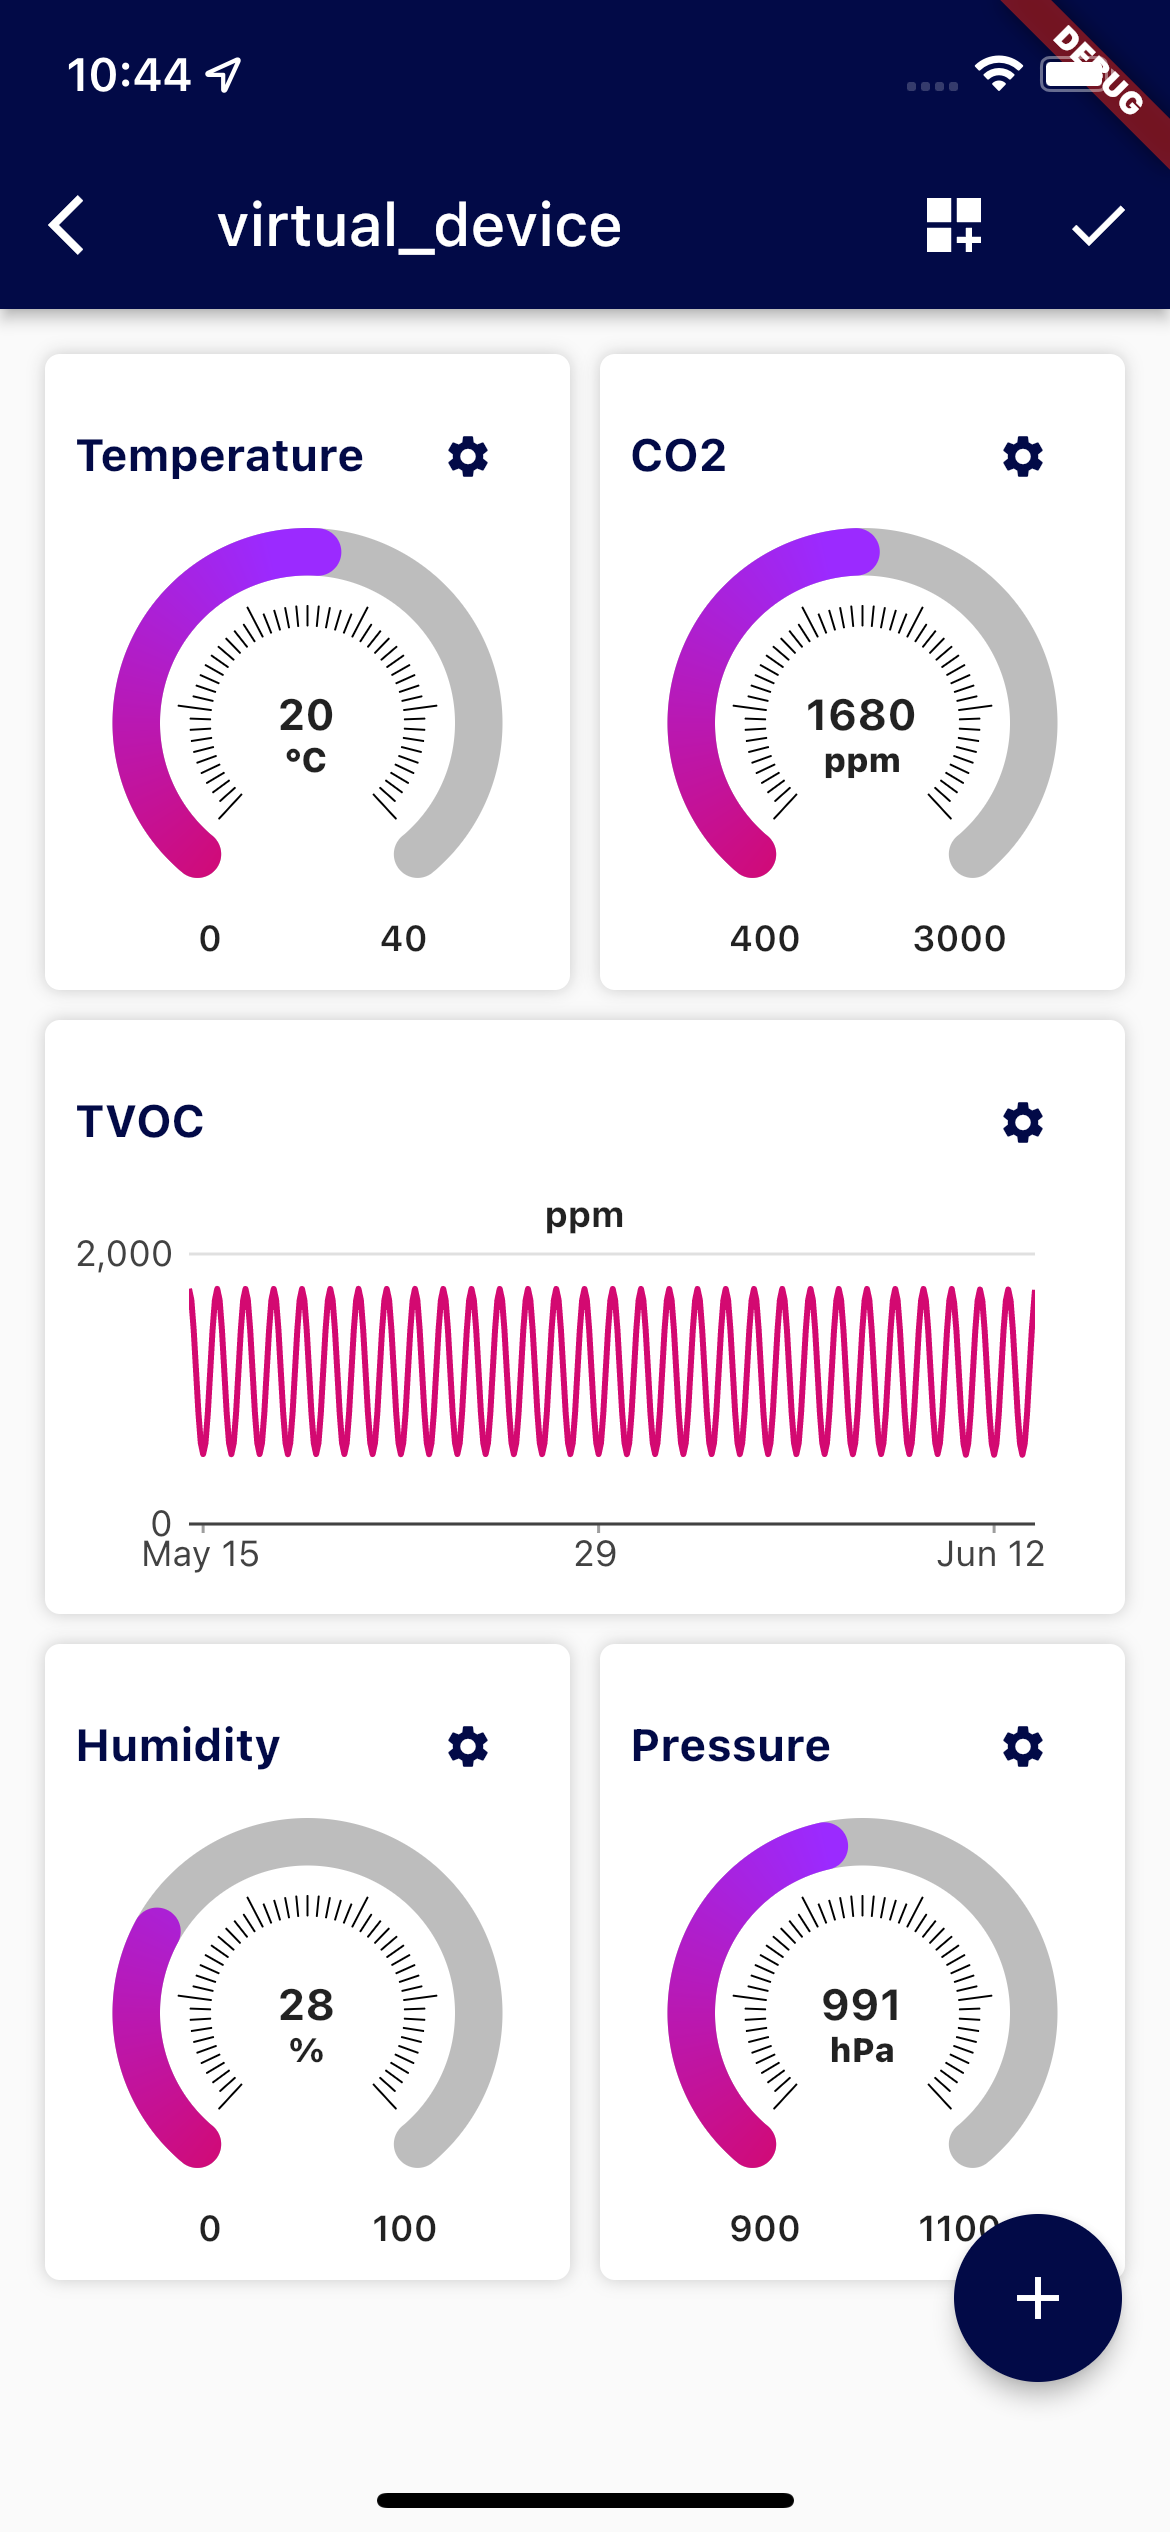
App bar on this tab (in non-editable mode) contains:
- "-1h"
TextButtonwith selected time range refresh charts
turn on editable mode - display/hide buttons for editing on chart tiles and
FloatingActionButtonbutton for add new chart.
App bar on this tab (in editable mode) contains:
Button 'change dashboard' open dialog with DropDownMenu - for getting dashboards is use QueryService, where are
dashboards filtered by device type - fetchDashboardsByType:
from(bucket: "${_influxDBClient.bucket}")
    |> range(start: -30d)
    |> filter(fn: (r) => r["_measurement"] == "$measurementDashboardFlutter")
    |> filter(fn: (r) => r["deviceType"] == "$deviceType")
    |> last()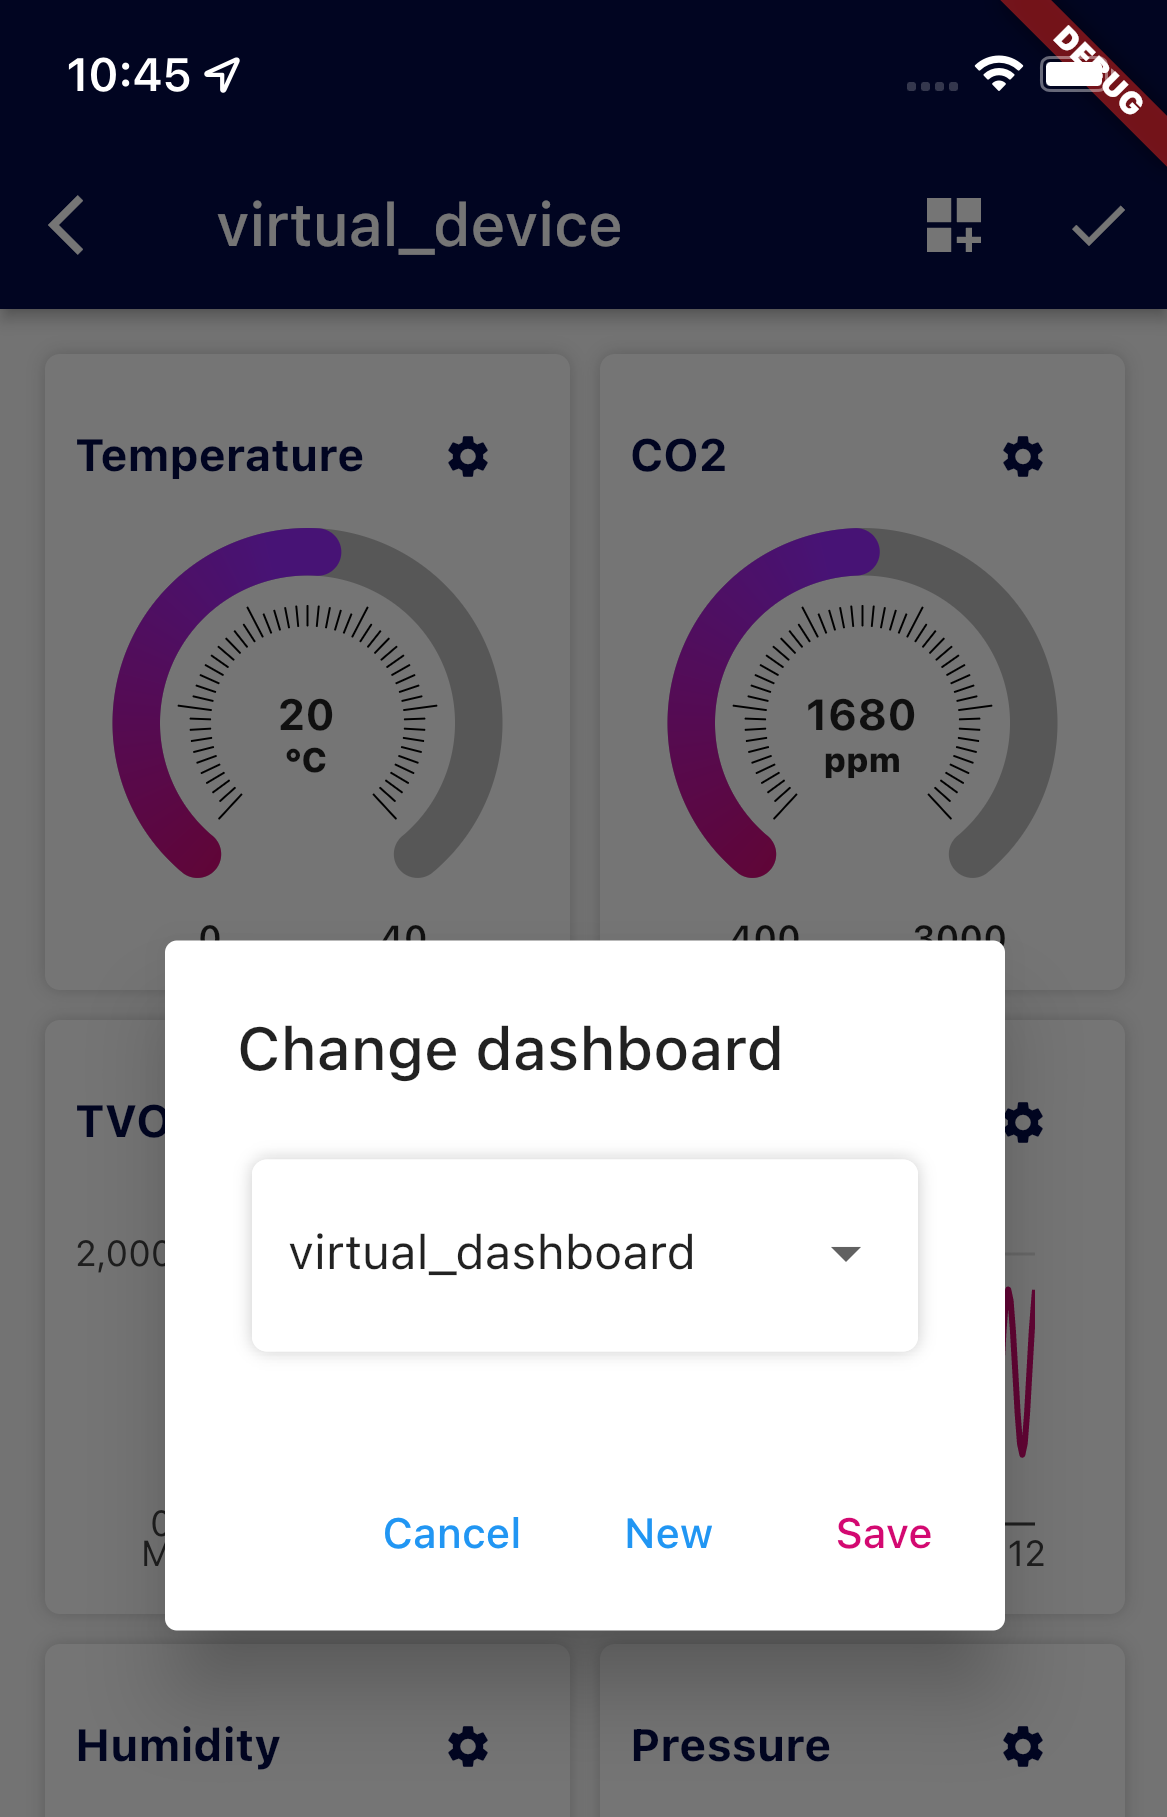
After selecting dashboard and clicking 'Save' is dashboard associated to device. New point is created and write to
InfluxDB by WriteService - pairDeviceDashboard:
var writeApi = _influxDBClient.getWriteService();
var point = Point('deviceauth')
        .addTag('deviceId', deviceId)
        .addField('dashboardKey', dashboardKey);
        .addTag('dashboardKey', dashboardKey);
writeApi.write(point);
With InfluxDB 2.2, delete predicates can use any column or tag except _time, _field,or _value, so because of future possibility of deleting point is also added tag 'dashboardKey'.
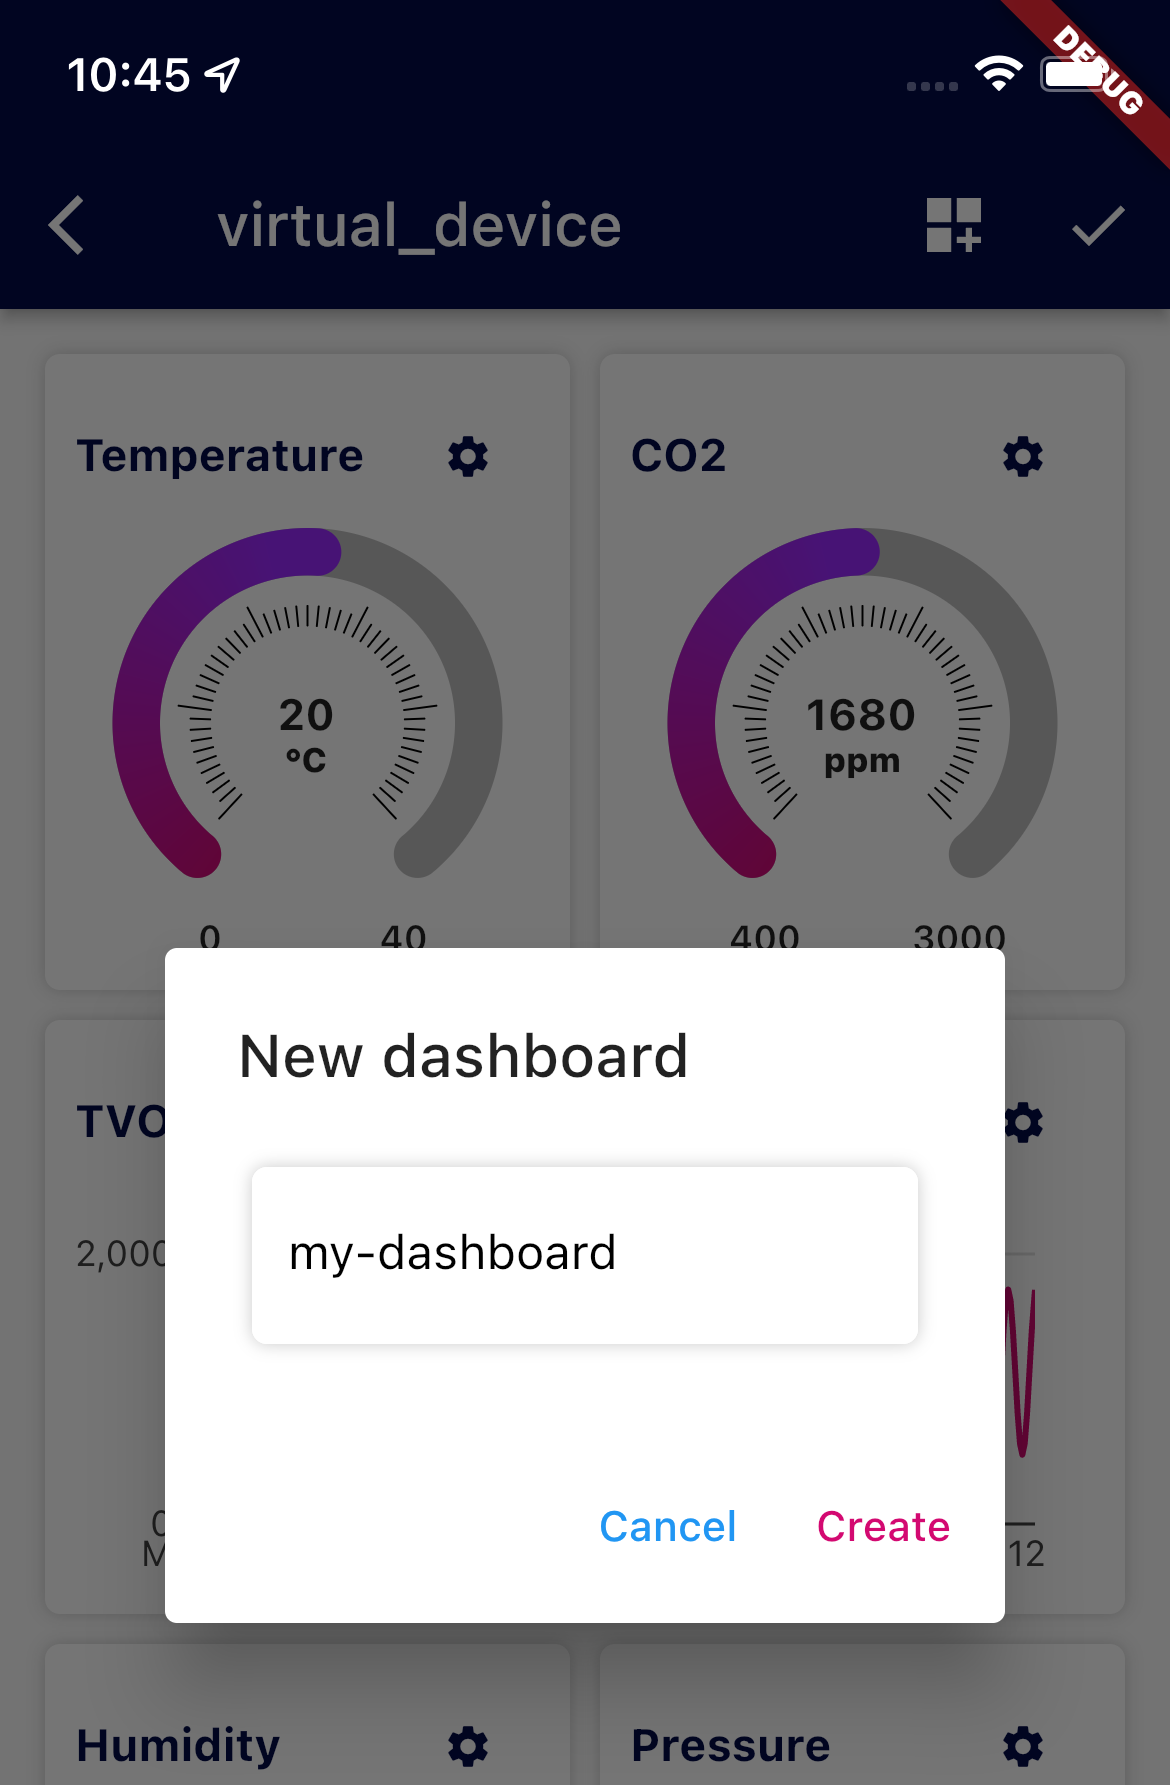
In 'change dashboard' dialog new dashboard can be created - after clicking 'New' is open another dialog with TextBox
for DashboardKey. The type of dashboard created in Device Detail page is the same as current device. Empty dashboard is saved to
InfluxDB by WriteService - createDashboard:
var writeApi = _influxDBClient.getWriteService();
var point = Point(measurementDashboardFlutter)
        .addTag("key", key)
        .addTag("deviceType", deviceType)
        .addField("data", dashboardData);
writeApi.write(point);
After creating new dashboard, dialog for changing dashboard is showing again and in DropDownList is preselected
newly created dashboard. Association to device is created after clicking 'Save'.
Each dashboard can be customized (in editable mode):
- adding new charts - by clicking on
FloatingActionButtonis 'New Chart Page' open - editing charts - on each chart tile is
button, which open 'Edit Chart Page'
- delete chart - chart can be deleted on 'Edit Chart Page'
Changes on dashboard are saved to InfluxDB after clicking
button and editable mode is turned off.
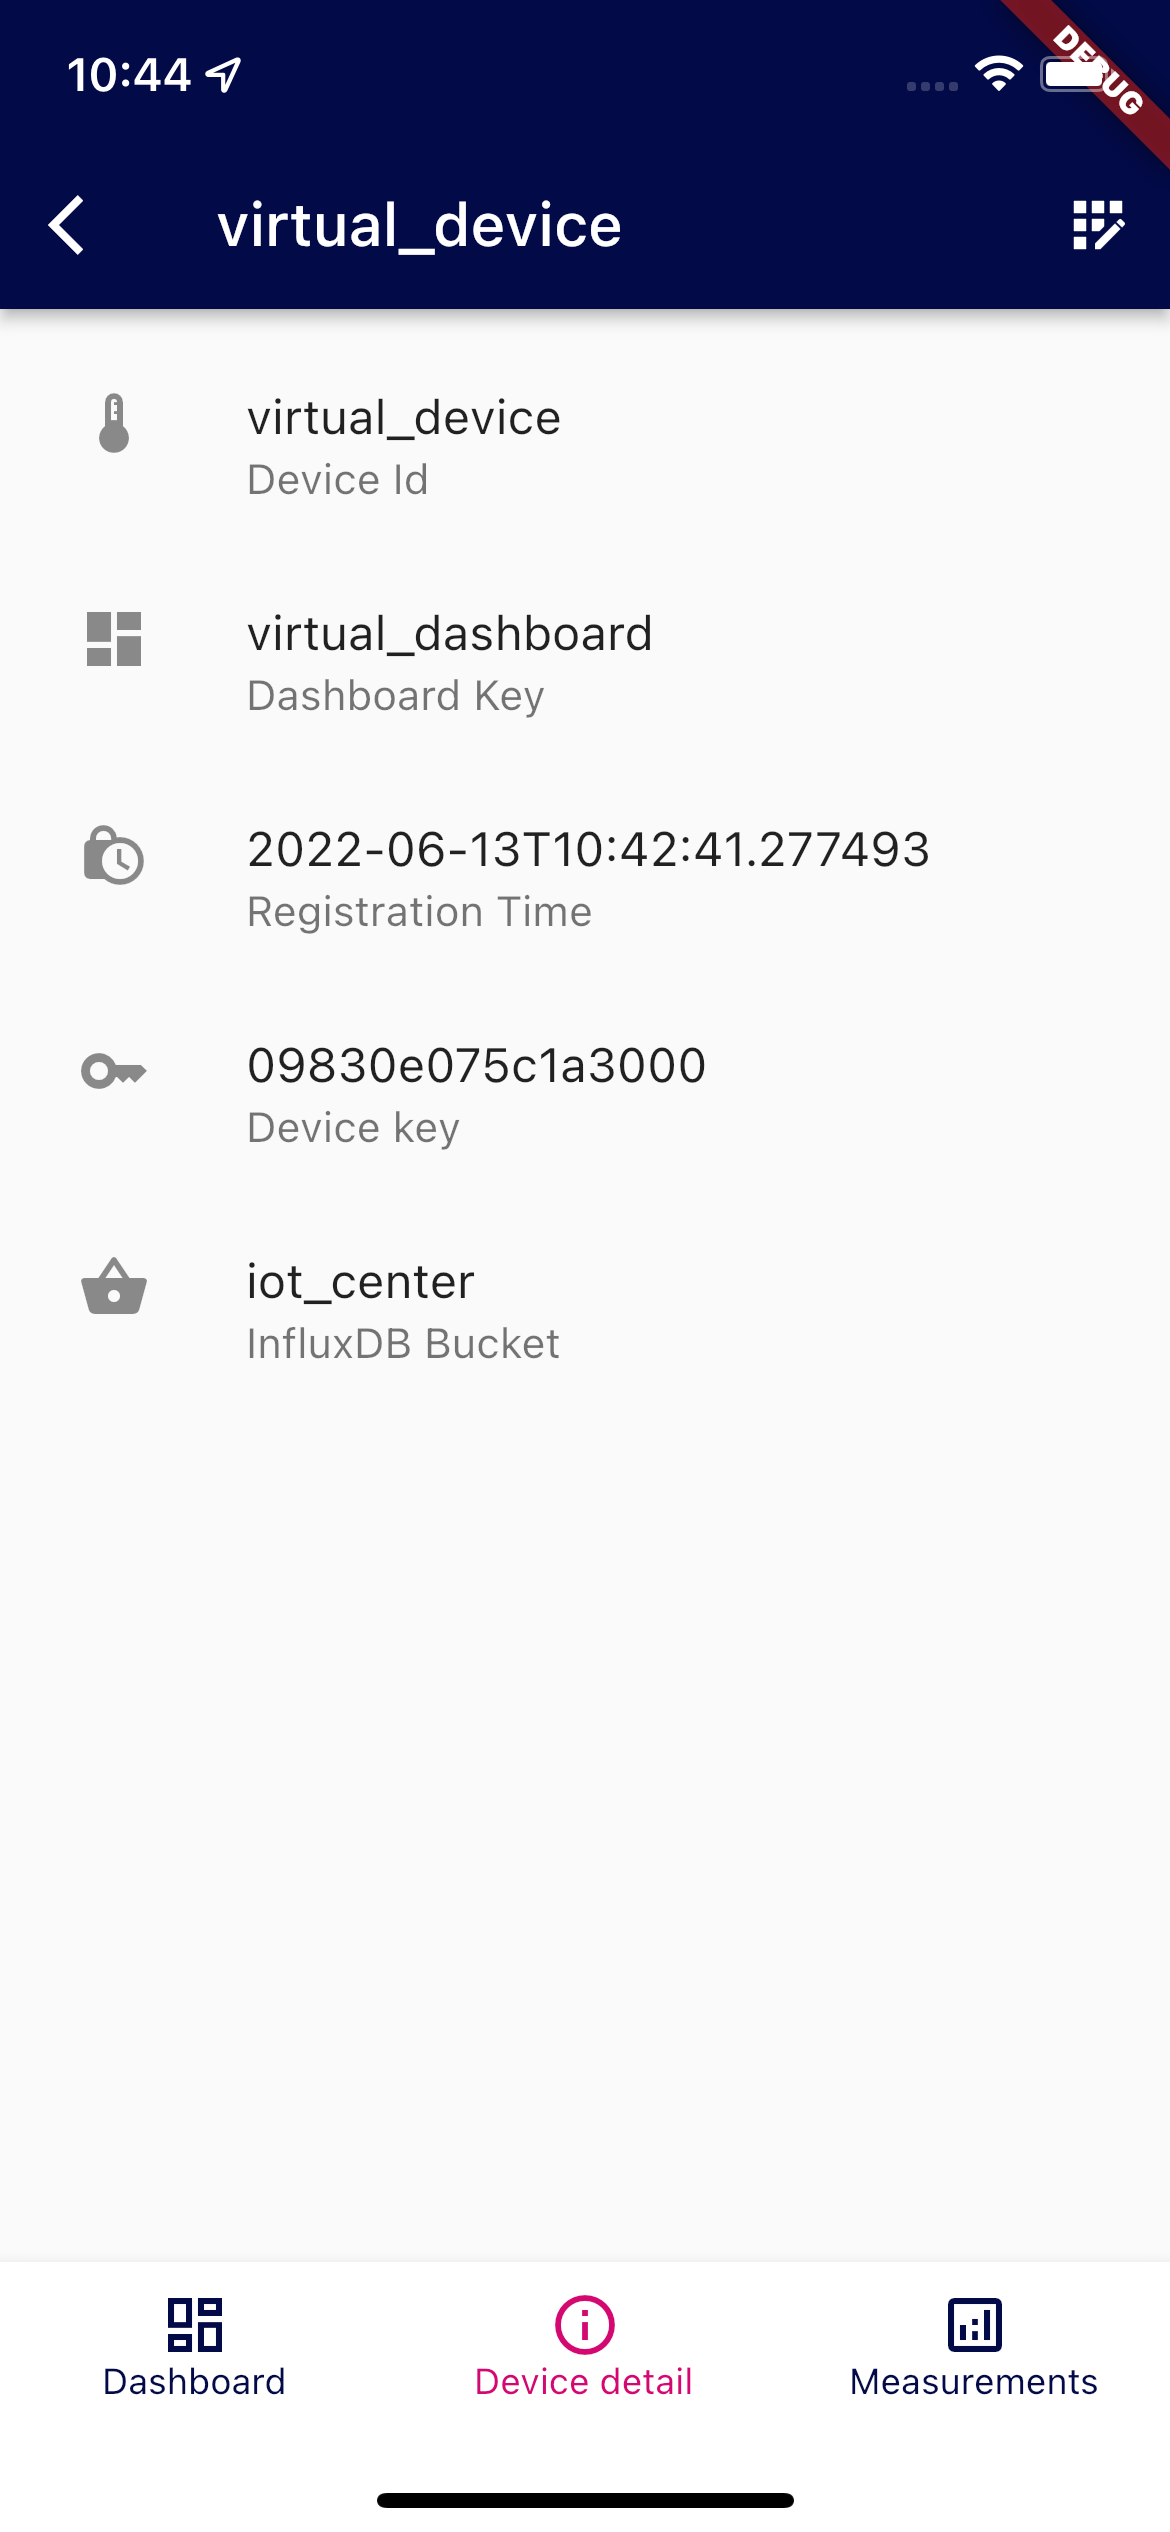
This page contains basic device information. For getting them is use method fetchDeviceWithDashboard - this method has two parts:
- get device info by
QueryService- fetchDevice
from(bucket: "${_influxDBClient.bucket}")
    |> range(start: -30d)
    |> filter(fn: (r) => r["_measurement"] == "deviceauth"
                     and r.deviceId == "$deviceId")
|> last()- get dashboard by
QueryService- fetchDashboard
from(bucket: "${_influxDBClient.bucket}")
    |> range(start: 0)
    |> filter(fn: (r) => r._measurement == "$measurementDashboardFlutter")
    |> filter(fn: (r) => r.key == "$dashboardKey")
    |> filter(fn: (r) => r._field == "data")
    |> last()
App bar on this tab has this functions:
write emulated data to InfluxDB by
WriteService- writeEmulatedData:
while (lastTime < toTime) {
  lastTime += 60000;
  var point = Point('environment');
  point
    .addTag('clientId', deviceId)
    .addField('Temperature', _generate(period: 30, min: 0, max: 40, time: lastTime))
    .addField('Humidity', _generate(period: 90, min: 0, max: 99, time: lastTime))
    .addField('Pressure', _generate(period: 20, min: 970, max: 1050, time: lastTime))
    .addField('CO2', _generate(period: 1, min: 400, max: 3000, time: lastTime).toInt())
    .addField('TVOC', _generate(period: 1, min: 250, max: 2000, time: lastTime).toInt())
    .addTag('TemperatureSensor', 'virtual_TemperatureSensor')
    .addTag('HumiditySensor', 'virtual_HumiditySensor')
    .addTag('PressureSensor', 'virtual_PressureSensor')
    .addTag('CO2Sensor', 'virtual_CO2Sensor')
    .addTag('TVOCSensor', 'virtual_TVOCSensor')
    .addTag('GPSSensor', 'virtual_GPSSensor')
    .time(lastTime);
  writeApi.batchWrite(point);
}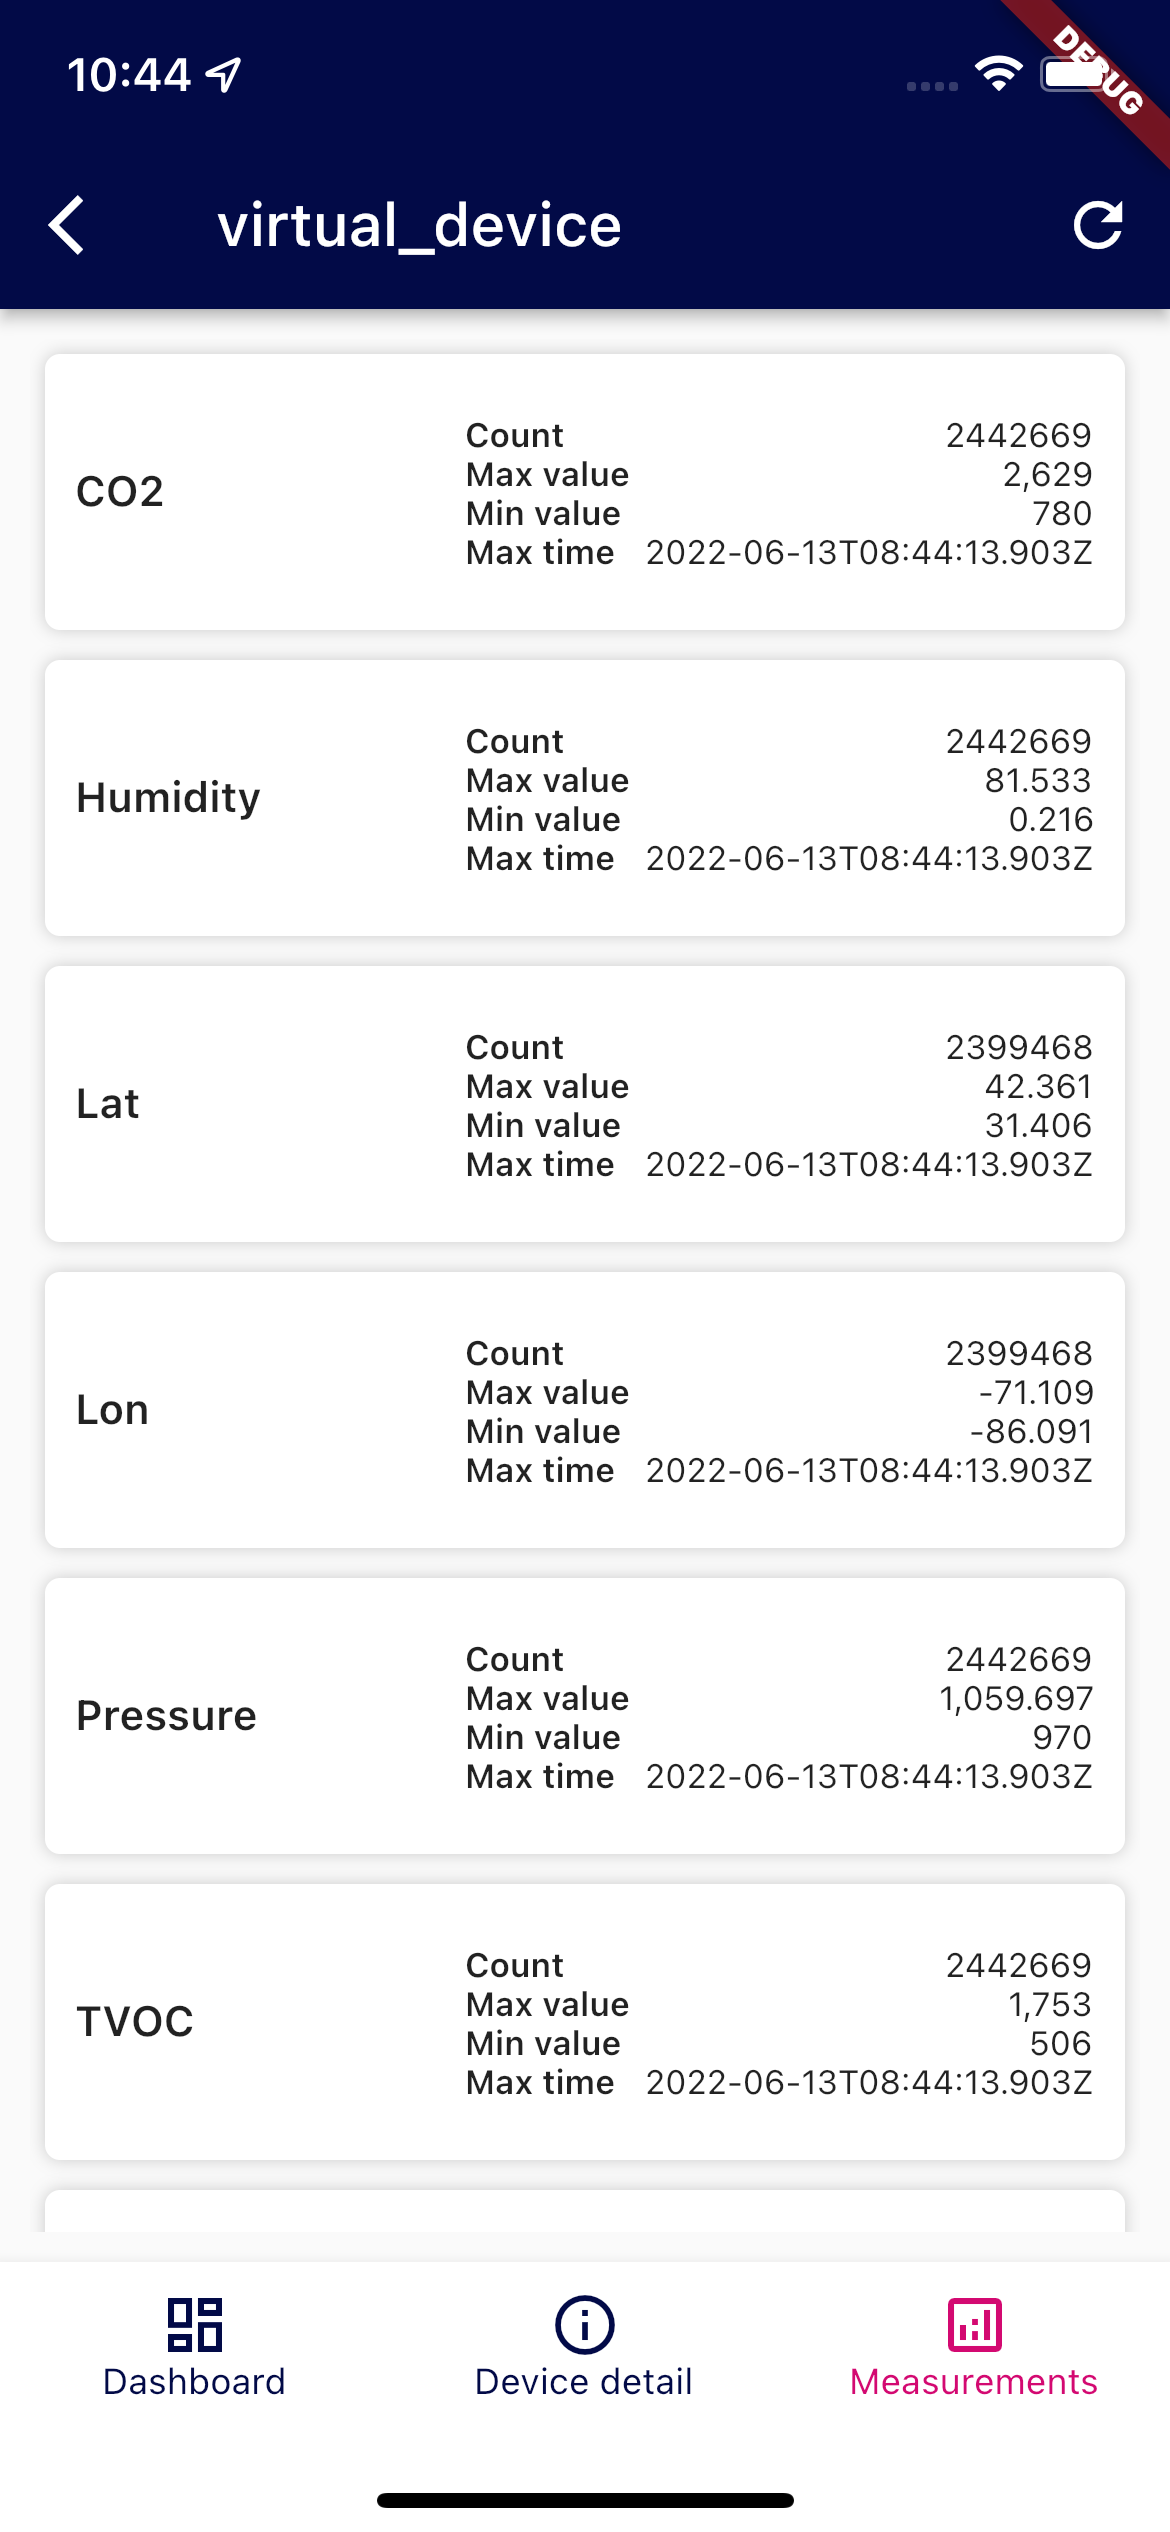
Measurements tab contains ListView of basic metrics for each field of selected Device for last 30 days. It's use following
QueryService - fetchMeasurements:
deviceData = from(bucket: "${_influxDBClient.bucket}")
    |> range(start: -30d)
    |> filter(fn: (r) => r._measurement == "environment"
            and r.clientId == "$deviceId")
measurements = deviceData
    |> keep(columns: ["_field", "_value", "_time"])
    |> group(columns: ["_field"])
counts  =   measurements |> count()
                         |> keep(columns: ["_field", "_value"])
                         |> rename(columns: {_value: "count"   })
maxValues = measurements |> max  ()
                         |> toFloat()
                         |> keep(columns: ["_field", "_value"])
                         |> rename(columns: {_value: "maxValue"})
minValues = measurements |> min  ()
                         |> toFloat()
                         |> keep(columns: ["_field", "_value"])
                         |> rename(columns: {_value: "minValue"})
maxTimes  = measurements |> max  (column: "_time")
                         |> keep(columns: ["_field", "_time" ])
                         |> rename(columns: {_time : "maxTime" })

j = (tables=<-, t) => join(tables: {tables, t}, on:["_field"])

counts |> j(t: maxValues)
       |> j(t: minValues)
       |> j(t: maxTimes)
       |> yield(name: "measurements")
App bar on this tab contains:
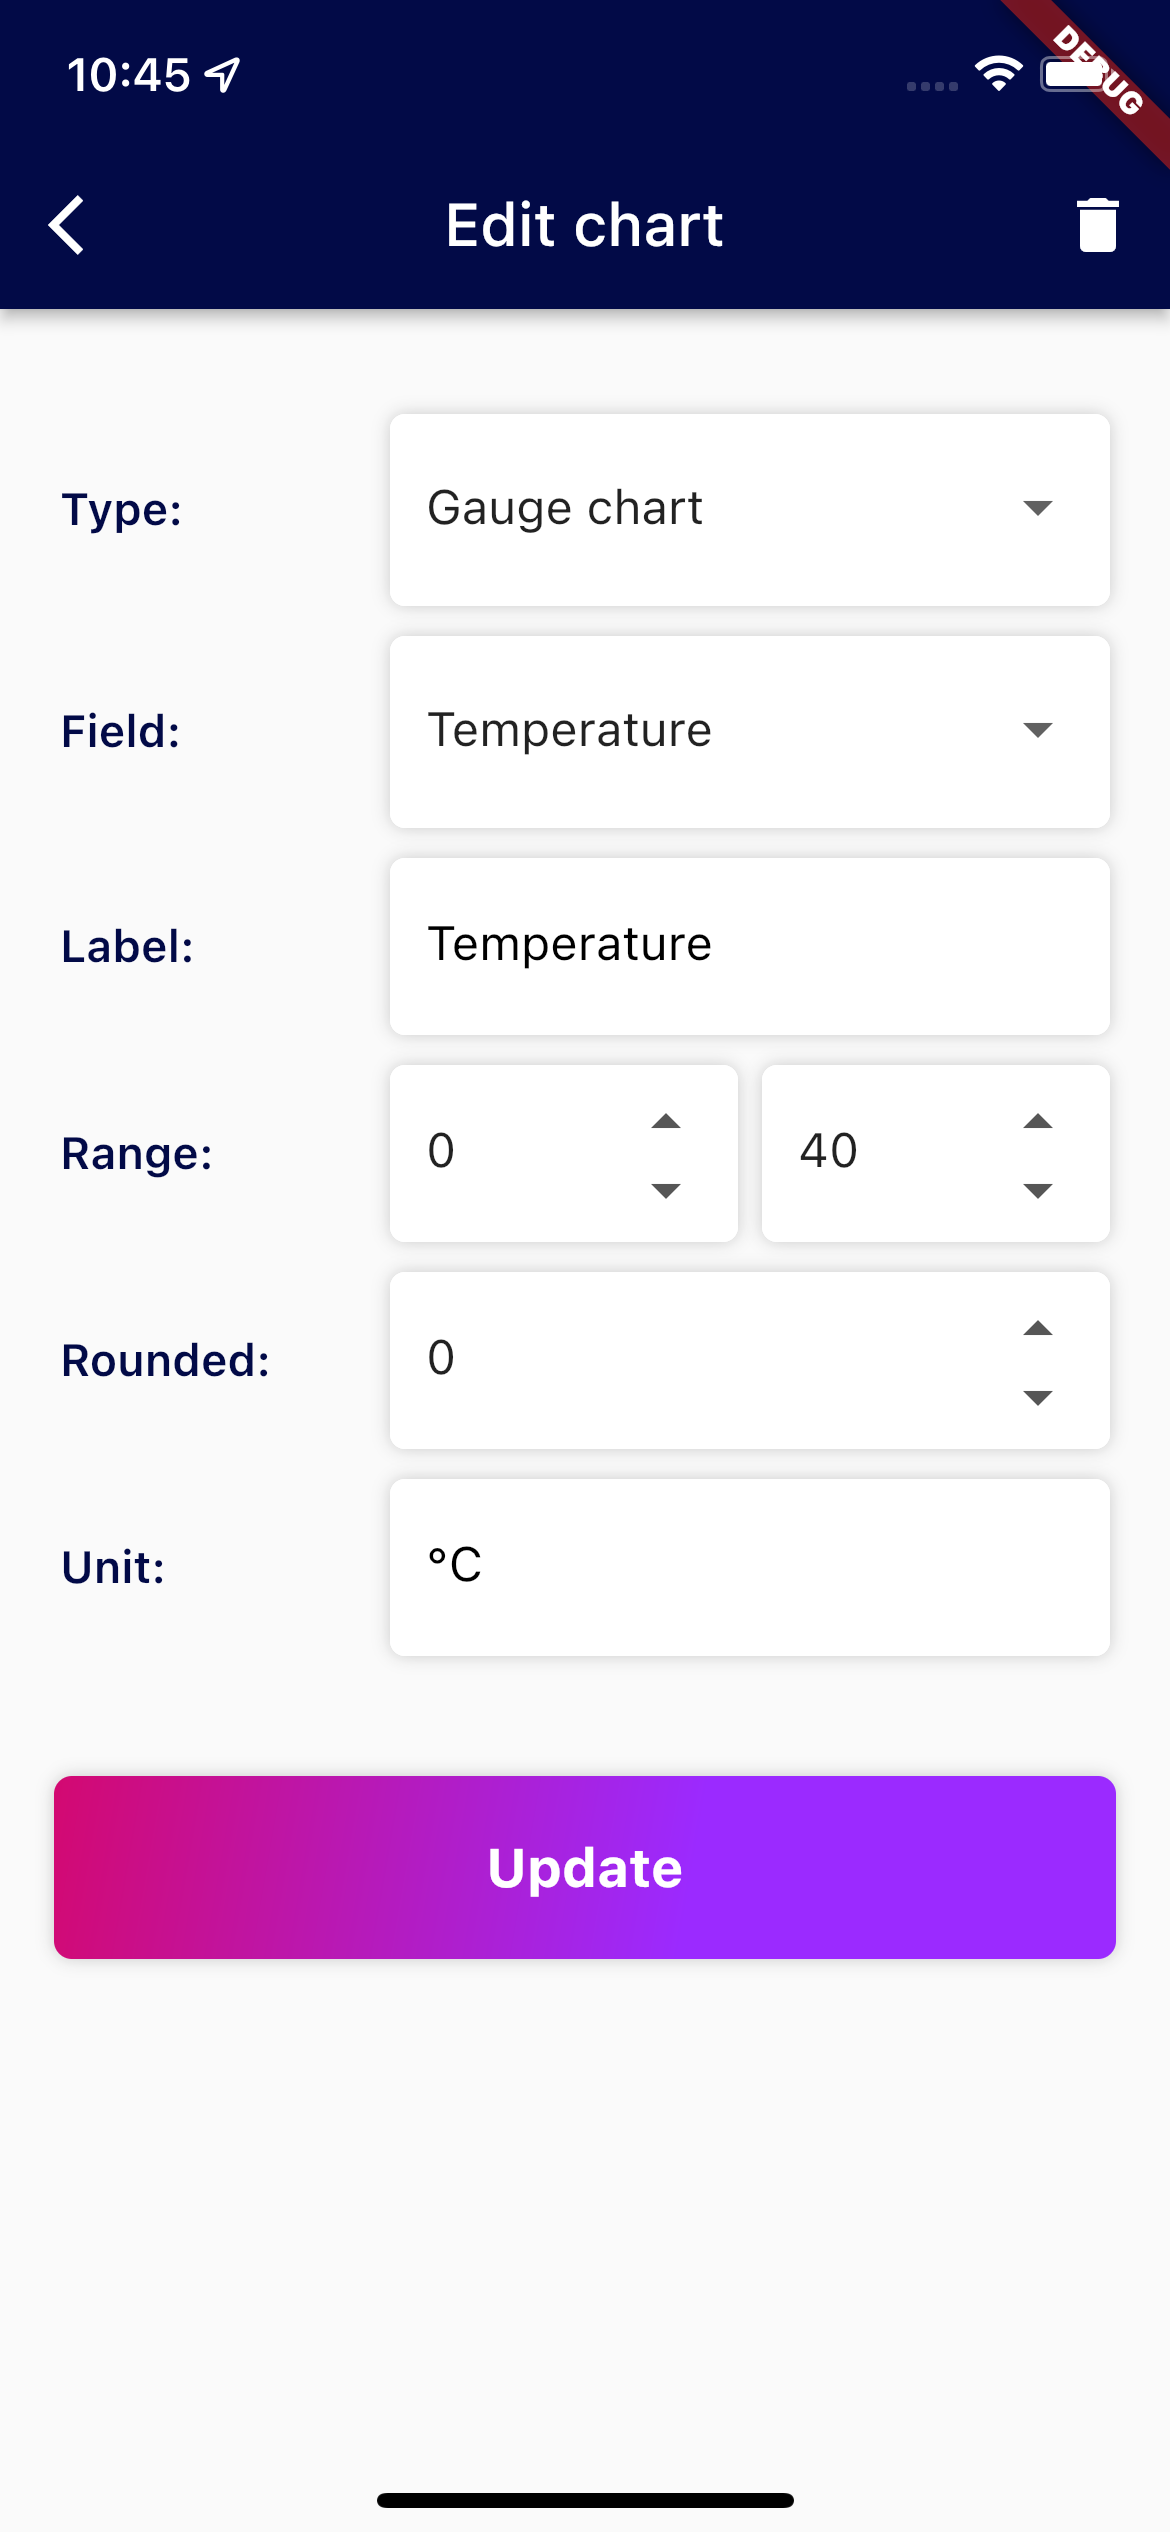
Each chart in Charts ListView contains
button (after unlock editing in AppBar) at
Device Detail Page in tab Dashboard. By clicking it, Edit Chart page is displayed.
New chart page is showed after clicking
floatingActionButton on Device Detail Page in tab Dashboard.
On Edit chart page, chart can be deleted by clicking on
in AppBar and after confirmation dialog.
DropDown list Field: gets values from InfluxDB by QueryService - fetchFieldNames:
import "influxdata/influxdb/schema"
    schema.fieldKeys(
        bucket: "${_client.bucket}",
        predicate: (r) => r["_measurement"] == "environment"
                      and r["clientId"] == "${_config.id}")
After updating/creating chart are data automatically refreshed (only for updated/created chart, other charts aren't affected).