In the previous lesson, you learned about the formula of the
You will be able to:
- Calculate and interpret the z-score (standard score) for an observation from normally distributed data
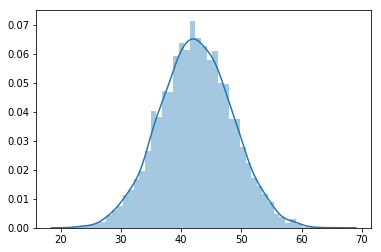
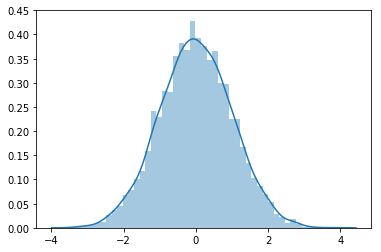
- Visualize data before and after standardization to visually inspect the results
A
$z$ -score can help identify how many standard deviations above or below the mean a certain observation is. Every time you obtain a$z$ -score, use “above” or “below” in your phrasing.
The yields of apple trees in an orchard have been recorded in the file yield.csv. Each observation is recorded by weighing apples from trees (in pounds) and adding their weights. There are 5000 observations in total for this data.
Use pandas for loading and inspecting the data.
# Import libraries

# Read the yield data as a dataframe.dataframe tbody tr th {
vertical-align: top;
}
.dataframe thead th {
text-align: right;
}
| 0 | |
|---|---|
| 0 | 39.741234 |
| 1 | 39.872055 |
| 2 | 44.331164 |
| 3 | 46.600623 |
| 4 | 40.694984 |
# Create a plot# Your comments about the data here# Your answer hereHint: Recall the empirical rule related to
$3\sigma$ .
# Perform any calculations necessary here# Write your answer here # Calculate z# Interpret the result# Interpret the z score# Calculate yield# What is the yield ?The units are still the apple trees. For the data set of all z-scores:
- What is the shape?
- The mean?
- The standard deviation?
# Give your solution here Mean: 0.0
SD: 1.0
# Your observationsIn this lab, you practiced your knowledge of the standard normal distribution!

