In this lab, you'll be able to validate your Boston Housing data model using train-test split.
You will be able to:
- Compare training and testing errors to determine if model is over or underfitting
This time, let's only include the variables that were previously selected using recursive feature elimination. We included the code to preprocess below.
import pandas as pd
import numpy as np
import matplotlib.pyplot as plt
%matplotlib inline
from sklearn.datasets import load_boston

boston = load_boston()

boston_features = pd.DataFrame(boston.data, columns = boston.feature_names)
b = boston_features['B']
logdis = np.log(boston_features['DIS'])
loglstat = np.log(boston_features['LSTAT'])

# Min-Max scaling
boston_features['B'] = (b-min(b))/(max(b)-min(b))
boston_features['DIS'] = (logdis-min(logdis))/(max(logdis)-min(logdis))

# Standardization
boston_features['LSTAT'] = (loglstat-np.mean(loglstat))/np.sqrt(np.var(loglstat))
X = boston_features[['CHAS', 'RM', 'DIS', 'B', 'LSTAT']]
y = pd.DataFrame(boston.target, columns = ['target'])# Split the data into training and test sets. Use the default split size# Importing and initialize the linear regression model class# Fit the model to train data# Calculate predictions on training and test sets# Calculate residualsA good way to compare overall performance is to compare the mean squarred error for the predicted values on the training and test sets.
# Import mean_squared_error from sklearn.metrics# Calculate training and test MSEIf your test error is substantially worse than the train error, this is a sign that the model doesn't generalize well to future cases.
One simple way to demonstrate overfitting and underfitting is to alter the size of our train-test split. By default, scikit-learn allocates 25% of the data to the test set and 75% to the training set. Fitting a model on only 10% of the data is apt to lead to underfitting, while training a model on 99% of the data is apt to lead to overfitting.
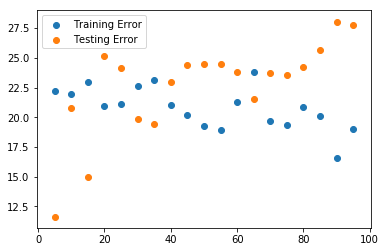
Iterate over a range of train-test split sizes from .5 to .95. For each of these, generate a new train/test split sample. Fit a model to the training sample and calculate both the training error and the test error (mse) for each of these splits. Plot these two curves (train error vs. training size and test error vs. training size) on a graph.
<matplotlib.legend.Legend at 0x1a24d6cef0>
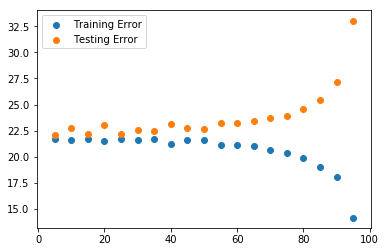
Repeat the previous example, but for each train-test split size, generate 100 iterations of models/errors and save the average train/test error. This will help account for any particularly good/bad models that might have resulted from poor/good splits in the data.
<matplotlib.legend.Legend at 0x1a26e93438>
What's happening here? Evaluate your result!
Congratulations! You now practiced your knowledge of MSE and used your train-test split skills to validate your model.

