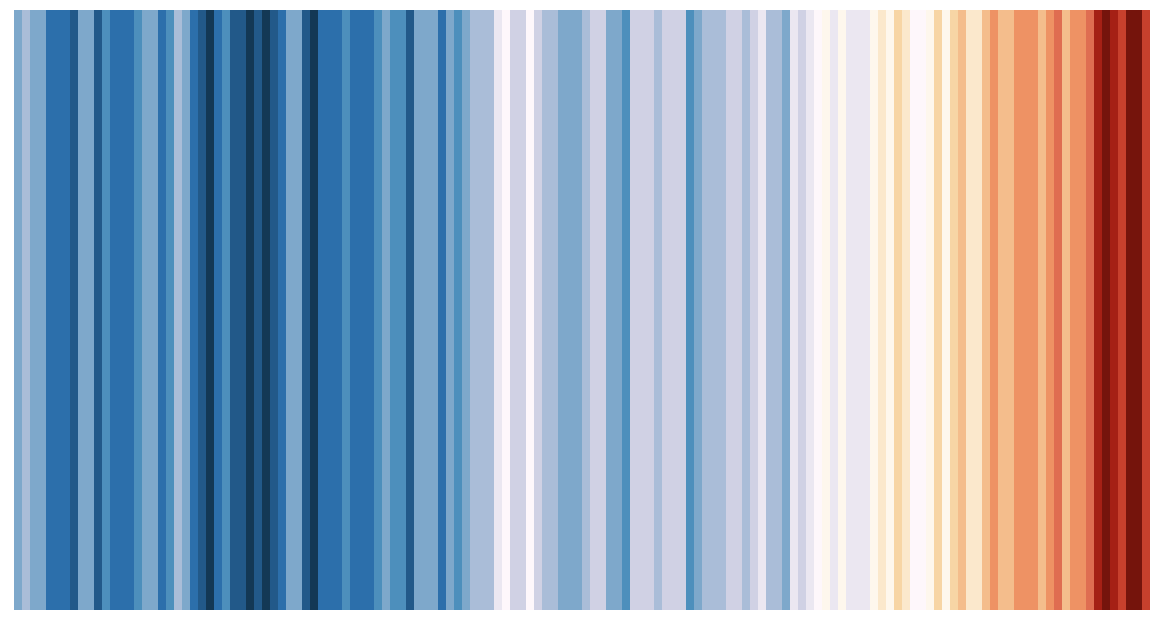
 This graph is showing the temperature anomaly from the averaged monthly global (land and sea-surface temperatures) 30-year-mean from 1951-1980 as the color of each year's rectangle. Each year is represented by a recatangle, with years as the x-axis, the year 1880 (when modern record-keeping began) being on the far left and 2021 (last year with complete data) on the far right. The year's difference from the baseline temperature is the anomaly. Normally, those values cooler than baseline are in the blue range, and those warmer than baseline are in the orange range. However, as this is a tutorial, they are mapped directly.
This is a data visualization project based off of Ed Hawkins' original presentation. My goal is to learn some D3. I'm following a tutorial from v5. The tutorial is by Elisabeth Robson, and is available at several places online.
The dataset is from NASA's Combined Land-Surface Air and Sea-Surface Water Temperature Anomalies (Land-Ocean Temperature Index, L-OTI), with the base period: 1951-1980. That is, these monthly deviations are from the corresponding 1951-1980 means. (sources: GHCN-v4 1880-12/2021 + SST: ERSST v5 1880-12/2021 using elimination of outliers and homogeneity adjustment)
The Colors were for the scale approximated from https://colorbrewer2.org, with the deepest blue being the lowest (cooler than average) from the baseline, and the deepest orange being the highest (warmest) anomaly.
The min and max for the anomalies are found, and used as a range for the colorbar. We have 18 colors to map over -0.48 to 1.02, so the middle point isn't the palest color.
I plan on adding a color bar legend at some point.