Integrated Windows endpoint log management (Docker + ELK(ElasticSearch, Logstash, Kibana) + Winlogbeat based)
Preview

Tested environments
- ELK Server(Management server); Ubuntu 22.04.6 LTS, 64bits
- ELK Client(Windows endpoint); Windows 10 Home, 64bits
- ELK stack version
7.1.1(Elasticsearch, Logstash, Kibana + winlogbeats) - Both server and client are interconnected in the VMWare virtualization environment, a network configured as NAT(Network Address Translation) mode.

- Via winlogbeat, relay gathers activity information from sysmon on the WIndows endpoint to logstash on ELK server.
- logstash reads, parses, transforms, and relays the data to elasticsearch.
- kibana searches and visualizes the information from elasticsearch.
-
ELK server (suppose the IP address is
192.168.133.141/24)- Create or navigate the empty dedicated directory.
- Install
git,docker, anddocker-compose. - Get the environment
git clone https://github.com/KnightChaser/docker-elk-winlogbeat.gitat once. - Check the configuration files. (Below is an explanation. You don't need to change this if you just want to use as default.)
docker-compose.ymlis for overall docker configuration setup. To make it simple, this project uses7.1.1version instead of8, not to consider about the enrollment token and miscellaneous security settings. Also, port configuration will be standardized according to this yml file. Other applications or setting files shouldn't have any conflict with this file.
# We will use ELK stack families with version of 7.1.1 (even including winlogbeat)
    elasticsearch:
        image: docker.elastic.co/elasticsearch/elasticsearch:7.1.1
            ports:
            - 9200:9200
            - 9300:9300
        # ...
    logstash:
        image: docker.elastic.co/logstash/logstash:7.1.1
            ports:
            - 5044:5044
            - 5000:5000/tcp   # <--- logstash will communicate with winlogbeat installed on Windows endpoint via this port (:5000 in this case.)
            - 5000:5000/udp
            - 9600:9600
        # ...
    kibana:
        image: docker.elastic.co/kibana/kibana:7.1.1
            ports:
            - 5601:5601
        # ...
elasticsearch/config/elasticsearch.ymlis for Elasticsearch configuration. To make this service is accessible by everyone, I setnetwork.hostproperty as0.0.0.0.
cluster.name: "docker-cluster"
network.host: 0.0.0.0
discovery.type: single-node
kibana/config/kibana.ymlis for Kibana configuration. Because Kibana receives and interacts with Elasticsearch, Port number setting should be identical withdocker-compose.yml.
server.name: kibana
server.host: 0.0.0.0
elasticsearch.hosts: [ "http://elasticsearch:9200" ]
xpack.monitoring.ui.container.elasticsearch.enabled: true
logstash/config/logstash.ymlis for Logstash configuration connected to elasticsearch(forwarding parsed and transformed data.). Port number setting should be identical withdocker-composes.yml.
http.host: "0.0.0.0"
xpack.monitoring.elasticsearch.hosts: [ "http://elasticsearch:9200" ]
logstash/pipeline/logstash.confis for the Logstash pipelining configuration connected to any pre-configured Windows endpoint(from winlogbeat).portsetting ininputshould correspond to bothdocker-compose.ymland winlogbeat YML setting file in Windows endpoint.hostsinoutputsection describes Elasticsearch connection information. This information should be identical todocker-compose.yml. Other configurations may be adjusted for your needs(For parsing, indexing, transforming data during the pipelining procedure.).
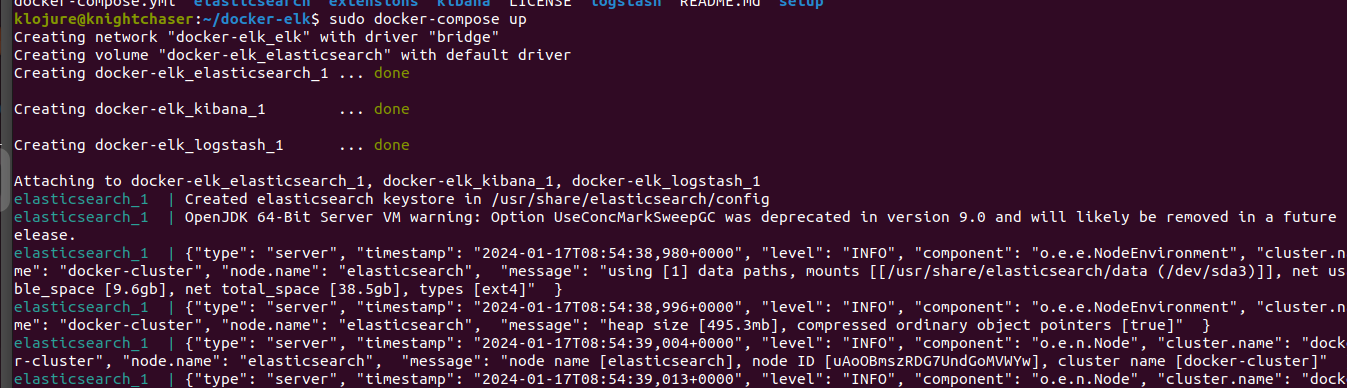
input { beats{ port => 5000 } } output { elasticsearch { hosts => "elasticsearch:9200" user => "username" password => "password" index => "%{[@metadata][beat]}-%{+YYYY.MM.dd}" document_type => "%{[@metadata][type]}" } } - Initiate the ELK server by hitting
sudo docker-compose up -d. To terminate the server operation, hitsudo docker-compose down -vinstead.
- Complete ELK Client setup
- Open a web browser in the ELK server and access
localhost:5601. Head toKibana > Index patternsand set up the GUI management panel. Define the index pattern, and find the fields. You can customize the setting, add more things to the pipeline, or build a new fancy GUI panel. Creative parts are on your hands! -


-
ELK Client (suppose the IP address is
192.168.133.142/24)- Install the sysmon(system monitor) program from the official Microsoft webpage. (Modern versions are okay.)
https://learn.microsoft.com/en-us/sysinternals/downloads/sysmon- Download the winlogbeat with version of
7.1.1. (Because ELK stack is configured as the version of7.1.1, matching the overall version is highly encouraged.)
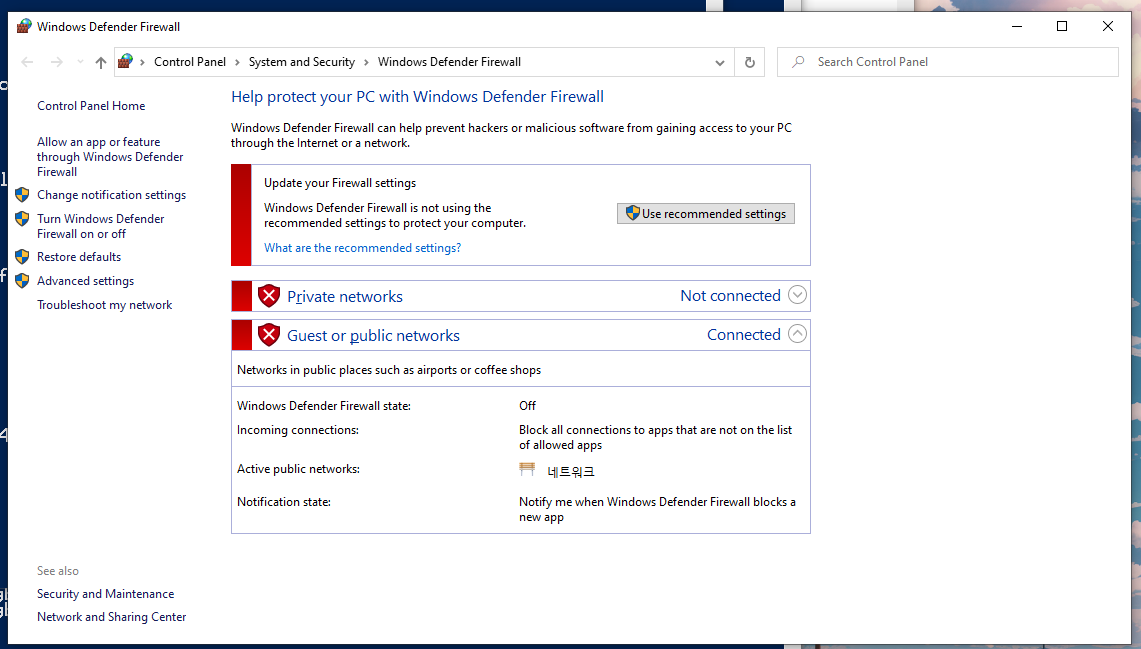
https://www.elastic.co/downloads/past-releases/winlogbeat-7-1-1- Test an ICMP connectivity(
ping) between ELK servers and ELK clients. You can consider disabling the Windows firewall that blocks communications while the machines are part of the ELK stack.
- Initiate sysmon. If you don't have any XML sysmon rule, you can download and use
sysmonconfig-export.ymlfile as the default for sysmon. And, execute the sysmon service. (.\sysmon.exe --accepteula,.\sysmon.exe -i <path_to>\sysmonconfig-export.xml...)
https://github.com/SwiftOnSecurity/sysmon-config/blob/master/sysmonconfig-export.xml- Save the winlogbeat configuration with below content(IP address/Port number should be matches with ELK server.) file as
winlogbeat.ymlat the right directory of winlogbeat.
winlogbeat.event_logs:
    - name: Microsoft-Windows-Sysmon/Operational

output.logstash:
    hosts: ["192.168.133.141:5000"]
    index: winlogbeat
- Initiate winlogbeat. (You can check winlogbeat service registry at
Services(Sc.exe) utility.)
.\winlogbeat.exe -c .\winlogbeat.yml
.\install-service-winlogbeat.ps1
.\Start-Service winlogbeat

- KnightChaser (Lee Garam) Github