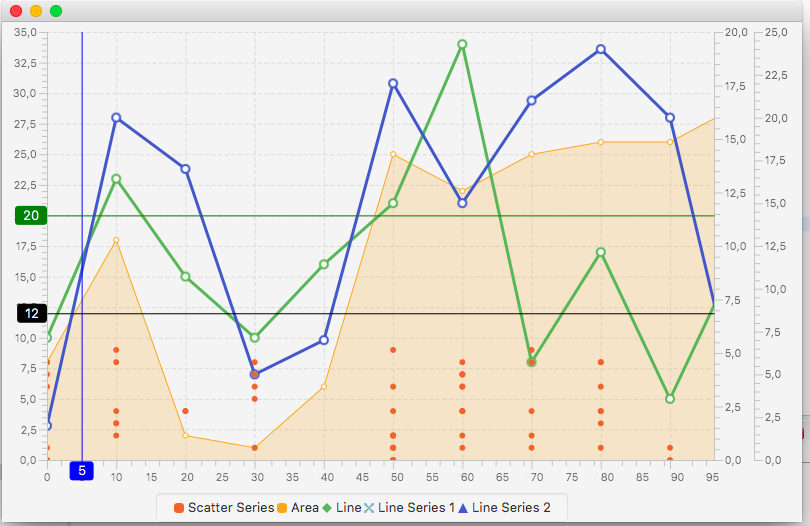
A work in progress fix for the default javafx chart class to allow combining multiple chart types and axis in one chart object. Currently JavaFX does not support to create a composite chart using different series types. Java 10 required!**
- Fixed value markers
- Multiple X and Y Axis
- Hide/Show Series (click on legend)
- Different chart types in one chart
Due to the alpha development state the project is not hosted on bintray but if required snapshots can be included via jitpack https://jitpack.io/#KilianB/JavaFXMultiChart
<repositories>
   <repository>
      <id>jitpack.io</id>
      <url>https://jitpack.io</url>
   </repository>
</repositories>

<dependencies>
   <dependency>
      <groupId>com.github.KilianB</groupId>
      <artifactId>JavaFXMultiChart</artifactId>
      <version>2b506d77ac</version>
   </dependency>
</dependencies>
//Create a chart
MultiTypeChart<Number, Number> multiTypeChart= new MultiTypeChart<>(new NumberAxis(), new NumberAxis());

//Builder pattern
TypedSeries lineSeries = TypedSeries.builder("Line").line().build();
TypedSeries areaSeries = TypedSeries.builder("Area").area().build();
TypedSeries scatterSeries = TypedSeries.builder("Scatter").scatter().build();

//Advanced control with full generics
TypedSeries<Number,Number> lineSeries1 = TypedSeries.<Number,Number>
    builder("Line Series 1").line()
    .withYAxisIndex(1)
    .withYAxisSide(Side.RIGHT)
    .build();

//Add/remove value markers
boolean showLabel = true;
multiTypeChart.addValueMarker(new ValueMarker<Number>(5,true,Color.BLUE,showLabel));
multiTypeChart.addValueMarker(new ValueMarker<Number>(12,false,Color.BLACK,showLabel));
multiTypeChart.addValueMarker(new ValueMarker<Number>(20,false,Color.GREEN,showLabel));

//add series
multiTypeChart.addSeries(scatterSeries);
multiTypeChart.addSeries(areaSeries);
multiTypeChart.addSeries(lineSeries);

//customize color if desired
multiTypeChart.setSeriesColor(1, 90);
multiTypeChart.setSeriesColor(2, 50);

//customize symbol (currently not well supported with colors)
//multiTypeChart.setSeriesSymbol(0,SymbolType.solidTriangle);
//multiTypeChart.setSeriesSymbol(1,SymbolType.solidTriangle);

//Add data
for(...){
    lineSeries.addData(x,y);
}| ColorId | Color | Hex | Decimal Code |
|---|---|---|---|
| 7 |
|
#800000 | 128,0,0 |
| 8 |
|
#8b0000 | 139,0,0 |
| 9 |
|
#a52a2a | 165,42,42 |
| 10 |
|
#b22222 | 178,34,34 |
| 11 |
|
#dc143c | 220,20,60 |
| 12 |
|
#ff0000 | 255,0,0 |
| 13 |
|
#ff6347 | 255,99,71 |
| 14 |
|
#ff7f50 | 255,127,80 |
| 15 |
|
#cd5c5c | 205,92,92 |
| 16 |
|
#f08080 | 240,128,128 |
| 17 |
|
#e9967a | 233,150,122 |
| 18 |
|
#fa8072 | 250,128,114 |
| 19 |
|
#ffa07a | 255,160,122 |
| 20 |
|
#ff4500 | 255,69,0 |
| 21 |
|
#ff8c00 | 255,140,0 |
| 22 |
|
#ffa500 | 255,165,0 |
| 23 |
|
#ffd700 | 255,215,0 |
| 24 |
|
#b8860b | 184,134,11 |
| 25 |
|
#daa520 | 218,165,32 |
| 26 |
|
#eee8aa | 238,232,170 |
| 27 |
|
#bdb76b | 189,183,107 |
| 28 |
|
#f0e68c | 240,230,140 |
| 29 |
|
#808000 | 128,128,0 |
| 30 |
|
#ffff00 | 255,255,0 |
| 31 |
|
#9acd32 | 154,205,50 |
| 32 |
|
#556b2f | 85,107,47 |
| 33 |
|
#6b8e23 | 107,142,35 |
| 34 |
|
#7cfc00 | 124,252,0 |
| 35 |
|
#7fff00 | 127,255,0 |
| 36 |
|
#adff2f | 173,255,47 |
| 37 |
|
#006400 | 0,100,0 |
| 38 |
|
#008000 | 0,128,0 |
| 39 |
|
#228b22 | 34,139,34 |
| 40 |
|
#00ff00 | 0,255,0 |
| 41 |
|
#32cd32 | 50,205,50 |
| 42 |
|
#90ee90 | 144,238,144 |
| 43 |
|
#98fb98 | 152,251,152 |
| 44 |
|
#8fbc8f | 143,188,143 |
| 45 |
|
#00fa9a | 0,250,154 |
| 46 |
|
#00ff7f | 0,255,127 |
| 47 |
|
#2e8b57 | 46,139,87 |
| 48 |
|
#66cdaa | 102,205,170 |
| 49 |
|
#3cb371 | 60,179,113 |
| 50 |
|
#20b2aa | 32,178,170 |
| 51 |
|
#2f4f4f | 47,79,79 |
| 52 |
|
#008080 | 0,128,128 |
| 53 |
|
#008b8b | 0,139,139 |
| 54 |
|
#00ffff | 0,255,255 |
| 55 |
|
#00ffff | 0,255,255 |
| 56 |
|
#e0ffff | 224,255,255 |
| 57 |
|
#00ced1 | 0,206,209 |
| 58 |
|
#40e0d0 | 64,224,208 |
| 59 |
|
#48d1cc | 72,209,204 |
| 60 |
|
#afeeee | 175,238,238 |
| 61 |
|
#7fffd4 | 127,255,212 |
| 62 |
|
#b0e0e6 | 176,224,230 |
| 63 |
|
#5f9ea0 | 95,158,160 |
| 64 |
|
#4682b4 | 70,130,180 |
| 65 |
|
#6495ed | 100,149,237 |
| 66 |
|
#00bfff | 0,191,255 |
| 67 |
|
#1e90ff | 30,144,255 |
| 68 |
|
#add8e6 | 173,216,230 |
| 69 |
|
#87ceeb | 135,206,235 |
| 70 |
|
#87cefa | 135,206,250 |
| 71 |
|
#191970 | 25,25,112 |
| 72 |
|
#000080 | 0,0,128 |
| 73 |
|
#00008b | 0,0,139 |
| 74 |
|
#0000cd | 0,0,205 |
| 75 |
|
#0000ff | 0,0,255 |
| 76 |
|
#4169e1 | 65,105,225 |
| 77 |
|
#8a2be2 | 138,43,226 |
| 78 |
|
#4b0082 | 75,0,130 |
| 79 |
|
#483d8b | 72,61,139 |
| 80 |
|
#6a5acd | 106,90,205 |
| 81 |
|
#7b68ee | 123,104,238 |
| 82 |
|
#9370db | 147,112,219 |
| 83 |
|
#8b008b | 139,0,139 |
| 84 |
|
#9400d3 | 148,0,211 |
| 85 |
|
#9932cc | 153,50,204 |
| 86 |
|
#ba55d3 | 186,85,211 |
| 87 |
|
#800080 | 128,0,128 |
| 88 |
|
#d8bfd8 | 216,191,216 |
| 89 |
|
#dda0dd | 221,160,221 |
| 90 |
|
#ee82ee | 238,130,238 |
| 91 |
|
#ff00ff | 255,0,255 |
| 92 |
|
#da70d6 | 218,112,214 |
| 93 |
|
#c71585 | 199,21,133 |
| 94 |
|
#db7093 | 219,112,147 |
| 95 |
|
#ff1493 | 255,20,147 |
| 96 |
|
#ff69b4 | 255,105,180 |
| 97 |
|
#ffb6c1 | 255,182,193 |
| 98 |
|
#ffc0cb | 255,192,203 |
| 99 |
|
#faebd7 | 250,235,215 |
| 100 |
|
#f5f5dc | 245,245,220 |
| 101 |
|
#ffe4c4 | 255,228,196 |
| 102 |
|
#ffebcd | 255,235,205 |
| 103 |
|
#f5deb3 | 245,222,179 |
| 104 |
|
#fff8dc | 255,248,220 |
| 105 |
|
#fffacd | 255,250,205 |
| 106 |
|
#fafad2 | 250,250,210 |
| 107 |
|
#ffffe0 | 255,255,224 |
| 108 |
|
#8b4513 | 139,69,19 |
| 109 |
|
#a0522d | 160,82,45 |
| 110 |
|
#d2691e | 210,105,30 |
| 111 |
|
#cd853f | 205,133,63 |
| 112 |
|
#f4a460 | 244,164,96 |
| 113 |
|
#deb887 | 222,184,135 |
| 114 |
|
#d2b48c | 210,180,140 |
| 115 |
|
#bc8f8f | 188,143,143 |
| 116 |
|
#ffe4b5 | 255,228,181 |
| 117 |
|
#ffdead | 255,222,173 |
| 118 |
|
#ffdab9 | 255,218,185 |
| 119 |
|
#ffe4e1 | 255,228,225 |
| 120 |
|
#fff0f5 | 255,240,245 |
| 121 |
|
#faf0e6 | 250,240,230 |
| 122 |
|
#fdf5e6 | 253,245,230 |
| 123 |
|
#ffefd5 | 255,239,213 |
| 124 |
|
#fff5ee | 255,245,238 |
| 125 |
|
#f5fffa | 245,255,250 |
| 126 |
|
#708090 | 112,128,144 |
| 127 |
|
#778899 | 119,136,153 |
| 128 |
|
#b0c4de | 176,196,222 |
| 129 |
|
#e6e6fa | 230,230,250 |
| 130 |
|
#fffaf0 | 255,250,240 |
| 131 |
|
#f0f8ff | 240,248,255 |
| 132 |
|
#f8f8ff | 248,248,255 |
| 133 |
|
#f0fff0 | 240,255,240 |
| 134 |
|
#fffff0 | 255,255,240 |
| 135 |
|
#f0ffff | 240,255,255 |
| 136 |
|
#fffafa | 255,250,250 |
| 137 |
|
#000000 | 0,0,0 |
| 138 |
|
#696969 | 105,105,105 |
| 139 |
|
#808080 | 128,128,128 |
| 140 |
|
#a9a9a9 | 169,169,169 |
| 141 |
|
#c0c0c0 | 192,192,192 |
| 142 |
|
#d3d3d3 | 211,211,211 |
| 143 |
|
#dcdcdc | 220,220,220 |
| 144 |
|
#f5f5f5 | 245,245,245 |
| 145 |
|
#ffffff | 255,255,255 |
- Fixed hide and display series via setDisabled rather than css (more stable)
- added new color options beyond the default 8
- support choosing defined color and series symbol
- add batch addition of data to a series reducing redraw operations
- Add builder pattern to typed series
- Add support for secondary/multiple x and y axis
- change legend to be a flow pane instead of tile pane for better looking layout
- add support to show hide series on mouse click
Due to the API containing a lot of private and final methods the result is rather lackluster and just works good enough if somone does not look at the code. (A lot of copy and pasted code, switch statements and almost no indication of OOP). Java 9/10 discourage "illegal" reflection access usage and byte code manipulation in conjunction with a custom class loader to circumvent the final restrictions seem a bit overkill for such a feature. This should only be considered a hack until the api caught up until the jdk feature request JDK-8090594 is resolved.
- Support all basic chart types
- potential ObservableValue resource leak if series get added and removed
- implement animation code
- implement remove series action
- make full use of beans.observable.values
- test secondary/3rd ... nth x Axis and left axis.
- don't rely on generics (they don't really apply when using multiple axis) and move from extending javafx x,y chart to just chart.
- allow value markers to be added to an arbitrary axis.
**I think there is one usage of var and no streams or anything else, so if you want to backport it to Java <8 it should take 2 minutes.