hbase-packet-inspector (HPI) is a command-line tool for analyzing network traffic of HBase RegionServers.
HPI reads tcpdump files or captures live stream of packets of a network interface to extract the information on client requests and responses.
You can configure it to load the obtained information either to its in-memory database, which you can access via command-line and web-based SQL interface, or to a remote Kafka cluster.
Usage:
  hbase-packet-inspector [OPTIONS] [-i INTERFACE]
  hbase-packet-inspector [OPTIONS] FILES...

Options:
  -h --help                 Show this message
  -i --interface=INTERFACE  Network interface to monitor
  -p --port=PORT            Port to monitor (default: 16020 and 60020)
  -c --count=COUNT          Maximum number of packets to process
  -d --duration=DURATION    Number of seconds to capture packets
  -k --kafka=SERVERS/TOPIC  Kafka bootstrap servers and the name of the topic
                              /TOPIC:
                                /T      Both requests and responses to T
                                /T1/T2  Requests to T1, responses to T2
                                /T/     Requests to T, responses are ignored
                                //T     Requests are ignored, responses to T
  -v --verbose              Verbose output
When file arguments are not given, HPI will capture the live stream of packets
from a network interface (root permission required). It will continue until
a specified time has passed (--duration), or a certain number of packets
have been processed (--count), or the user interrupted it by pressing the
enter key. Then it will launch command-line and web-based SQL interfaces so
you can analyze the results using SQL.
Each version of HPI is distributed as an executable JAR file.
# With JVM options
java -Xmx2g -jar hbase-packet-inspector-0.2.0.jar --help

# Reading from tcpdump output
sudo tcpdump -s 0 -c 100000 -nn -w dump.pcap port 16020 or port 60020
java -jar hbase-packet-inspector-0.2.0.jar dump.pcap

# Capturing live stream of packets; continues until you press enter
sudo java -jar hbase-packet-inspector-0.2.0.jarSince the size of memory is limited, you'll have to interrupt the live capture at a certain point of time to avoid OOM. But if you want to keep HPI alive to monitor the traffic for longer periods of time, you can make it send records to a remote Kafka cluster in JSON format instead of building the in-memory database.
alias hbase-packet-inspector='java -Xmx2g -jar hbase-packet-inspector-0.2.0.jar'

# Both requests and responses are sent to hbase-traffic topic.
# - See boolean "inbound?" field to differentiate two types of records
hbase-packet-inspector --kafka "bootstrap1:9092,bootstrap2:9092/hbase-traffic"

# Requests to hbase-requests, responses to hbase-responses
hbase-packet-inspector --kafka "bootstrap1:9092,bootstrap2:9092/hbase-requests/hbase-responses"

# Only requests to hbase-requests
hbase-packet-inspector --kafka "bootstrap1:9092,bootstrap2:9092/hbase-requests/"

# Only responses to hbase-requests
hbase-packet-inspector --kafka "bootstrap1:9092,bootstrap2:9092//hbase-requests"

# Additional key-value pairs to be included in each record
hbase-packet-inspector \
    --kafka "bootstrap1:9092,bootstrap2:9092/hbase-traffic?service=twitter&cluster=feed"
Shipping the information to Kafka has the following benefits:
- Data collection is no longer limited by the size of the physical memory of the server.
- You can monitor network traffic of multiple RegionServers at once and get a better picture of the cluster activity.
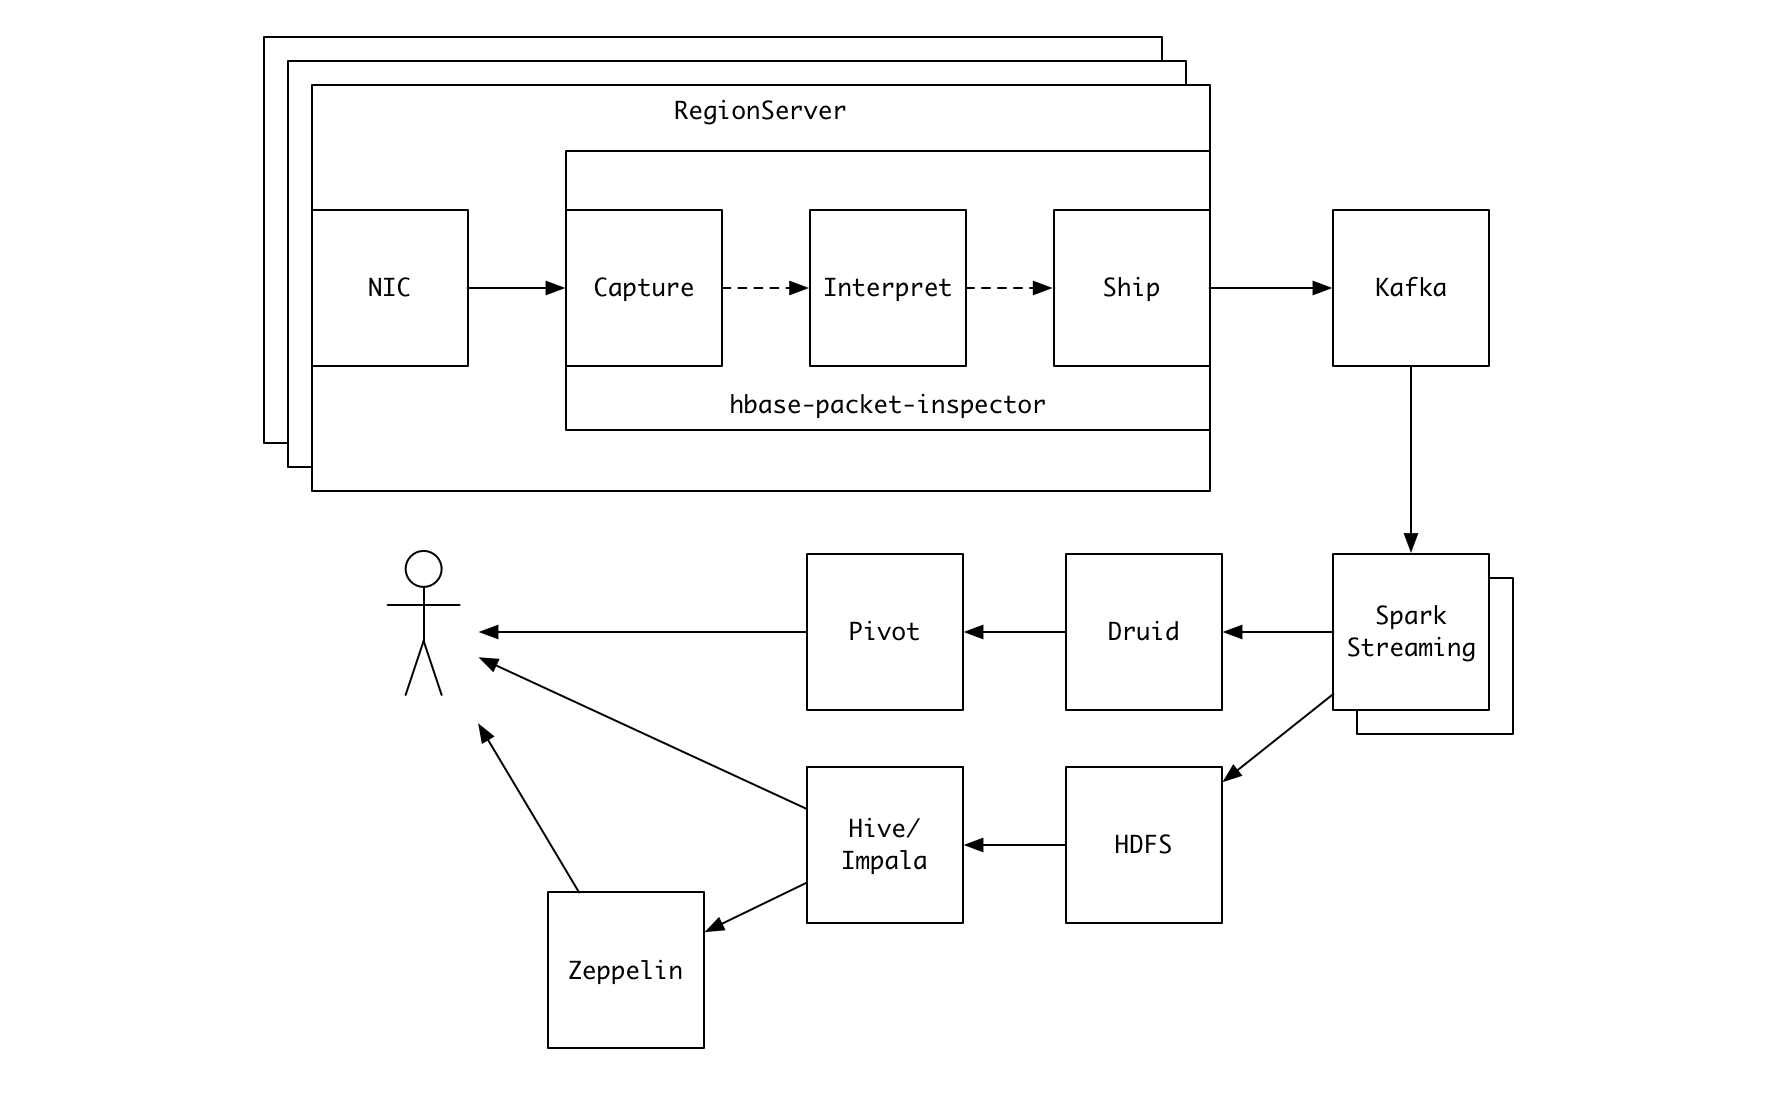
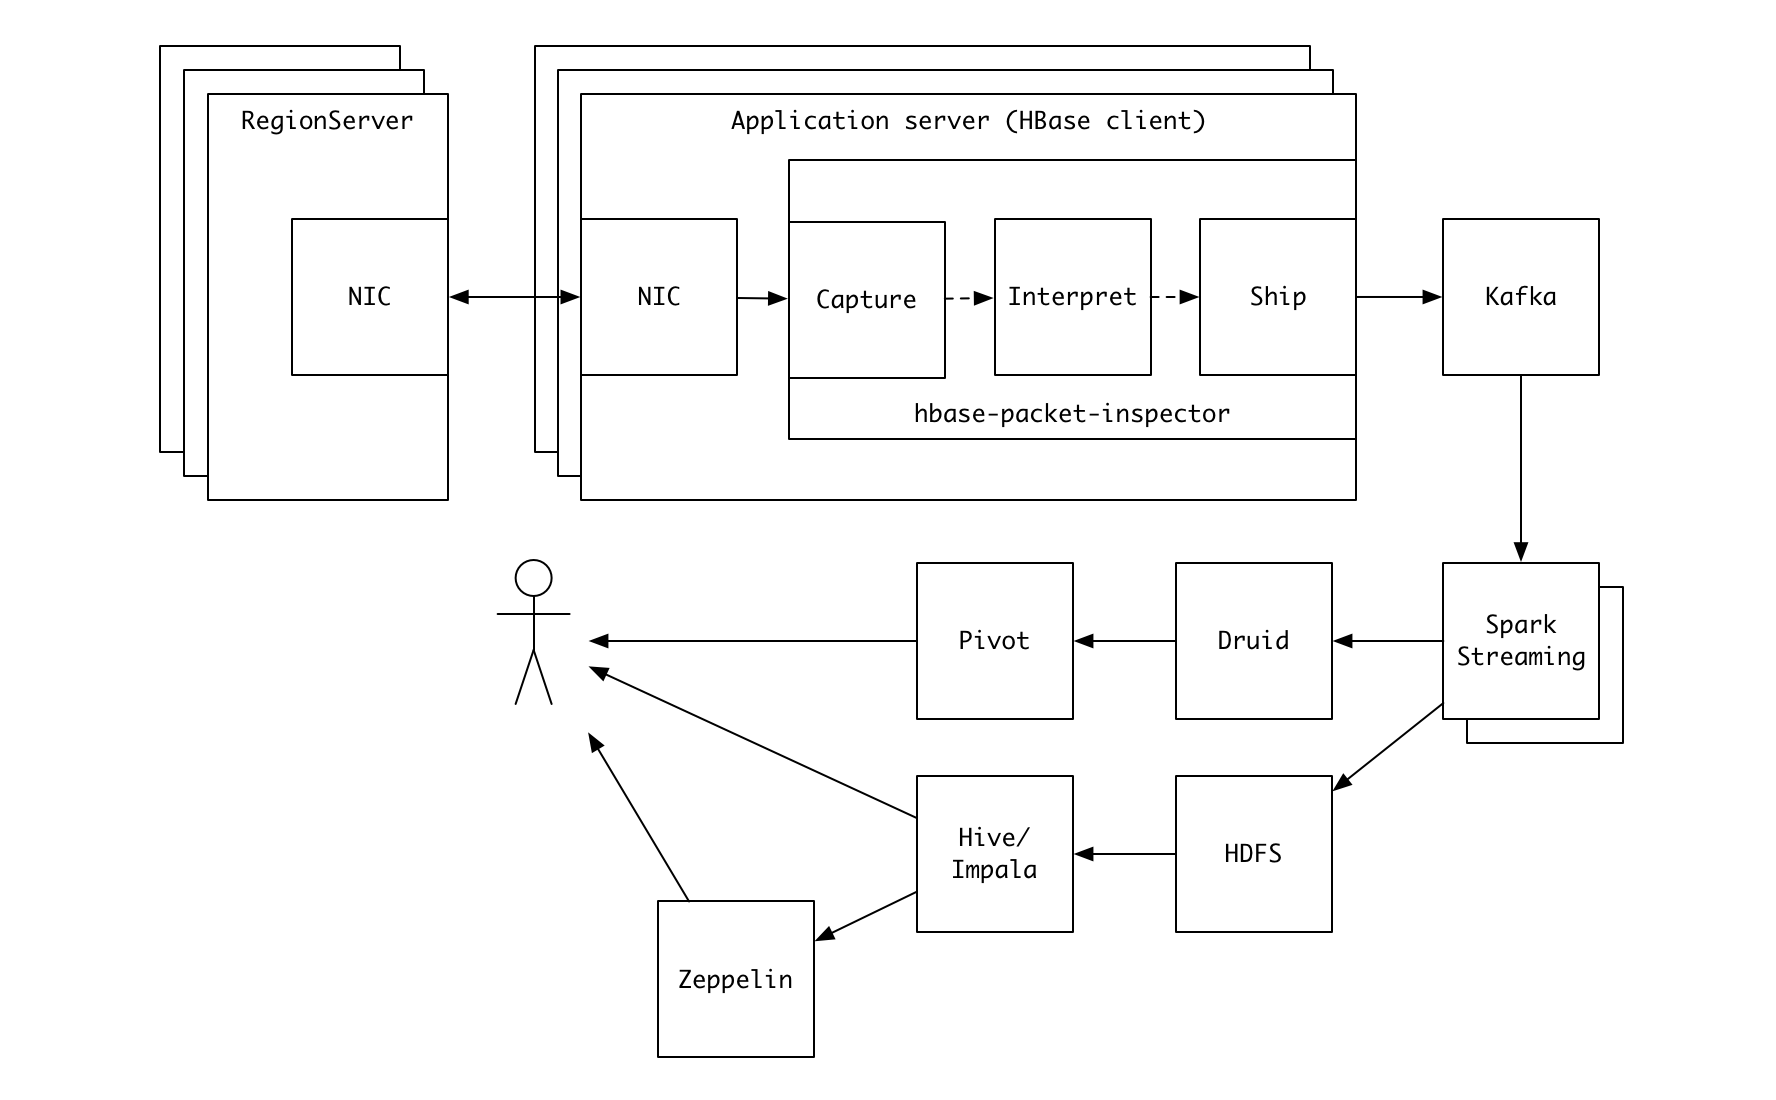
- You can build a sophisticated data pipeline using multiple Kafka consumers as shown in the figure below.
Note that HPI doesn't have to run on RegionServers. You can deploy it on application servers running HBase client processes.
| Column | Data type | Description |
|---|---|---|
| ts | timestamp | Event timestamp |
| client | varchar | Client IP address |
| port | int | Client port |
| call_id | int | Call ID |
| server | varchar | Server IP address |
| method | varchar | Request type (e.g. get, put, ...) |
| size | int | Byte size of the request |
| batch | int | Number of actions in batch request. Null if not a batch request. |
| table | varchar | Table name |
| region | varchar | Encoded region name |
| row | varchar | Row key or start row key for a scan |
| stoprow | varchar | Stop row key for a scan |
| cells | int | Number of cells attached |
| durability | varchar | Durability mode |
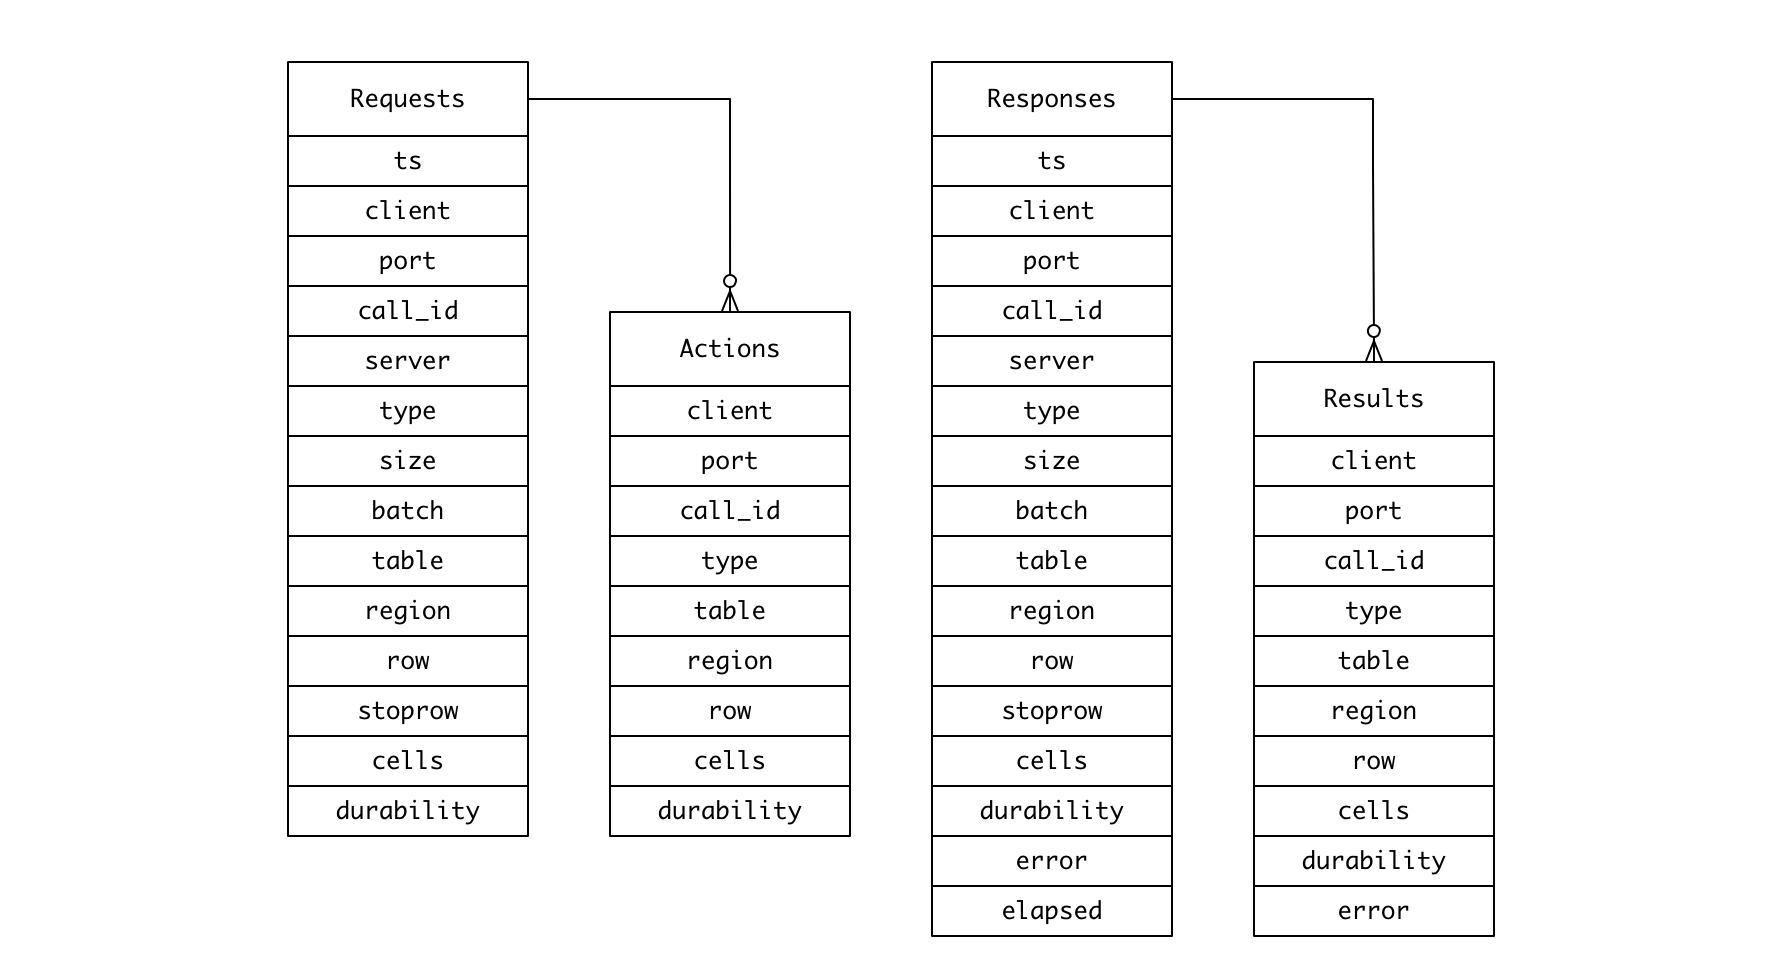
rowandstoprowcolumns are stored as human-readable versions of the original byte arrays obtained by applyingBytes.toStringBinary.call_idis not globally unique nor monotonically increasing. Join between the tables should be performed on [client,port,call_id] columns.
A batch/multi request can consist of multiple actions of different types.
Embedded as actions array when sent to Kafka as JSON record.
| Column | Data type | Description |
|---|---|---|
| client | varchar | Client IP address |
| port | int | Client port |
| call_id | int | Call ID |
| method | varchar | Request type |
| table | varchar | Table name |
| region | varchar | Encoded region name |
| row | varchar | Row key |
| cells | int | Number of cells attached |
| durability | varchar | Durability mode |
Same as requests, but with the following additional columns:
| Column | Data type | Description |
|---|---|---|
| error | varchar | Exception. Null if succeeded. |
| elapsed | int | Elapsed time in millisecond |
elapsedis measured as the difference between the timestamp of a request and that of the matching response.
Same as actions, but with error column. Embedded as results array when
sent to Kafka as JSON record.
- Prerequisite: Leiningen
# Build executable uber JAR file -> target/hbase-packet-inspector-<VERSION>.jar
lein uberjarThis repository includes Makefile for building RPM files for Centos 6 and 7 using Docker.
make rpmRPM files will be created under rpmbuild/RPMS/x86_64 directory.
lein test

# For coverage report, use lein-cloverage (https://github.com/cloverage/cloverage)
lein cloverageSome of the test cases read actual tcpdump output files for a predefined series of HBase client operations. They were generated by running generate-fixtures.sh inside Docker container built with the included Dockerfile.
(cd dev-resources/load-generator && lein uberjar)
docker build -t hpi-test-env .
docker run -v $(PWD)/dev-resources:/data -it hpi-test-env /data/generate-fixtures.shFamiliarize yourself with the way HPI works by trying out the following
snippet on Clojure REPL (lein repl).
(ns user
  (:require [hbase-packet-inspector.core :as core]
            [hbase-packet-inspector.sink.db :as db]
            [hbase-packet-inspector.sink.kafka :as kafka]
            [clojure.java.io :as io]
            [clojure.tools.logging :as log]
            [clojure.java.jdbc :as jdbc]))

;;; Log records parsed from tcpdump output file
(core/read-pcap-file
 (.getPath (io/resource "scan.pcap"))
 #(log/info %)
 {:port 16201})

;;; Load records into H2 in-memory database
(def connection
  (doto (db/connect) db/create))

(let [load (db/load-fn connection)]
  (core/read-pcap-file
    (.getPath (io/resource "scan.pcap"))
    load
    {:port 16201}))

(jdbc/query {:connection connection} "select count(*) from requests")

;;; See how records are sent to Kafka
(core/read-pcap-file
  (.getPath (io/resource "randomRead.pcap"))
  #(log/info (.value (kafka/make-record "hbase-packets" %)))
{:port 16201})-
If the rate of the packet stream exceeds the processing capacity of HPI, packets will be dropped, and HPI will not be able to capture the precise statistics of the workload.
-
HPI uses libpcap to capture packets, and it's known to be expensive. You have to be aware that running HPI (or just tcpdump) can degrade the peak performance of the server by up to 20%. Our rule of thumb is to run it only on RegionServers with relatively low CPU usage (e.g. less than 50%) or on application servers as HPI can correctly determine which peer is a RegionServer by examining the port numbers.
-
HPI is inherently more expensive than tcpdump. It has to process and interpret the packet stream, and build in-memory database or send the information to Kafka after gzip compression. The whole process can occupy up to
2 + min(2, floor(TOTAL_NUMBER_OF_CORES / 4))cores or your server. So if you're concerned about the CPU usage of the server, you might want to dump the packets using tcpdump, copy it to another server and run HPI there. Or you can deploy HPI on application servers as noted above.
This software is licensed under the Apache 2 license, quoted below.
Copyright 2017 Kakao Corp. http://www.kakaocorp.com
Licensed under the Apache License, Version 2.0 (the "License"); you may not use this project except in compliance with the License. You may obtain a copy of the License at http://www.apache.org/licenses/LICENSE-2.0.
Unless required by applicable law or agreed to in writing, software distributed under the License is distributed on an "AS IS" BASIS, WITHOUT WARRANTIES OR CONDITIONS OF ANY KIND, either express or implied. See the License for the specific language governing permissions and limitations under the License.


