Build a Traffic Sign Recognition Project
The goals / steps of this project are the following:
- Load the data set
- Explore, summarize and visualize the data set
- Design, train and test a model architecture
- Use the model to make predictions on new images
- Analyze the softmax probabilities of the new images
- Summarize the results with a written report
Hi! Welcome to the writeup of my traffic sign recognition project. You can find the source code to my project in the jupyter notebook that was sent together with this document.
I used the pandas library to calculate summary statistics of the traffic signs data set:
- The size of training set is 34799
- The size of the validation set is 4410
- The size of test set is 12630
- The shape of a traffic sign image is (32, 32, 3)
- The number of unique classes/labels in the data set is 43
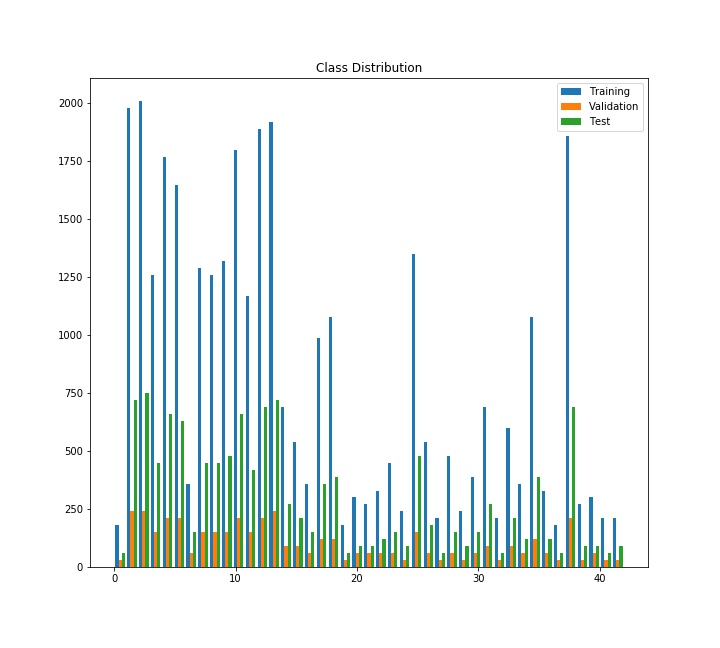
Here is an exploratory visualization of the data set. Below are 4 images selected randomly from the training set and a bar chart showing how the classes are distributed for each of the dataset partitions.
We can see the data is right skewed and that some signs have a much higher frequency than others.
As a first step, I decided to convert the images to grayscale because the LeNet architecture seems to work well finding shapes
(i.e. digits recognition), so I decided to focus on shape rather than color.
As a last step, I normalized the image data because it's a standard measure shown to improve performance in any neural network.
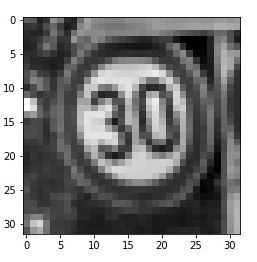
Here is an example of a traffic sign image after grayscaling.
My final model was very similar to the LeNet architecture and consisted of the following layers:
| Layer | Description |
|---|---|
| Input | 32x32x1 grayscale image |
| Convolution 5x5 | 1x1 stride, valid padding, outputs 28x28x6 |
| RELU | |
| Max pooling | 2x2 stride, outputs 14x14x6 |
| Convolution 5x5 | 1x1 stride, valid padding, outputs 10x10x16 |
| Max pooling | 2x2 stride, outputs 5x5x6 |
| Fully connected | inputs 400(5x5x16), outputs 120 |
| RELU | |
| Fully connected | inputs 120 , outputs 84 |
| RELU | |
| Fully connected | inputs 84 , outputs 10 |
| Softmax | inputs 10 |
To train the model, I used the following specification:
- Optimizer: Adam
- Early Stopping: yes
- Loss function: cross entropy
- Regularization: Dropout
- Epochs: 11
- batch size: 128
- learning rate: 0.003
- keep prob: 0.3
My final model results were:
- training set accuracy of 0.985
- validation set accuracy of 0.944
- test set accuracy of 0.917
For this project I chose to use the LeNet architecture. The LeNet architecture was designed primarily for digit recognition
but it has also been used with sucess to identify traffic signs (i.e. http://yann.lecun.com/exdb/publis/pdf/sermanet-ijcnn-11.pdf).
To get the validation accuracy mentioned in the specification, I decided to use dropout regularization and early stopping.
Because the images are fairly low res, I found the test set accuracy to be satisfactory. This model is able to identify at least 9 out of 10 images on the test set.
Here are five German traffic signs that I found on the web:
I think the greatest obstacle is the low resolution of all the inputs. However I find the second image particularly difficult to evalute. For example, one could argue that it could easily be mistaken with a slippery road sign.
Here are the results of the prediction:
| Image | Prediction |
|---|---|
| Yield | Yield |
| Wild animals crossing | Slippery Road |
| General Caution | General Caution |
| Bumpy Road | Bumpy Road |
| Speed limit (70km/h) | Keep Left |
The model was able to correctly guess 3 of the 5 traffic signs, which gives an accuracy of 60%. This is less than the accuracy on the test set (91.7%).
The code for making predictions on my final model is located under the title "Predict the Sign Type for Each Image".
For the first, third and fourth images the model is very sure of it's prediction, their probabilities are over 95%.
However for the second and fifth images the probabilities are under 60%, which makes the predictions quite unreliable.
| Probability | Prediction |
|---|---|
| 1.00 | Yield |
| 0.428 | Slippery Road |
| 1.00 | General Caution |
| 0.981 | Bumpy Road |
| 0.558 | Keep Left |


