Wrapper for pydub AudioSegment objects. An audiosegment.AudioSegment object wraps a pydub.AudioSegment object. Any methods or properties it has, this also has.
This is in very active development, and will likely change over the next few months.
Docs are hosted by Read The Docs.
import audiosegment

print("Reading in the wave file...")
seg = audiosegment.from_file("whatever.wav")

print("Information:")
print("Channels:", seg.channels)
print("Bits per sample:", seg.sample_width * 8)
print("Sampling frequency:", seg.frame_rate)
print("Length:", seg.duration_seconds, "seconds")# ...
print("Detecting voice...")
seg = seg.resample(sample_rate_Hz=32000, sample_width=2, channels=1)
results = seg.detect_voice()
voiced = [tup[1] for tup in results if tup[0] == 'v']
unvoiced = [tup[1] for tup in results if tup[0] == 'u']
print("Reducing voiced segments to a single wav file 'voiced.wav'")
voiced_segment = voiced[0].reduce(voiced[1:])
voiced_segment.export("voiced.wav", format="WAV")
print("Reducing unvoiced segments to a single wav file 'unvoiced.wav'")
unvoiced_segment = unvoiced[0].reduce(unvoiced[1:])
unvoiced_segment.export("unvoiced.wav", format="WAV")import matplotlib.pyplot as plt
# ...
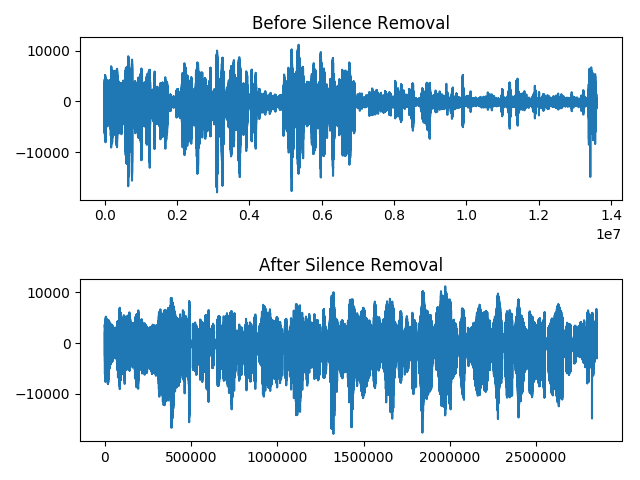
print("Plotting before silence...")
plt.subplot(211)
plt.title("Before Silence Removal")
plt.plot(seg.get_array_of_samples())
seg = seg.filter_silence(duration_s=0.2, threshold_percentage=5.0)
outname_silence = "nosilence.wav"
seg.export(outname_silence, format="wav")
print("Plotting after silence...")
plt.subplot(212)
plt.title("After Silence Removal")
plt.tight_layout()
plt.plot(seg.get_array_of_samples())
plt.show()import matplotlib.pyplot as plt
import numpy as np
#...
# Do it just for the first 3 seconds of audio
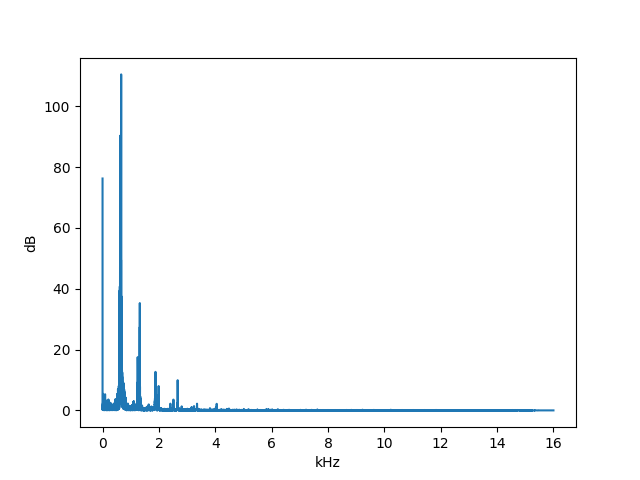
hist_bins, hist_vals = seg[1:3000].fft()
hist_vals_real_normed = np.abs(hist_vals) / len(hist_vals)
plt.plot(hist_bins / 1000, hist_vals_real_normed)
plt.xlabel("kHz")
plt.ylabel("dB")
plt.show()import matplotlib.pyplot as plt
#...
freqs, times, amplitudes = seg.spectrogram(window_length_s=0.03, overlap=0.5)
amplitudes = 10 * np.log10(amplitudes + 1e-9)
# Plot
plt.pcolormesh(times, freqs, amplitudes)
plt.xlabel("Time in Seconds")
plt.ylabel("Frequency in Hz")
plt.show()There is a hidden dependency on the command line program 'sox'. Pip will not install it for you. You will have to install sox by:
- Debian/Ubuntu:
sudo apt-get install sox - Mac OS X:
brew install sox - Windows:
choco install sox


