[bug?] Stacks for syscall traces don't seem to make sense
dalehamel opened this issue · comments

I was hoping to use rbperf to figure out where our remaining calls to getpid are coming from (ref rails/rails#47418)
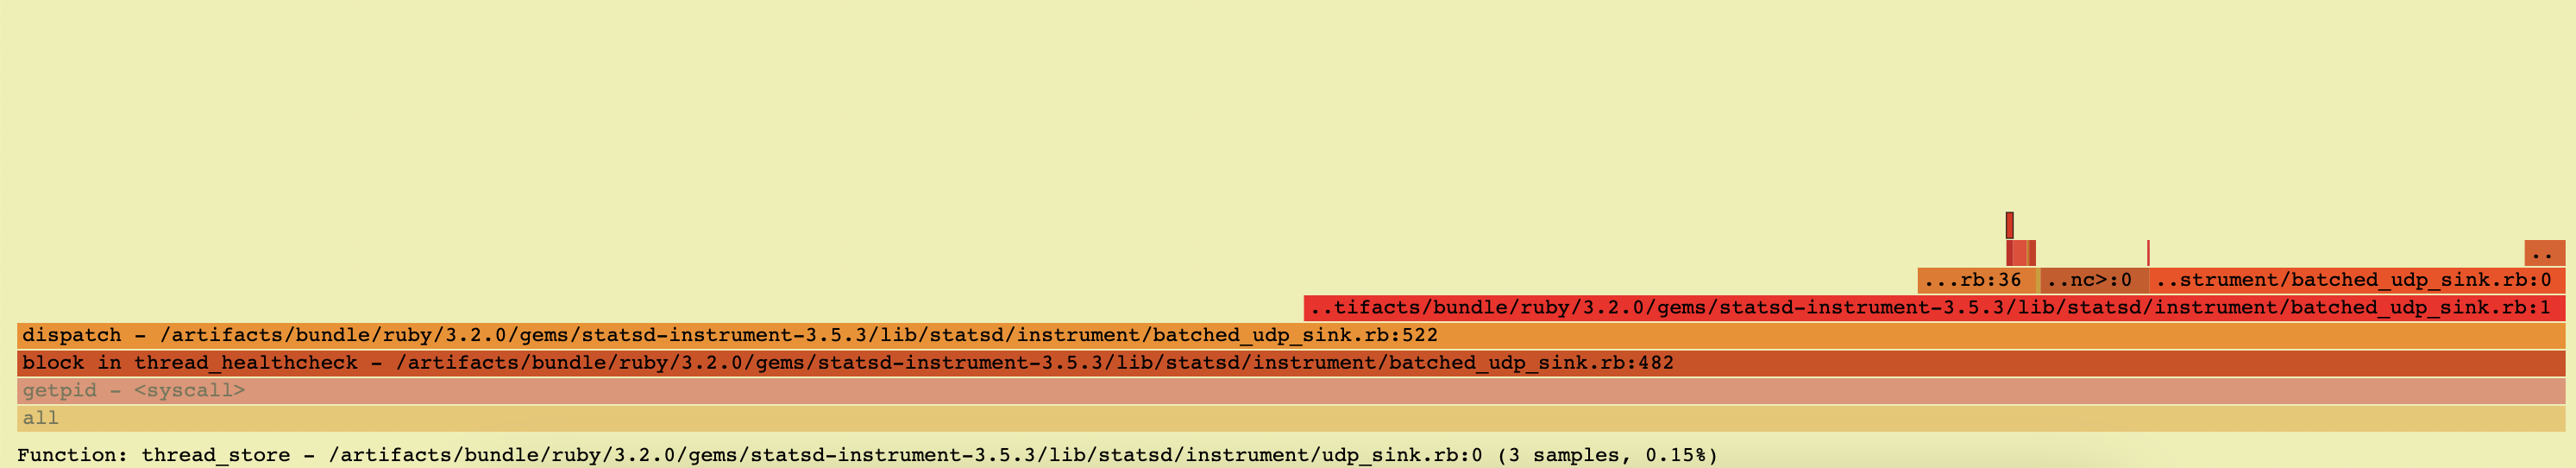
With the latest patches etc from #61 we are able to get some stack traces, but I don't think they are accurate:
This is from an open source repo, so we can look at the code and see that it doesn't look like Process.pid is being called from anywhere here:
https://github.com/Shopify/statsd-instrument/blob/master/lib/statsd/instrument/udp_sink.rb#L69
Also one of the wide bars here says it is in dispatch on line 522, but this file doesn't have 522 lines https://github.com/Shopify/statsd-instrument/blob/v3.5.3/lib/statsd/instrument/batched_udp_sink.rb (it has 183 lines).
I wonder if how rbperf collects stacks on syscalls is actually accurate?
I assume it is connecting a BPF probe to a tracepoint for entering/exiting the syscall, then it goes and grabs the ruby stack.
Could it be that it is grabbing the wrong thread somehow?
This is for a Unicorn worker, not Puma, but there are still some background threads happening. This batched udp sink is one of our top background threads, so I wonder if it is somehow being charged for another stack's getpid usage, just because it happens to be on CPU when the sample is taken?
Note that we also have https://github.com/shopify/pid_cache in place here, so any call to Process.pid should also be getting cached and not doing a syscall, I'd think the only viable culprits for getpid syscall should be:
- Things that bypass
Process.pid, such as ruby's$$ - Native extensions directly calling
getpidlibc function or directly making the syscall without libc

Thanks for opening the issue, there's a couple of things here:
Also one of the wide bars here says it is in dispatch on line 522, but this file doesn't have 522 lines ? https://github.com/Shopify/statsd-instrument/blob/v3.5.3/lib/statsd/instrument/batched_udp_sink.rb (it has 183 lines).
Line numbers aren't accurate on rbperf due to how they are implemented under the hood (commit where they were introduced). I think they can be made accurate but it'll take a bit of work
I assume it is connecting a BPF probe to a tracepoint for entering/exiting the syscall, then it goes and grabs the ruby stack.
That's how it works, yeah :)
I wonder if how rbperf collects stacks on syscalls is actually accurate?
Perhaps there is a bug in which stack we are fetching in multi-threaded applications. The way this currently is fetched is by traversing the internal structs like this: ruby_current_vm_ptr->ractor->main_thread->ractor->threads->running_ec.
The way this currently is fetched is by traversing the internal structs like this: ruby_current_vm_ptr->ractor->main_thread->ractor->threads->running_ec.
Yeah interesting, I wonder if this is guaranteed to be accurate when a syscall happens, I'll check with some ruby folks that are smarter than me, thanks!
Line numbers aren't accurate on rbperf due to how they are implemented under the hood (commit where they were introduced). I think they can be made accurate but it'll take a bit of work
Good to know thanks! I haven't looked into it much, but in theory it should be possible as I think rbspy does it accurately
Thanks, Dale!
I am confused about something. You mentioned that https://github.com/Shopify/statsd-instrument/blob/master/lib/statsd/instrument/udp_sink.rb doesn't call Process.pid, but the file I see in the profile is batched_udp_sink.rb

It seems that it does indeed call Process.pid https://github.com/Shopify/statsd-instrument/blob/master/lib/statsd/instrument/batched_udp_sink.rb#L151-L154, but the linenos are completely off as you mentioned. What am I missing? 😄
Yeah my bad, in the picture I posted it is a small sliver at the top:

It seems that it does indeed call Process.pid https://github.com/Shopify/statsd-instrument/blob/master/lib/statsd/instrument/batched_udp_sink.rb#L151-L154, but the linenos are completely off as you mentioned
And even within that file though, even though we see that it IS called from thread_healthcheck, the flamegraph is charging it to dispatch, which very clearly does not Process.pid directly.
Oh, I see now, that looks funky. My understanding of how Ruby threads are implemented is not very deep, but I assume that the whole stack will be replaced on a new thread being executed. If you can find a small case that reproduces this that would be ace!
If you can find a small case that reproduces this that would be ace!
Yeah i'll see if i can whip something up, thanks!
My understanding of how Ruby threads are implemented is not very deep, but I assume that the whole stack will be replaced on a new thread being executed.
Yeah i'm in the same boat. I would have thought that entering a syscall would cause the process to block and the state to be consistent when the BPF handler runs to take the snapshot, but it could be that this is naive?
Ok I checked with Aaron Patterson (thanks again if you see this!) and he was very helpful. The TL;DR though is:
I don't think I'd expect the trace to make sense
usually the VM will allow other threads to run when we're blocking on a syscall
In ruby's internals, if you see a rb_thread_io_blocking_region, then Ruby will let another thread run while the syscall is blocking, eg here. This releases the GVL, and lets other threads run. So, the method of checking the current thread is not an accurate representation of what actually initiated the syscall by any means.
This comment here has more info about how threading works
https://github.com/tenderlove/ruby/blob/ae9e1aee59b0db1e61aa0473556165f9fd719cde/thread.c#L1568 and other ways that the GVL might be released.
So, I think that rbperf's syscall profiling is only valid if you have exactly 1 thread right now. To verify this, a simple test program should only need to:
- Have two threads
- Thread A enters a blocking syscall repeatedly
- Thread B continues to do work uninterrupted and does no syscalls at all
I'd expect we will see both thread A and thread B in the profile, despite only expected to see Thread A, as sometimes the kernel might catch Thread A if the GVL hasn't been relinquished and thread B hasn't started yet, but I'd expect a fair amount of the time we see Thread B, when we should never see it.
Thanks so much for all the context, this is very useful. The profiles should always be correct, even in multithreaded applications, so this is definitely a bug

any call to
Process.pidshould also be getting cached and not doing a syscall
Any but the first one in a process. We only cache after the first call, and reset the cache after fork. So the very first getpid() you see for a given process is likely to be a false positive.
We only cache after the first call
Thanks for clarifying Jean, yes, we should see the call happen only once.
Anyways, I'll try and whip up a test program today that shows the issue of it collecting the wrong thread's stacks.
I think I was able to produce a test program to show the issue:
def a
  $stderr.puts "here" # do some work so it takes some CPU time
end

def b
  a
end

def c
  b
end

def x
  Process.pid
  Thread.pass
end

def y
  x
end

def z
  y
end


Thread.new { loop { z }  }
Thread.new { loop { c }  }.join
Note that I explicitly call Thread.pass to make it obvious that we are yielding execution to another thread, but at production scale this isn't necessary as the scheduler will handle swapping between the threads.
Started and called via:
ruby test.rb 2> /dev/null &
./rbperf record -p ${PID} -d 5 syscall enter_getpid
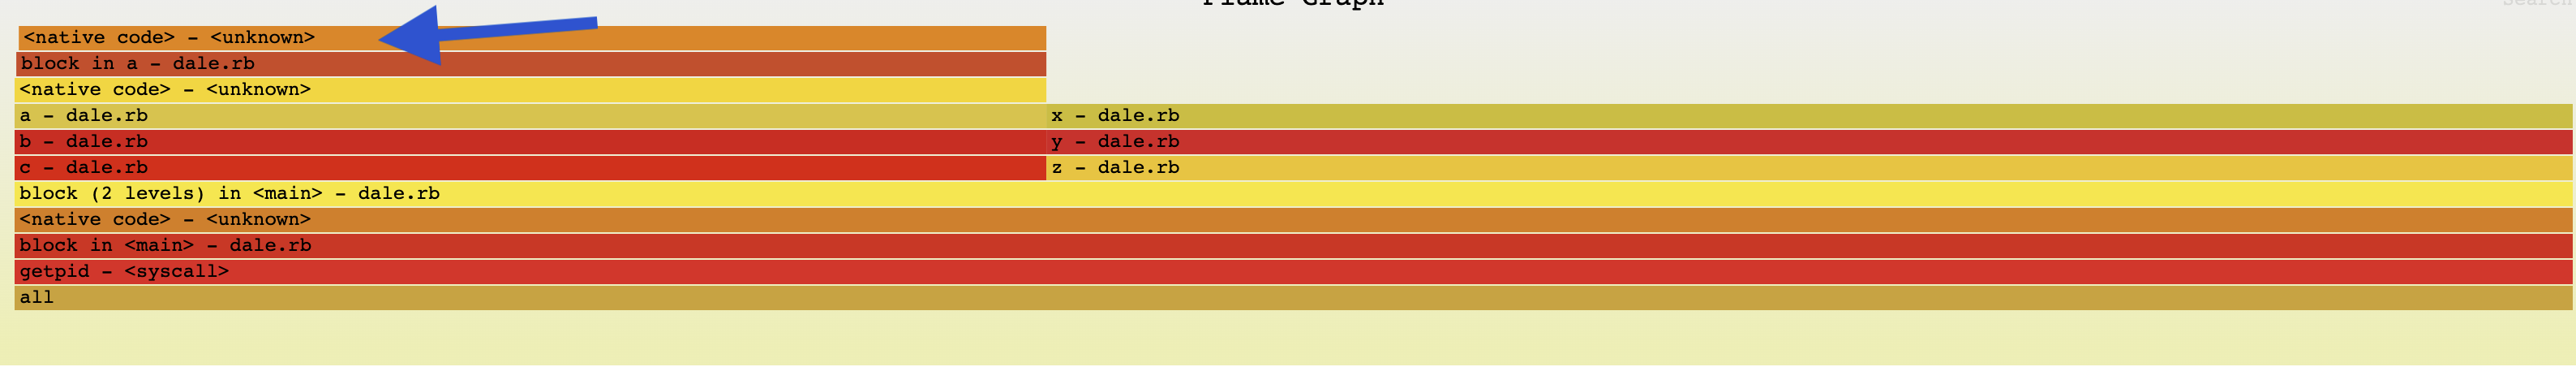
Here is the resulting flamegraph:

As you can see, we get frames a, b, c showing up as calling getpid, but clearly they never do. We should only see frames x, y, z. Because the VM is switching threads (here it is hinted / forced via Thread.pass, but that is happening after the syscall anyways, so clearly it isn't synchronous), we get the stack from the wrong thread when the BPF probe runs.
another thought, looking at the flame graphs - it seems counter-intuitive to see getpid on the bottom, when it is actually called from x, which is the top frame. I'd expect it to be the top frame, not the root / bottom frame.
Though how it is now is probably convenient for grouping, but that is more of a UI issue i guess.
I was thinking about how this racing problem might be solved this evening, and a couple of crazy ideas came to mind:
- Can we use a uprobe to intercept the libc syscall wrappers, so that we can snapshot what thread made the syscall?
- Would using the kernel
raw syscallhook help (are theenter_SYSCALL / exit_SYSCALLprobes too slow somehow?)- Doubt it, but worth a shot?
- Perhaps we can instrument elsewhere in the kernel, such as its syscall auditing faculty, in order to obtain the actual user TID at syscall time, as this comment alludes to. I know this isn't the same as the pthread ID, but I would imagine that they are a 1:1 mapping. If we can record this when the syscall actually happens, perhaps we can use it to map back to a ruby thread?
- Any other scheme of determining a mapping of thread ID / pthread / ruby thread when the syscall happens? Maybe there is another tracepoint that includes the user thread ID?
- Haven't found one yet
another thought, looking at the flame graphs - it seems counter-intuitive to see getpid on the bottom, when it is actually called from x, which is the top frame. I'd expect it to be the top frame, not the root / bottom frame.
Though how it is now is probably convenient for grouping, but that is more of a UI issue i guess.
I can see this being confusing. As you mentioned, it's a way to group stacks together, not sure if there's a more clear way. I have some patches to convert the Flame Graph to be an icicle by default, and I think that having the grouping on top might make more sense perhaps
Thanks so much for the repro! Just off the bat, there's something that concerns me and that leads me to believe that this is a bug in rbperf: the BPF program is executed right before getpid() starts running its 'body', that would be before calling Thread.pass, so I am unsure how Ruby could swap the stacks unless it has some hooks or wrapper around system calls.
Testing some hypothesis right now, will let you know what I find out
@dalehamel I've been thinking about this over the weekend, this is the brain dump of how I am debugging this and the current state of things. I will add some of these strategies as docs later this week.
I started with the assumption of a bug in rbperf:
- Double checked that reading the stack is correct, assuming that the execution context pointer is correct. Used
bpf_signalto stop the process execution (see code below), and verified that in GDB I saw the exact same unexpected stack. This seemed to be correct. - Perhaps the initial pointer is wrong?
Line 86 in a6b316e
Checking Ruby's sources seems that perhaps usingruby_current_ecis more correct, as it should have the currently executing execution context. Using it is a bit trickier than other variables, as it's a thread-local variable. Luckily I started looking into these for a different feature, and patchedrbperfto read the TLS variable, but the profiles still show the unexpected stack. This patch is still needed so will publish it later on (so far it only works with statically linked "librubies").
At this point, I was a bit confused. If we are reading the current execution context but the profile is still showing calls to getpid even in this tiny reproducer, perhaps it's worth tracing the native code calling getpid?
$ strace -f -p 30579 -k -o dale_repro_strace.txt
[...]
[pid 30592] <... getpid resumed>)       = 30579
 > /usr/lib64/libc.so.6(__getpid+0xb) [0xde69b]
 > /home/javierhonduco/.rbenv/versions/3.0.4/bin/ruby(ubf_timer_disarm+0x7c) [0x1ca3cc]
 > /home/javierhonduco/.rbenv/versions/3.0.4/bin/ruby(gvl_acquire_common+0xcf) [0x1cf88f]
 > /home/javierhonduco/.rbenv/versions/3.0.4/bin/ruby(rb_thread_io_blocking_region+0x250) [0x1d5e10]
 > /home/javierhonduco/.rbenv/versions/3.0.4/bin/ruby(io_fwritev+0x46c) [0x7a3fc]
 > /home/javierhonduco/.rbenv/versions/3.0.4/bin/ruby(io_writev+0x249) [0x7a889]
 > /home/javierhonduco/.rbenv/versions/3.0.4/bin/ruby(vm_call0_body+0x19d) [0x22136d]
 > /home/javierhonduco/.rbenv/versions/3.0.4/bin/ruby(rb_funcallv_scope+0x1bc) [0x22541c]
 > /home/javierhonduco/.rbenv/versions/3.0.4/bin/ruby(rb_io_puts+0x89) [0x77859]
 > /home/javierhonduco/.rbenv/versions/3.0.4/bin/ruby(vm_call_cfunc_with_frame+0x126) [0x217806]
 > /home/javierhonduco/.rbenv/versions/3.0.4/bin/ruby(vm_exec_core+0x14f) [0x229ecf]
 > /home/javierhonduco/.rbenv/versions/3.0.4/bin/ruby(rb_vm_exec+0x166) [0x21a996]
 > /home/javierhonduco/.rbenv/versions/3.0.4/bin/ruby(loop_i+0x278) [0x21e958]
Another thread is calling getpid() at times: https://github.com/ruby/ruby/blob/0aa50a03b1ea8d37069ae57c469f43860abbcf05/thread_pthread.c#L1984
Seems like perhaps a useful feature here would be to gather the native stack trace in addition to Ruby's. This is something I have thought of adding in the past, but as you are aware is pretty complicated to get right for everyone: e.g. symbols being present, ideally, we would only have to support Ruby+extensions compiled with frame pointers, etc.
Just to summarise, the broken stacks were caused due to:
- Fetch the execution context from
ruby_current_ec, which is the current ec, for this, we'll have to read TLS variables; - Some internal scheduling code calls
getpid();
Hope this makes sense, let me know what you think!
SIGSTOP on an unexpected stack
+++ b/src/bpf/rbperf.bpf.c
@@@ -198,6 -198,6 +198,11 @@@ read_frame(u64 pc, u64 body, RubyFrame
                       sizeof(current_frame->method_name));

      LOG("[debug] method name=%s", current_frame->method_name);
++    if (current_frame->method_name[0] == 'a') {
++        int sig_err = 0;
++        sig_err = bpf_send_signal_thread(19);
++        bpf_printk("error, should not be a %d", sig_err);
++    }
}Forgot to mention that this would explain why there's no <native code> frame above x, as their native frame is only inserted for natively implemented functions that are exposed in the runtime, rather than any other interpreter's functions that aren't
Also changed the reproducer to:
  def x
-    Process.pid
+    File.open("/")
    Thread.pass
  end
$ cargo build && sudo target/debug/rbperf record -p `pidof ruby` -d2 syscall enter_openat
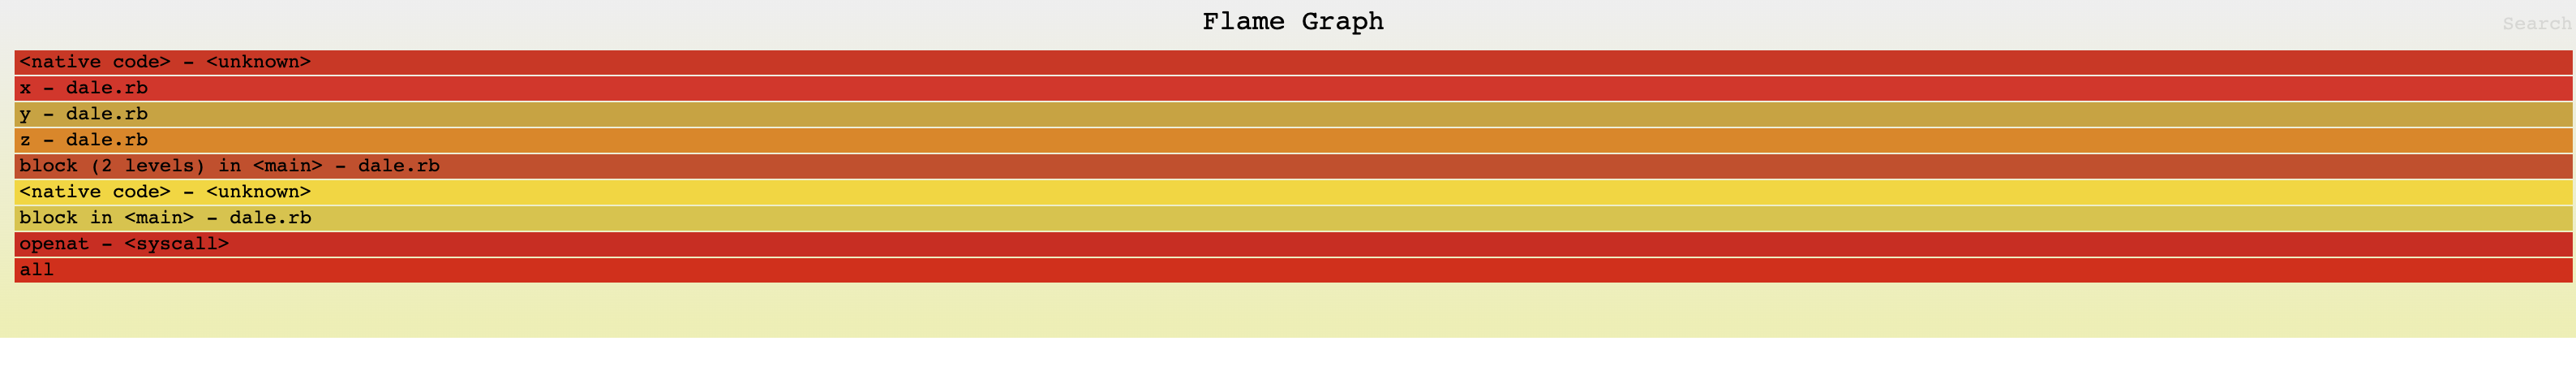
to confirm that the profile is correct with the WIP TLS changes.
@javierhonduco great debugging on this - i hadn't considered that the ruby VM itself could be part of the culprit calling getpid 👍
Good points on the native frames - they would be very useful to grab if we could. I know you have some very interesting work in Parca that is able to load the necessary information from DWARF into a BPF map to do the native unwinding during the BPF handler. Perhaps we could do something similar if:
- rbperf has access to a
debuginfodservice and - It is able to find the necessary symbol file for the build ID it detects.
Perhaps before starting profiling, rbperf could walk the ruby memory map and collect build ids, to give the BPF code a shot at doing native unwinding. If it isn't able to, perhaps it can fallback to frame pointer-based unwinding, or simply just show the top frame and indicate the stack is truncated.
I'm thinking aloud here, but really the issue is ensuring the callchain is accurate - we can symbolize after the fact as long as we have the callchains and the necessary mapping info, as I'm sure you know.
I am not super familiar with perf trace but I gave it a go (a recent version of bpftrace can probably handle this too, but I need to update our deps). For some reason, strace wasn't giving me full stacks (maybe because I was tracing a process in a container?), so I decided to try perf.
Anyways I meant to capture only the stacks that enter the getpid syscall with the following:
perf trace record -p ${TARGET_PID} -e syscalls:sys_enter_getpid --call-graph=dwarf -- sleep 5
That spits out an enormous recording which I assume contains segments of the raw stacks. On the same machine, I can unwind it now by giving it as an input file to perf trace:
perf trace -i perf.data -e syscalls:sys_enter_getpid --call-graph dwarf -p ${TARGET_PID}
For whatever reason, this is showing me ALL syscalls it seems, but getpid is frequent enough that it is no issue to locate the stacks. Here is an example matching the one you found, called from ubf_timer_disarm::
                                       __traceiter_sys_exit ([kernel.kallsyms])
                                       __traceiter_sys_exit ([kernel.kallsyms])
                                       syscall_exit_to_user_mode ([kernel.kallsyms])
                                       entry_SYSCALL_64_after_hwframe ([kernel.kallsyms])
                                       __getpid (/usr/lib/x86_64-linux-gnu/libc-2.31.so)
                                       ubf_timer_disarm (/usr/local/ruby/bin/ruby)
                                       thread_sched_to_running_common (/usr/local/ruby/bin/ruby)
                                       rb_thread_schedule_limits (/usr/local/ruby/bin/ruby)
                                       rb_threadptr_execute_interrupts.part.0 (/usr/local/ruby/bin/ruby)
                                       vm_call0_body (/usr/local/ruby/bin/ruby)
                                       rb_vm_call0 (/usr/local/ruby/bin/ruby)
                                       rb_check_funcall_basic_kw (/usr/local/ruby/bin/ruby)
                                       obj_any_hash (/usr/local/ruby/bin/ruby)
                                       rb_any_hash (/usr/local/ruby/bin/ruby)
                                       rb_st_lookup (/usr/local/ruby/bin/ruby)
                                       rb_hash_dig (/usr/local/ruby/bin/ruby)
Note that the lower frames can vary, depending on what the VM happens to be doing at the time I suppose:
                                       __traceiter_sys_exit ([kernel.kallsyms])
                                       __traceiter_sys_exit ([kernel.kallsyms])
                                       syscall_exit_to_user_mode ([kernel.kallsyms])
                                       entry_SYSCALL_64_after_hwframe ([kernel.kallsyms])
                                       __getpid (/usr/lib/x86_64-linux-gnu/libc-2.31.so)
                                       ubf_timer_disarm (/usr/local/ruby/bin/ruby)
                                       thread_sched_to_running_common (/usr/local/ruby/bin/ruby)
                                       rb_thread_schedule_limits (/usr/local/ruby/bin/ruby)
                                       rb_threadptr_execute_interrupts.part.0 (/usr/local/ruby/bin/ruby)
                                       vm_exec_core (/usr/local/ruby/bin/ruby)
                                       rb_vm_exec (/usr/local/ruby/bin/ruby)
                                       rb_yield (/usr/local/ruby/bin/ruby)
                                       rb_ary_collect_bang (/usr/local/ruby/bin/ruby)
                                       vm_call_cfunc_with_frame (/usr/local/ruby/bin/ruby)
                                       vm_exec_core (/usr/local/ruby/bin/ruby)
                                       rb_vm_exec (/usr/local/ruby/bin/ruby)
                                       rb_vm_invoke_proc (/usr/local/ruby/bin/ruby)
Or
                                       __traceiter_sys_exit ([kernel.kallsyms])
                                       __traceiter_sys_exit ([kernel.kallsyms])
                                       syscall_exit_to_user_mode ([kernel.kallsyms])
                                       entry_SYSCALL_64_after_hwframe ([kernel.kallsyms])
                                       __getpid (/usr/lib/x86_64-linux-gnu/libc-2.31.so)
                                       ubf_timer_disarm (/usr/local/ruby/bin/ruby)
                                       rb_thread_wait_for_single_fd (/usr/local/ruby/bin/ruby)
                                       rb_io_wait.part.0 (/usr/local/ruby/bin/ruby)
                                       io_wait_readable (/usr/local/ruby/bin/ruby)
And this one, which @casperisfine has a PR open on Ruby for:
                                       __traceiter_sys_exit ([kernel.kallsyms])
                                       __traceiter_sys_exit ([kernel.kallsyms])
                                       syscall_exit_to_user_mode ([kernel.kallsyms])
                                       entry_SYSCALL_64_after_hwframe ([kernel.kallsyms])
                                       __getpid (/usr/lib/x86_64-linux-gnu/libc-2.31.so)
                                       proc_get_pid (/usr/local/ruby/bin/ruby)
The call within ubf_timer_disarm seems to be the most frequent anyways, which I guess is to be expected if it is in the threading code.
@javierhonduco in an earlier message you said:
Perhaps there is a bug in which stack we are fetching in multi-threaded applications. The way this currently is fetched is by traversing the internal structs like this: ruby_current_vm_ptr->ractor->main_thread->ractor->threads->running_ec.
And then later mentioned a method of getting the correct handle to this:
Checking Ruby's sources seems that perhaps using ruby_current_ec is more correct, as it should have the currently executing execution context. Using it is a bit trickier than other variables, as it's a thread-local variable. Luckily I started looking into these for a different feature, and patched rbperf to read the TLS variable, but the profiles still show the unexpected stack.
This patch is still needed so will publish it later on (so far it only works with statically linked "librubies").
I'm curious about that limitation, is it just because static was easier to prototype on, like simpler for calculating relocation offsets, or is there another issue with reading the thread local variables that makes a static libruby a firm requirement?
Just to summarise, the broken stacks were caused due to...
Fetch the execution context from ruby_current_ec, which is the current ec, for this, we'll have to read TLS variables;
I am kind of curious if the issue wasn't 100% just that I didn't realize that the other thread running could be getting charged a getpid call for code in the Ruby VM itself! I haven't spun up a test machine yet, but I'll try and change my syscall to one I'm 100% sure isn't in the VM itself, and that I don't see in native traces.
Seems like perhaps a useful feature here would be to gather the native stack trace in addition to Ruby's.
That would be incredible - being able to see the "whole picture" could be a game changer for debugging. I think BPF could be a good use case for it too, as a cheap way to collect the call chains and submit them to userspace to be symbolized out-of-band.
I've been mulling over for a while how to handle mixed / interleaved stack traces between C in the VM itself and its extensions, and the stacks for the Ruby language itself. I'm curious what your thoughts are on this - how can Ruby and native stacks be most easily "stitched" together?
The way that perf seems to handle this for transitions from user to kernel space, is by inserting a special pseudo-frame in the callchains it unwinds to denote this, and it's so it is easy and intuitive to follow the userspace code going it a syscall, and then the kernel stack which services it. So in this case, it is easy to "stitch" the stacks together.
How do we achieve this for Ruby? When we hit a native frame, do we just switch unwinding strategies? What weird cases like when C extensions call Ruby? Very curious what you think a good strategy would be to handle this.
Sorry for the delay, I was on holiday the past few days and didn't check my computer. Will reply to everything in ~3 days
gentle ping @javierhonduco :) hope you had a restful holiday
Sorry for taking so long, Dale, and thanks :)
Having native code in the Ruby profiles would be great. It's something I would love rbperf to have, so we could not only get the Ruby stack but also the interpreter native stack. It can definitely be done, but I expect this to take ~3 months to implement both the unwinding + symbolization for native frames, which I am not sure I can commit to anytime soon.
That spits out an enormous recording which I assume contains segments of the raw stacks.
Yes, the process stack is copied for every single sample, which can be quite a bit of data being copied from kernel to userspace and then to disk. That's one of the main reasons why I worked on doing the unwinding in kernel space with DWARF information – the overhead (and security implications) of copying the stack can be prohibitive.
For whatever reason, this is showing me ALL syscalls it seems
Uh, oh! Looks like a bug. Glad that you could reproduce the issue with getpid though!
I'm curious about that limitation, is it just because static was easier to prototype on, like simpler for calculating relocation offsets, or is there another issue with reading the thread local variables that makes a static libruby a firm requirement?
My knowledge of TLS internals is quite limited so far, it happened to be enough to deal with statically linked libruby. Have to read way more about it, how it's implemented it's fascinating and pretty complex.
I am kind of curious if the issue wasn't 100% just that I didn't realize that the other thread running could be getting charged a getpid call for code in the Ruby VM itself! I haven't spun up a test machine yet, but I'll try and change my syscall to one I'm 100% sure isn't in the VM itself, and that I don't see in native traces.
Sounds good! Let me know 😄 .
I've been mulling over for a while how to handle mixed / interleaved stack traces between C in the VM itself and its extensions, and the stacks for the Ruby language itself. I'm curious what your thoughts are on this - how can Ruby and native stacks be most easily "stitched" together?
Been thinking quite a bit about this as well and I think that perhaps a reasonable approach would be to have a hardcoded list of "insertion" points for the stitching. For example, the symbolizer could insert the Ruby stack after the C function that runs a VM instruction vm_exec_core or whatever it is.
I am not sure how to stitch native stacks due to extensions (so CRuby native stacks => Ruby stack => Native extension stack), but I think it makes sense to append it after the last Ruby frame. We know when we hit a native frame here.
Let me know if you have any other approaches in mind, but I think most involve the symbolizer (or a component around the symbolizer) doing things typically out of the scope of symbolizers 😄
I don't think this is a bug in rbperf itself, but rather was a nuance of ruby's internal usage of syscalls. Closing.
Coolio! Thanks for opening the issue anyways. I just double-checked that the CPU profiles for your repro are correct!