vscode-jest
Content
- vscode-jest
The Aim
A comprehensive experience when using Facebook's Jest within a project.
- Useful IDE based Feedback
- Session based test watching
Maintainers
Orta Therox (@orta), Vincent Voyer (@vvo) & ConnectDotz (@connectdotz).
Features
- Starts Jest automatically when you're in a root folder project with Jest installed.
- Show individual fail / passes inline.
- Show fails inside the problem inspector.
- Highlights the errors next to the
expectfunctions. - Adds syntax highlighting to snapshot files.
- A one button update for failed snapshots.
- Show coverage information in files being tested.
- Help debug jest tests in vscode.
How to get it?
Simply open Jest - Visual Studio Marketplace and click "Install". Alternatively open Visual Studio Code, go to the extension view and search for "Jest".
For detailed releases and migration help, please see releases.
How to get it set up?
This extension runs on top of your Jest installation. Upon starting, it has the expectation that the Jest environment is properly set up, i.e. jest can be executed in VS Code's terminal.
Out of the box, this extension should work for most simple/standard jest and react projects. However, if you have a more sophisticated project or custom jest command, the default configuration most likely won't be sufficient but you can easily customize it with various settings*, such as jest.pathToJest where you can specify how you usually run your jest tests.
If you encountered any difficulty or have suggestions, please do not hesitate to ask, we have an active community that you might find helpful.
*: all settings in this extension are prefixed with jest
How to start Jest?
The extension will start Jest for you when:
- we find Jest configuration files in the workspace:
jest.config.jsorjest.json - we find Jest installed in the workspace:
node_modules/.bin/jest - we find the workspace has been bootstrapped with create-react-app:
node_modules/react-scripts/node_modules/.bin/jestnode_modules/react-native-scripts
- you run the Jest: Start Runner command
How do I debug tests?
The simplest use cases should be supported out-of-the-box, but at the latest when VS Code displays errors about the attribute program or runtimeExecutable not being available, you have to create your own debug configuration within launch.json.
This plugin provides blueprints for debugging plain Jest setups or projects bootstrapped by create-react-app. (In the latter case you may have to edit the runtimeExecutable to reflect the used react-scripts package.) If those don't match your setup, you can modify the blueprints or create a completely new debug configuration, but keep in mind, that the type has to be node and that the configuration has to be named "vscode-jest-tests". In order to learn more about debug/launch configurations in general, visit VS Code Docs: Debugging.
Starting with debugging is possible by clicking on the debug CodeLense above appendant it tests, but you can also debug all tests at once by starting debugging of "vscode-jest-tests" within the VS Code Debug Side Bar.
Notes for troubleshooting
In contrast to previous versions of this plugin the debug settings are now independent from VS Code's jest.pathToJest and jest.pathToConfig setting. If you had to modify one of these, you pretty surely have to create a custom debug configuration and modify its path. This especially includes cases, in which jest isn't at its default location.
Coverage
How do I show code coverage?
Starting from v3.1, code coverage can be easily turned on/off at runtime without customization.
To toggle the coverage mode: go to Command Palette and select Jest: Toggle Coverage Overlay command. (TODO: toggle from StatusBar, PR welcome)
The coverage mode, along with watch mode, are shown in StatusBar:
(The initial coverage mode is off but can be changed by adding "jest.showCoverageOnLoad": true in settings.)
How to customize coverage overlay
Coverage overlay determines how the coverage info is shown to users. This extension provides 2 customization points:
- coverage style via
jest.coverageFormatter - the coverage color scheme via
jest.coverageColors.
Coverage Style
Use jest.coverageFormatter to choose from the following, for example "jest.coverageFormatter": "GutterFormatter".
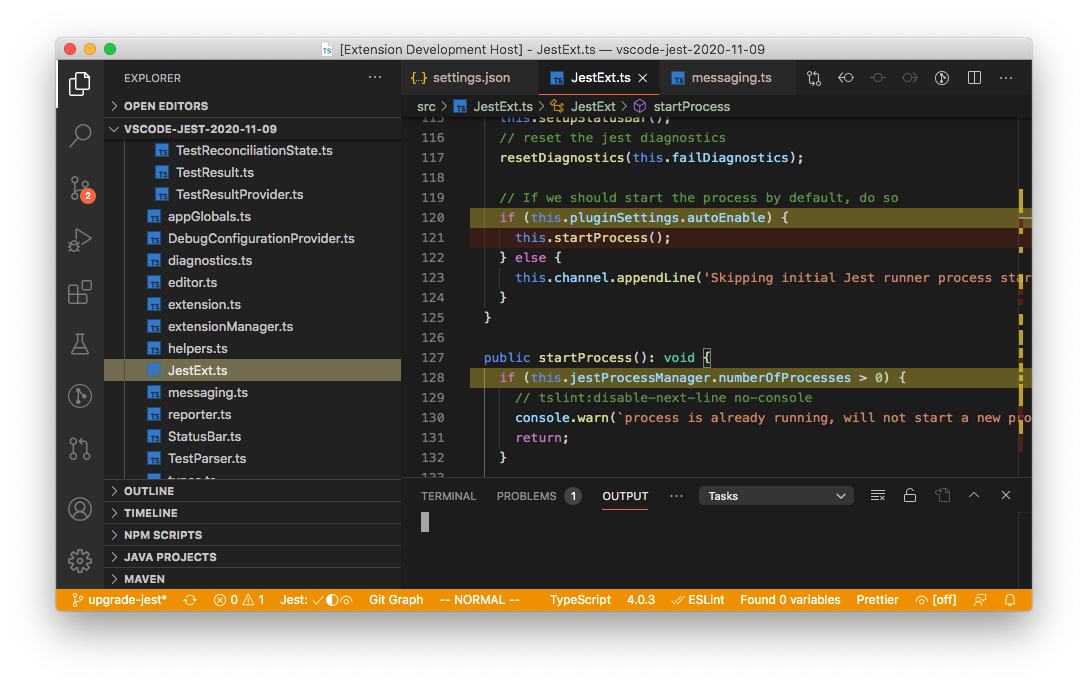
- DefaultFormatter: high light uncovered and partially-covered code inlilne as well as on the right overview ruler. (this is the default)

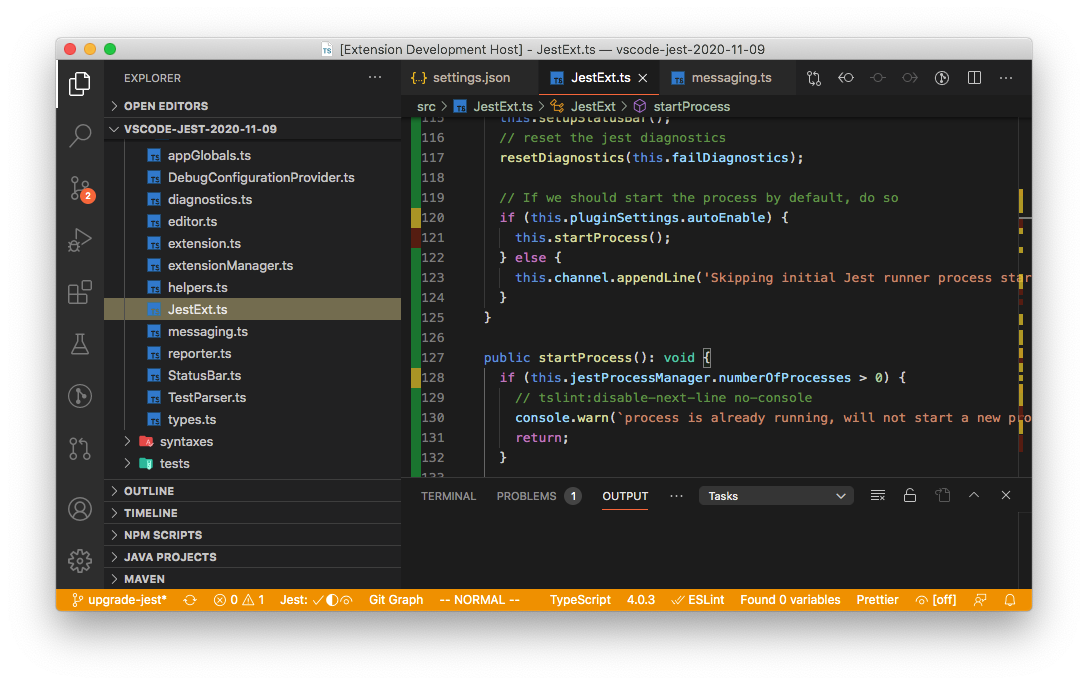
- GutterFormatter: render coverage status in the gutter as well as the overview ruler.
(Note, there is an known issue in vscode (microsoft/vscode#5923) that gutter decorators could interfere with debug breakpoints visibility. Therefore, you probably want to disable coverage before debugging or switch to DefaultFormatter)
Coverage Colors
Besides the formatter, user can also customize the color via jest.coverageColors to change color for 3 coverage categories: "uncovered", "covered", or "partially-covered", for example:
  "jest.coverageColors": {
    "uncovered": "rgba(255,99,71, 0.2)",
    "partially-covered": "rgba(255,215,0, 0.2)",
  }
the default color scheme below, note the opacity might differ per formatter:
"jest.coverageColors": {
    "covered": "rgba(9, 156, 65, 0.4)",
    "uncovered": "rgba(121, 31, 10, 0.4)",
    "partially-covered": "rgba(235, 198, 52, 0.4)",
  }
Understand the coverage overlay
Depends on the formatter you choose, there are 3 types of coverage you might see in your source code, distinguished by colors:
- "covered": if the code is covered. Marked as "green" by default.
- "not-covered": if the code is not covered. Marked as "red" by default.
- "partially-covered": Usually this mean the branch (such as if, switch statements) only partially tested. Marked as "yellow" by default.
- Please note, istanbuljs (the library jest used to generate coverage info) reports switch branch coverage with the first "case" statement instead of the "switch" statement.
Inspiration
I'd like to give a shout out to Wallaby.js, which is a significantly more comprehensive and covers a lot more editors, if this extension interests you - check out that too.
Troubleshooting
start jest from non-root folder
If you don't use the root of your project for your JS with Jest tests, do not worry, you can still use this project. You will need to use the "Jest: Start Runner" command, and maybe have to configure your own jest.pathToJest setting inside the .vscode/settings.json to whatever you would use.
These are the activation events which trigger the runner to start:
  "activationEvents": [
    "workspaceContains:node_modules/.bin/jest",
    "workspaceContains:node_modules/react-scripts/node_modules/.bin/jest",
    "workspaceContains:node_modules/react-native-scripts",
    "onCommand:io.orta.jest.start"
  ],
These are the things that will trigger the extension loading. If one of these applies, and you're not seeing the "Jest" in the bottom bar, reference the self-diagnosis below
use extension in multiroot environment
vscode-jest supports multiroot feature, but if you want to turn it off for some workspace folders check out jest.disabledWorkspaceFolders configuration setting.
jest.disabledWorkspaceFolders is an array of strings with folder names.
non-standard environments
vscode-jest supports common jest configuration, such as when jest is in root/node_modules/.bin/jest, or for react-native root/node_modules/react-native-scripts.
However, if your repo doesn't fall into these patterns or you want to pass extra parameters, you can easily use the jest.pathToJest or jest.pathToConfig settings to instruct the plugin on how to start jest. You can even use the scripts from package.json, such as npm run test -- or yarn test. Feel free to experiment and search the issues for many examples.
plugin not running as expect? try self-diagnosis
If your can execute jest tests on command line but vscode-jest was not running as expected, here is what you can do to find out what it is actually doing:
- click on
Jest:stoppedon status bar to show Jest Output window:
- turn on the debug mode: set
"jest.debugMode": truein.vscode/settings.json - restart vscode-jest or reload the window (via
Reload Windowcommand) - open the developer tool (via
Help > Toggle Developer Toolsmenu), you should see more information including how we extract jest config and spawn jest processes.
Hopefully most issues would be pretty obvious after seeing these extra output, and you can probably fix most yourself by customizing the jest.pathToJest and other settings.
Want to Contribute?
Thanks for considering! Check here for useful tips and guidelines.
License
vscode-jest is MIT licensed.


