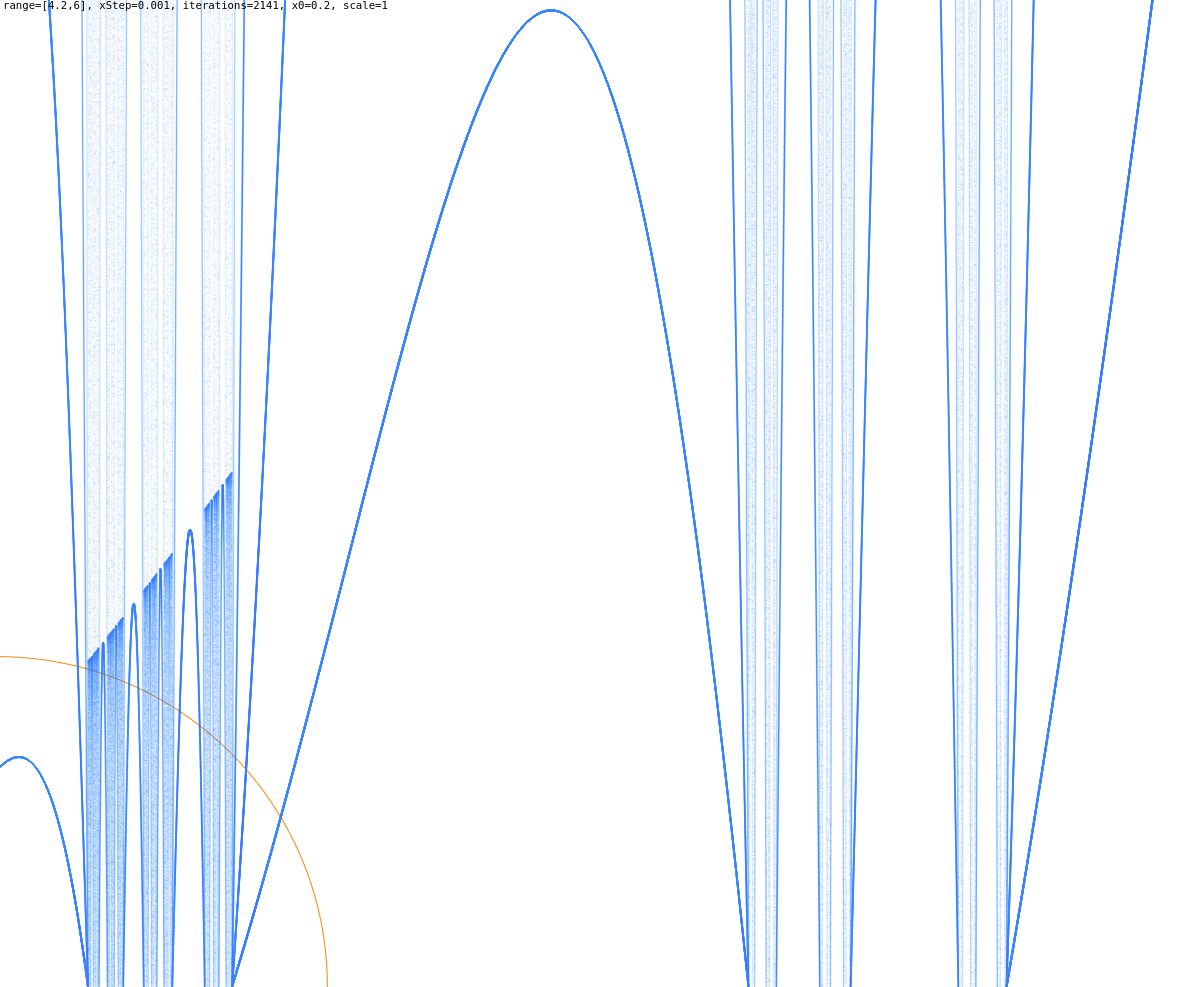
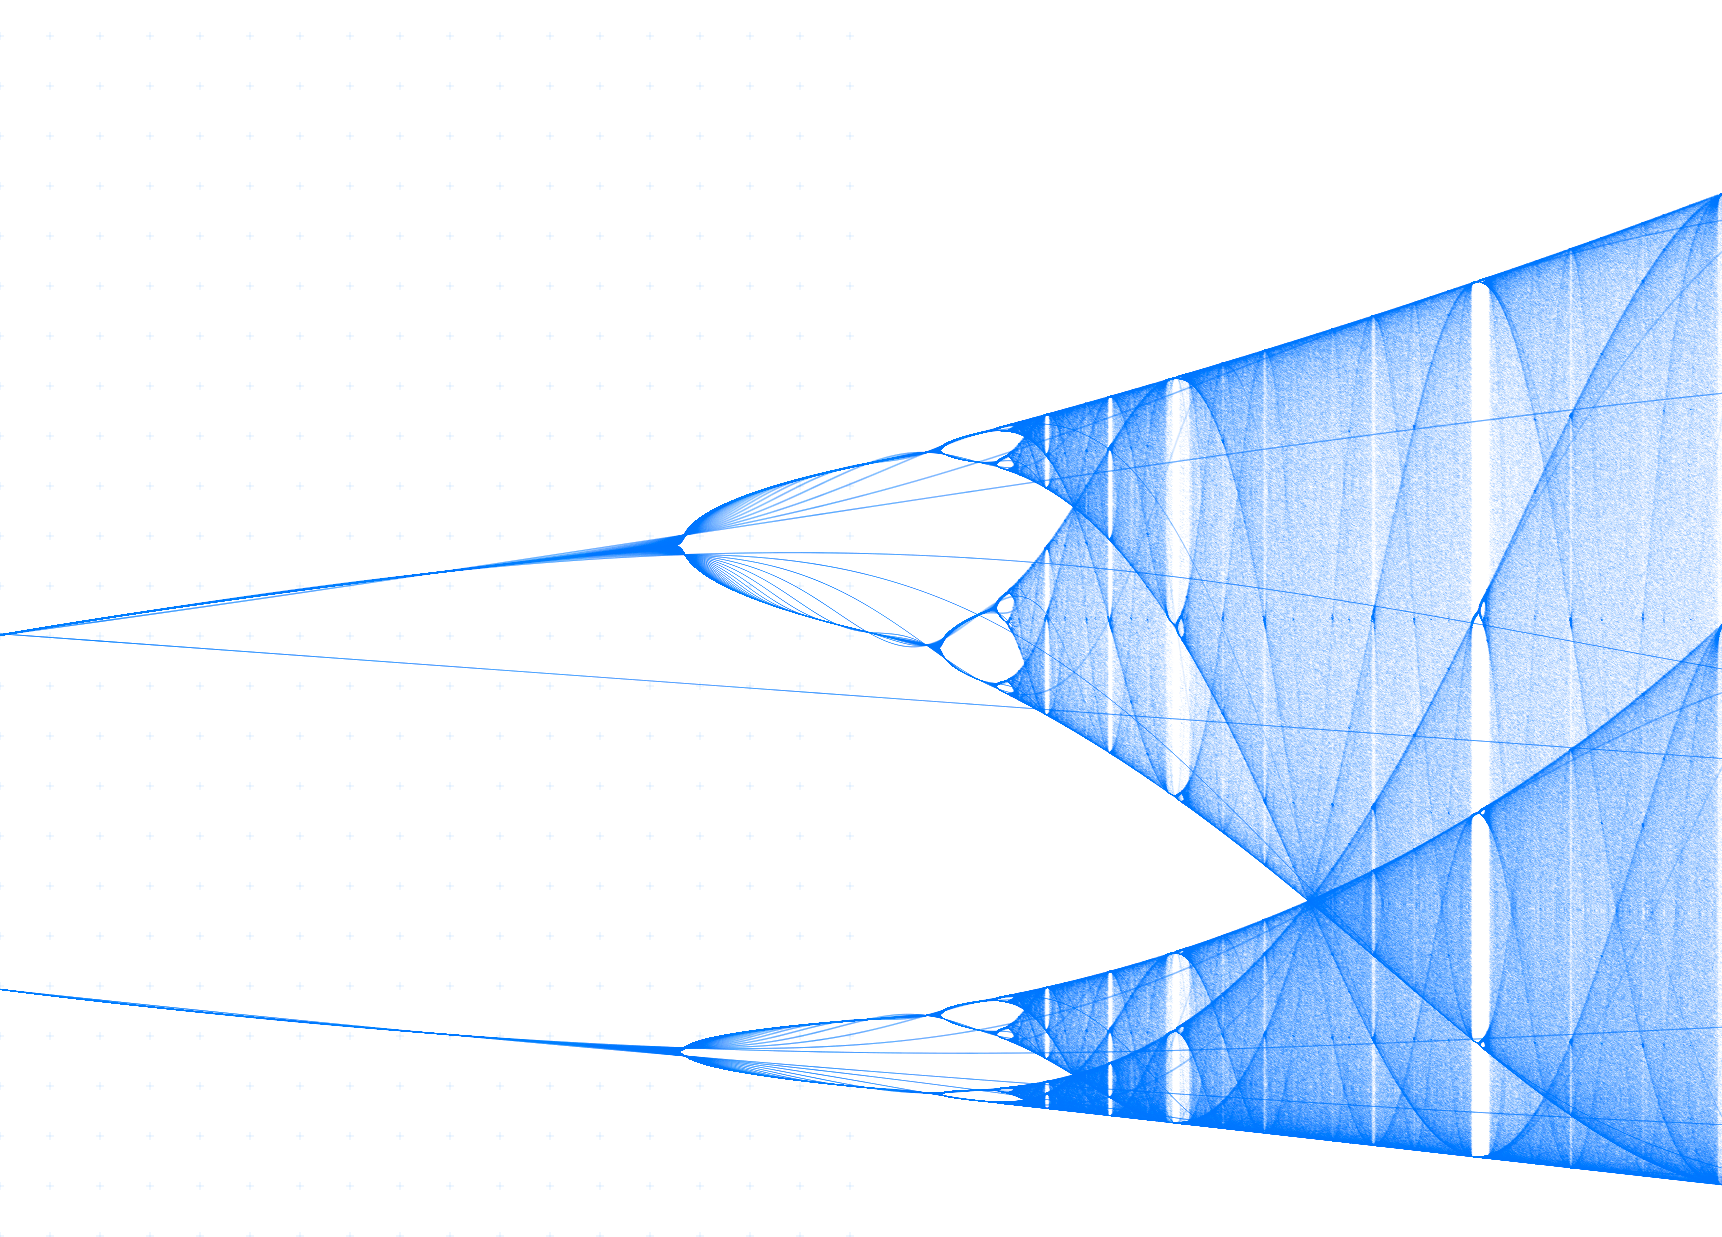
The logistic map
when plotted gives a peek into deterministic chaos. Whilst lambda resides inside the range ~[0..3.2] everthing seems fine and the recursive definition of the function gives (more or less) convergent series, the situation changes for values beyond ~3.2, and for values larger than 3.6 the result becomes (pseudo) chaotic, als the number of accumulation points increases.
Numberphile postet a really nice video about this function/map and the two Feigenbaum constants ... for those who are new to this topic: https://www.youtube.com/watch?v=ETrYE4MdoLQ
First attempt to visualize a fraction of the feigenbaum diagram

Feigenbaum bifurcation (logistic map)

Closer look into a bifurcation point near [3.563,3.6]
![Closer look into a bifurcation point near [3.563,3.6] Plotting the Feigenbaum bifurcation](https://raw.githubusercontent.com/IkarosKappler/feigenbaum-plot/master/screenshots/screenshot-20181219_0-excerpt.png)
Zoom in a little bit more into [3.563,3.6]
![Zoom in a little bit more into [3.563,3.6] Plotting the Feigenbaum bifurcation](https://raw.githubusercontent.com/IkarosKappler/feigenbaum-plot/master/screenshots/screenshot-20181219_10_excerpt.png)
I made a high resultion plot (13776x924 pixels) which took my machine about an hour to compute.
This file is about 40MB large:
- plot range [3.2 to 3.83]
- 500 iterations per sample
- sample size 0.1 (10 samples per pixel, makes 137.760 samples for lambda)
- plot (y axis) is scaled up from [0,1]
- x(0) is 0.2 (this value does not seem to have any affect at all after some iterations)
Find a live demo here (better have a quick machine)
- 2018-12-30
- Added a rectangular selector tool (to select sub plot areas).
- 2018-12-29
- y was plotted inverted.
- 2018-12-28
- Removed the 'plotScale' param (in favour of 'normalizeToMin' and 'normalizeToMax').
- Added the balanced binary tree collection to increase performance.
- 2018-12-22
- Added some equations.
- 2018-12-11
- Replaced the plotting engine by the PlotBoilerplate.
- Calculated the first hi-res plot <3
- 2018-10-23
- Init
Dependencies
- HTML5 Canvas
- HTML5 WebGL
- PlotBoilerplate.js
- Pavel Holoborodko fot the QuickLATEX tool for rendering equations https://www.quicklatex.com/
