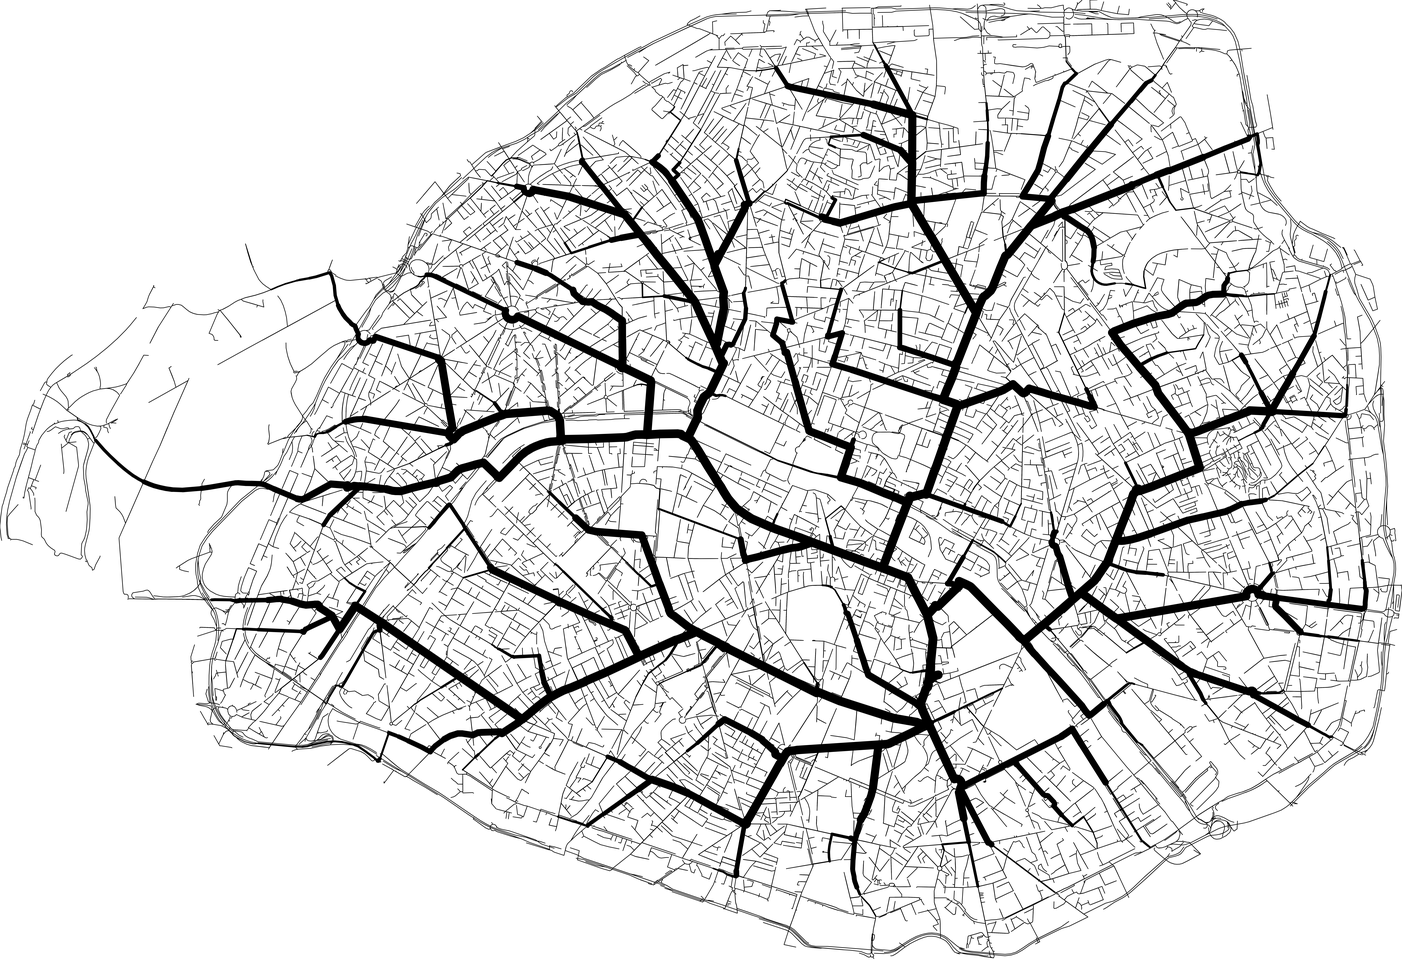
- All roads lead to my home (at least in Paris) [HD 14016x9599 / 7.3MB]
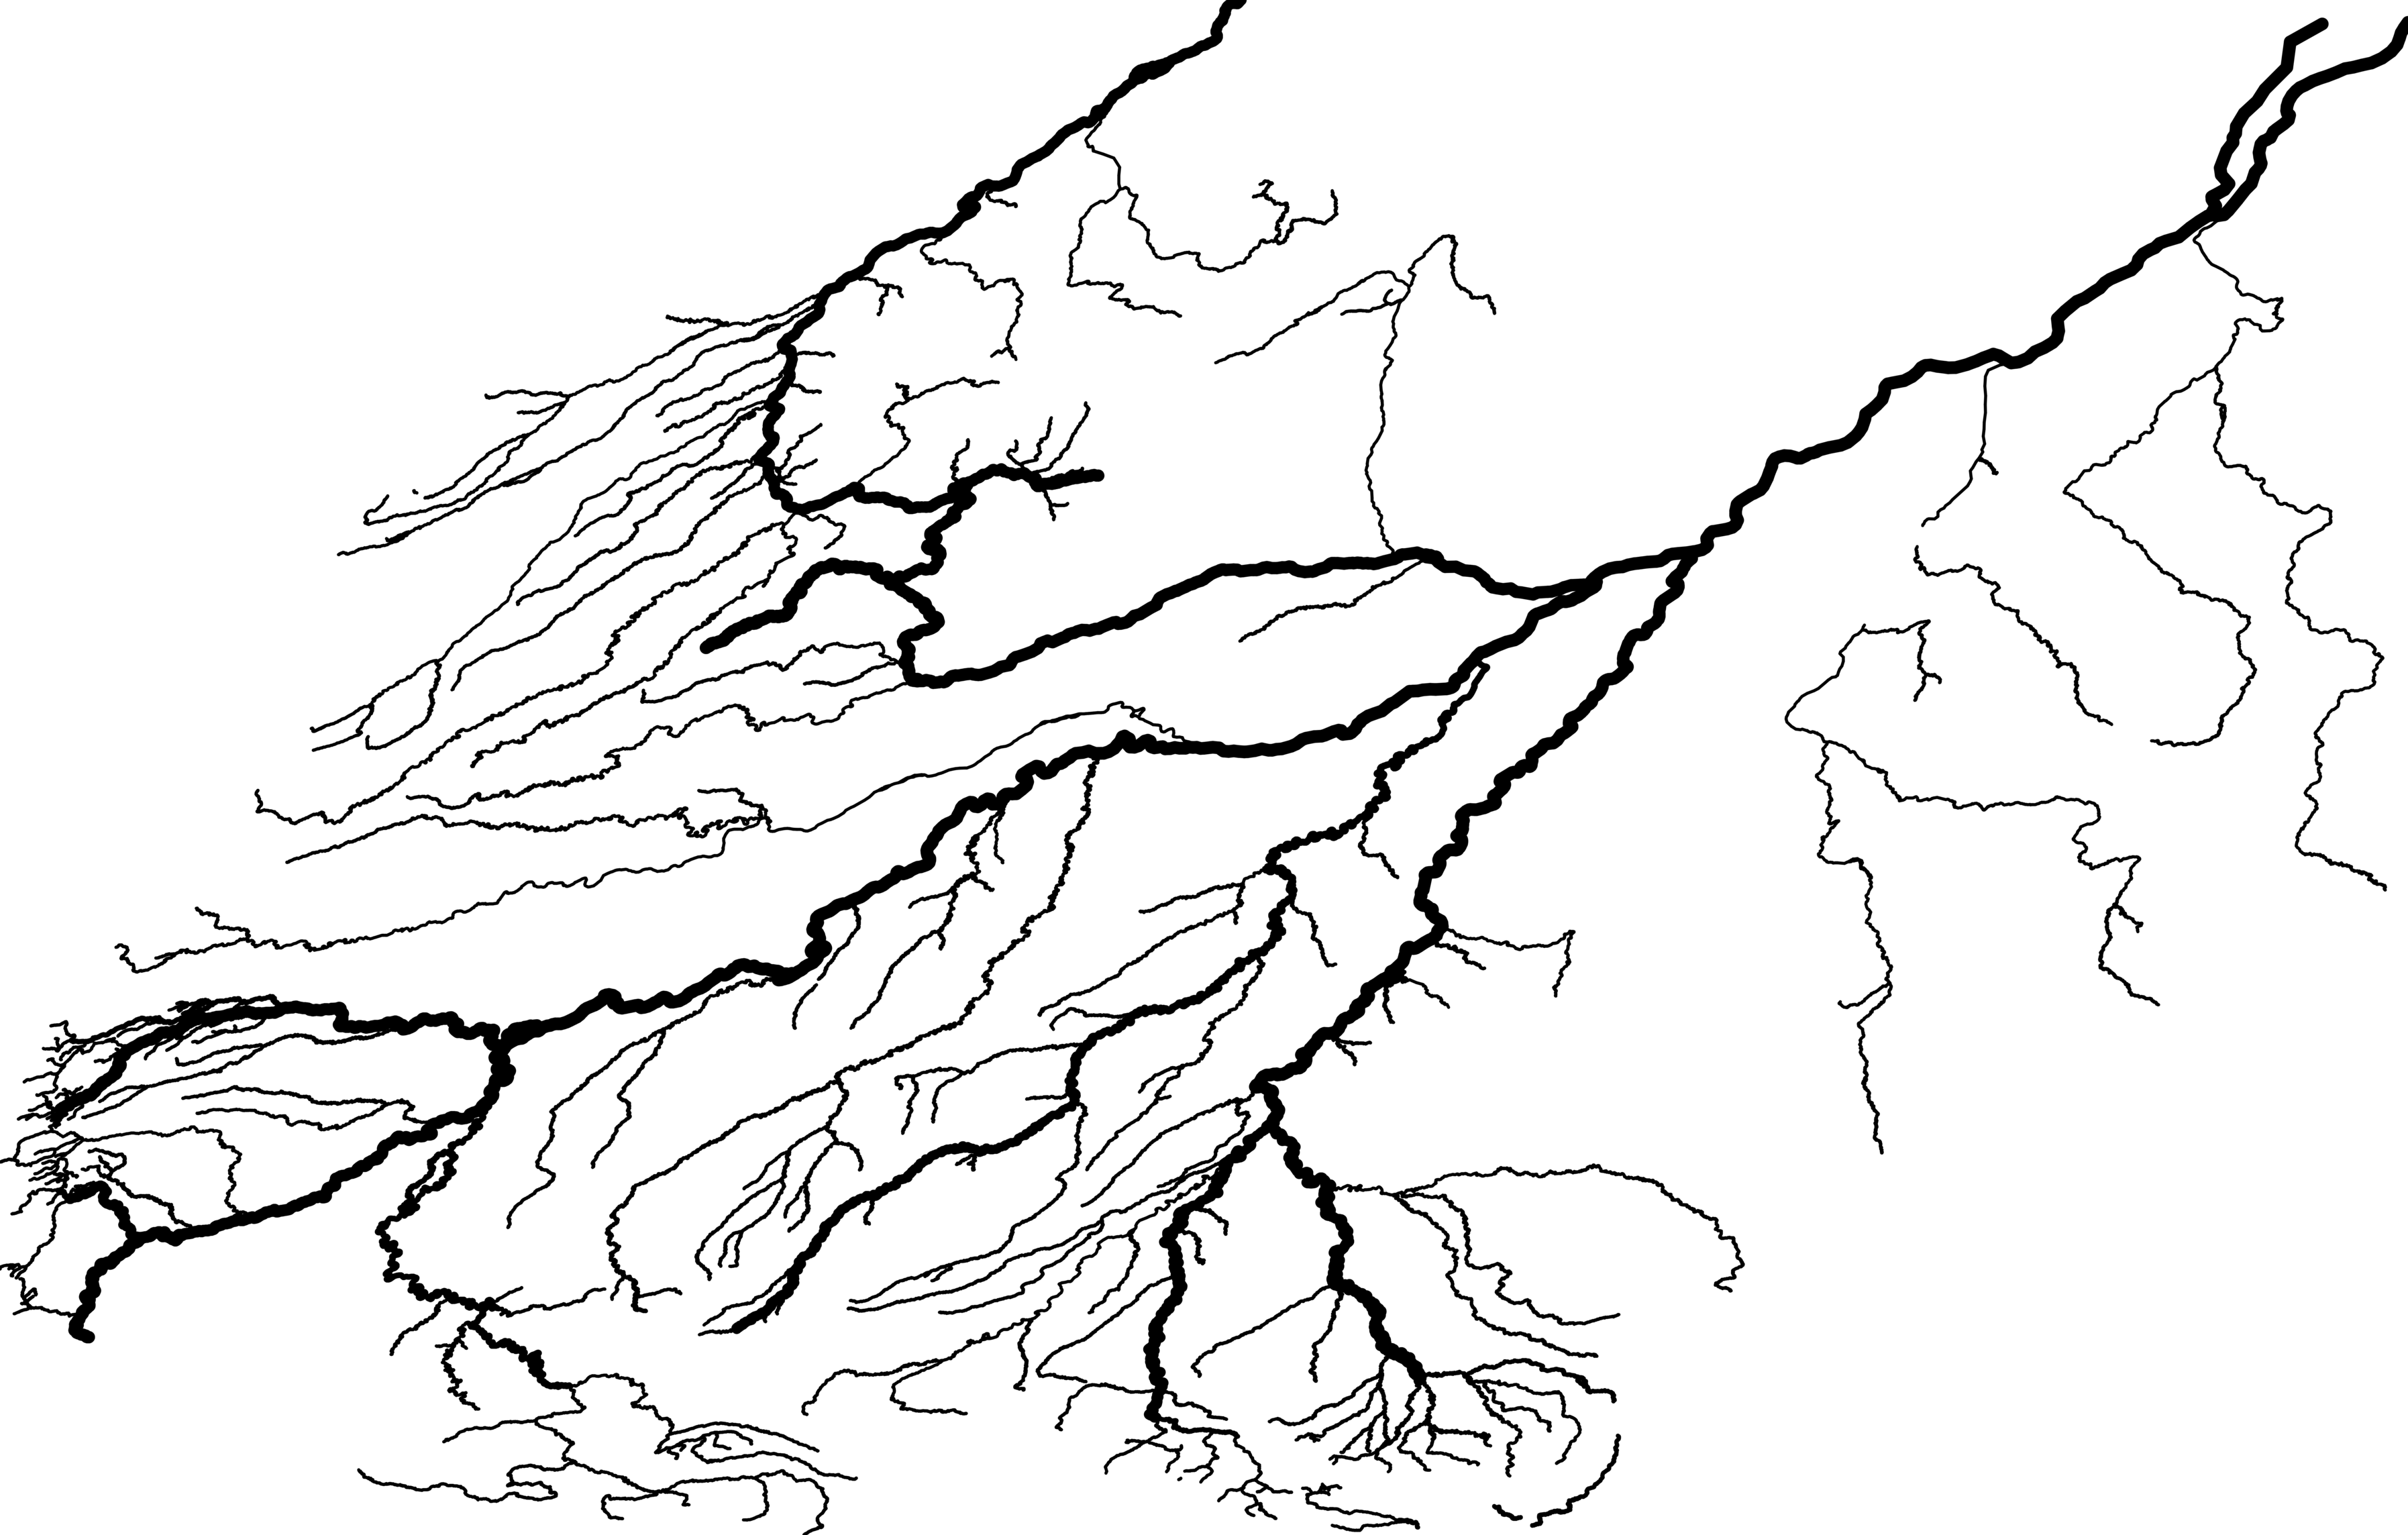
- The Amazon river / Rio Amazonas with all its tributaries [HD 11962x7625 / 3MB]
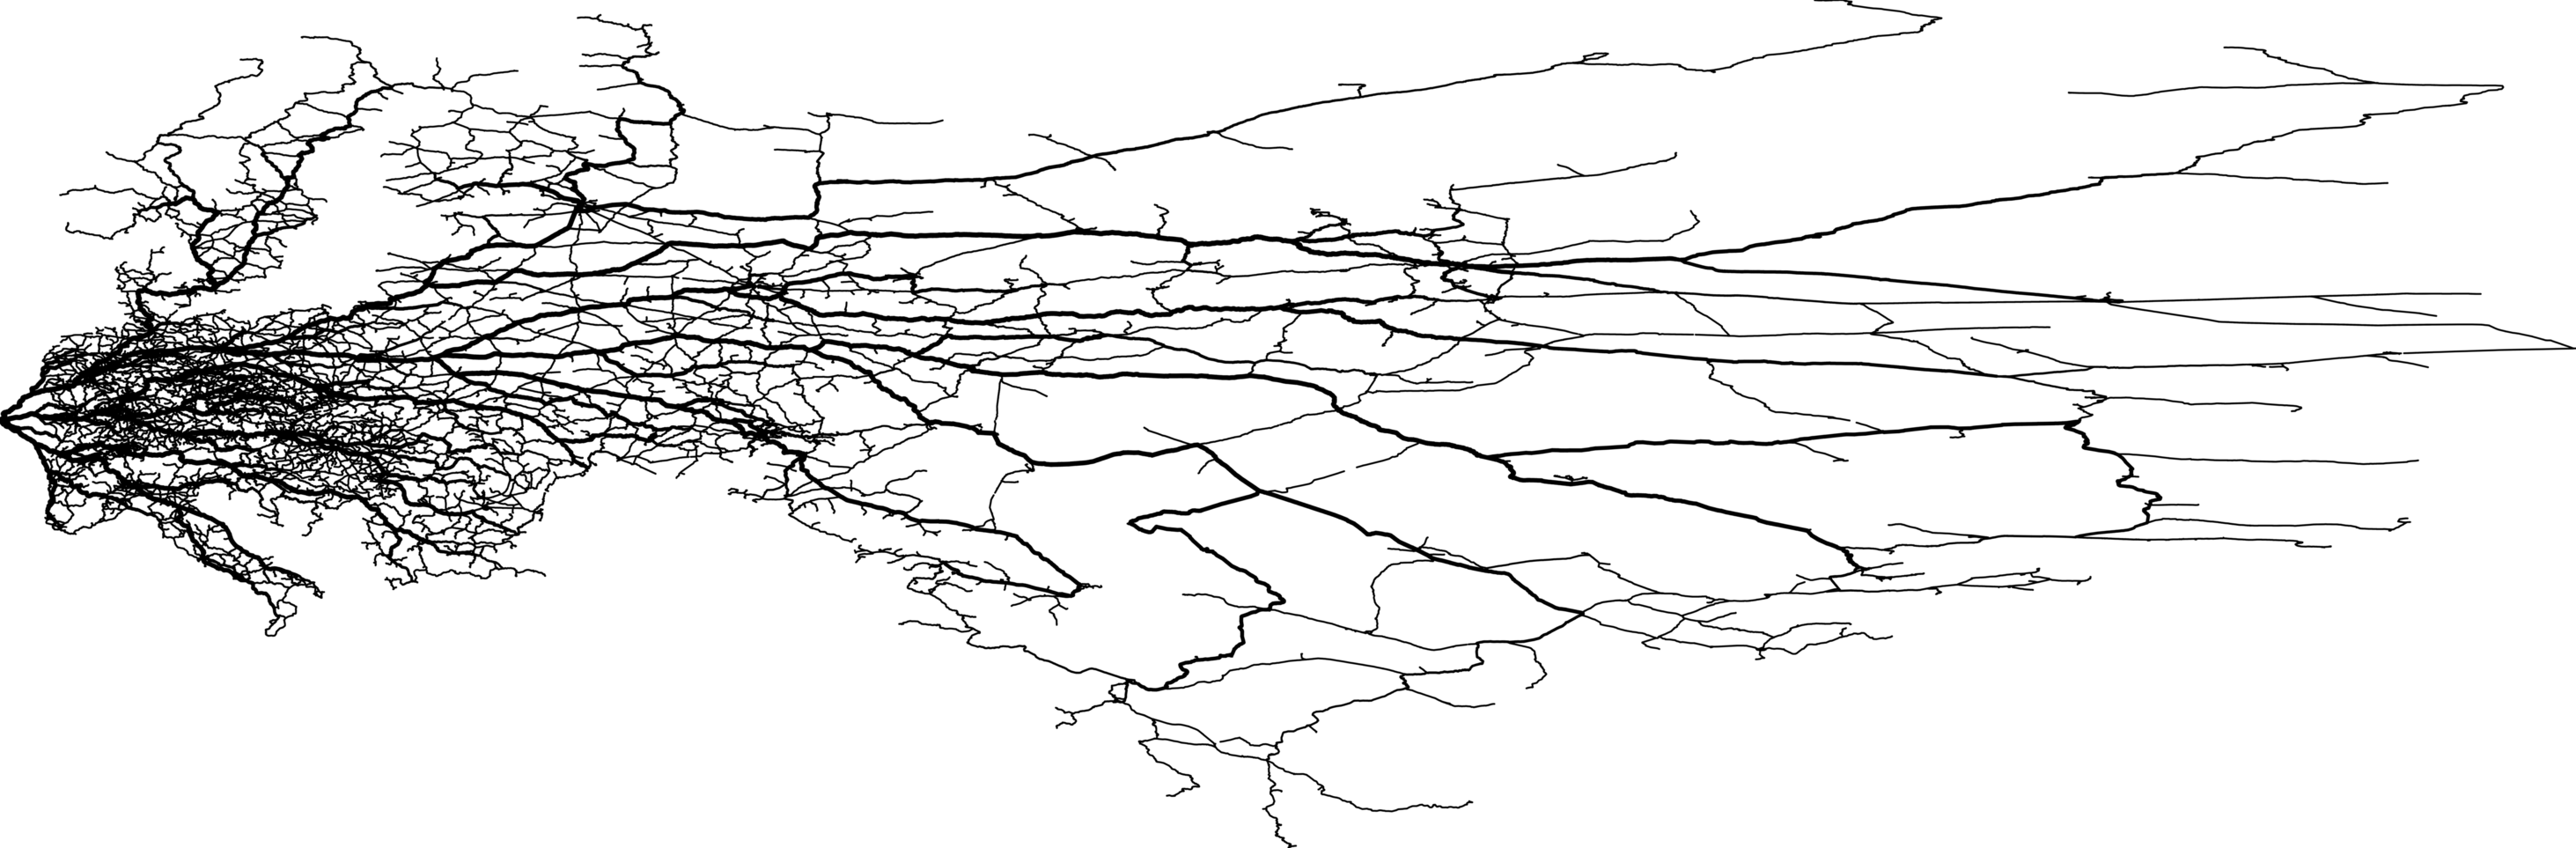
- Eastern European Railway (from Paris) [HD 29255x9624 / 10.8MB]
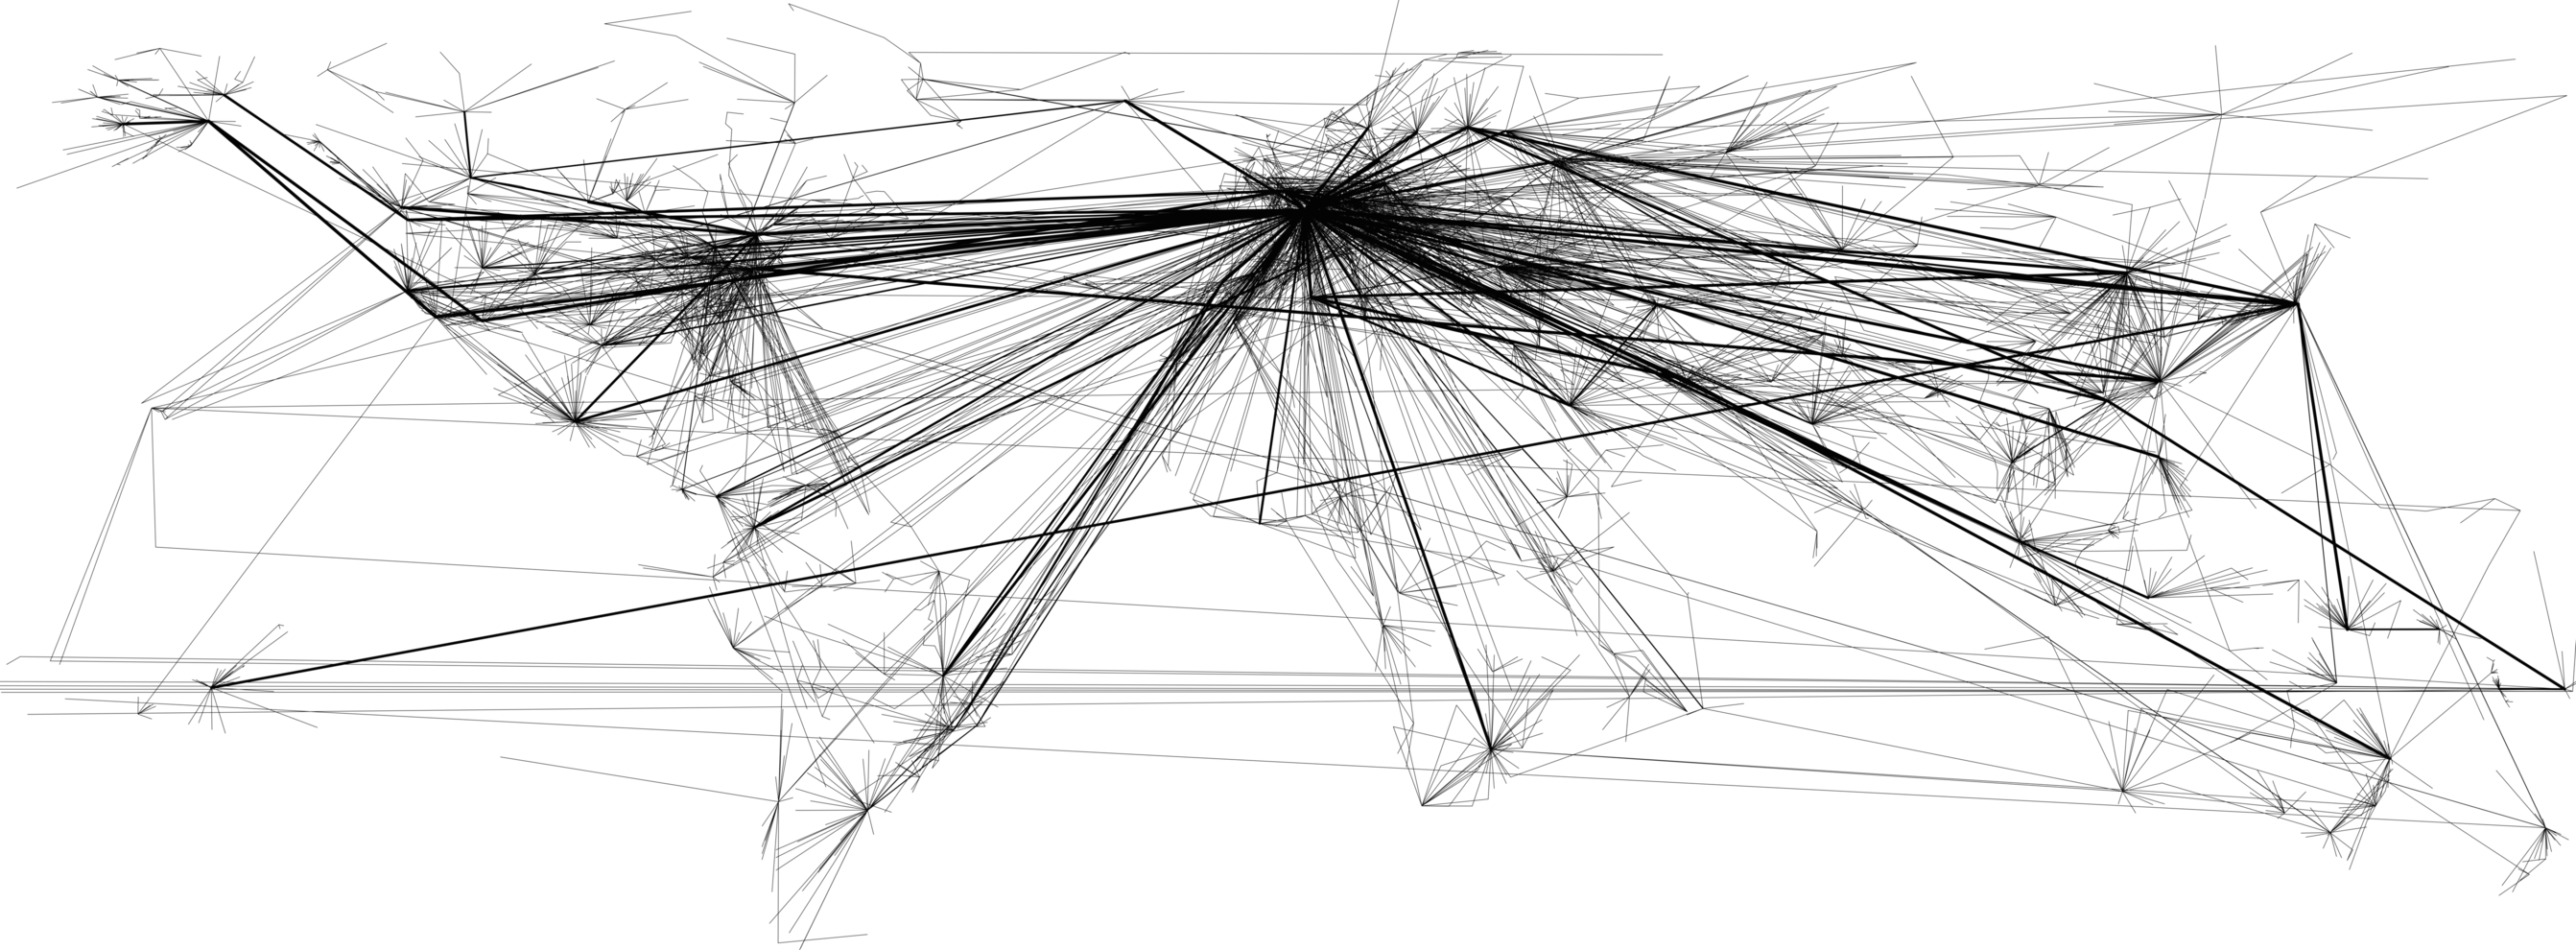
- World Flights (from Paris) [HD 17900x6600 / 17.72MB]


I was fascinated by the project "Roads to Rome" by Moovellab but sad that it isn't opensource. Helped by this project (thanks @tristramg ) I started to build my own map.
I did not have any GIS background but it was very interesting to discover what we can do with. The code isn't very good (I'm not a C++ guru).
The project is named "Dijkstra Cartography" but sometimes BFS algorithm is better (if all the edges have the same weight).
This code can be useful for cartographer, as I found a lot of errors for the river Amazon (see here) or.. to have your own poster 😉.
You may not want to use the planet.osm file (644GB - all the openstreetmap data in one file). Choose the right file here and extract what you really need with openstreetmap's tools : osmconvert, osmfilter, osmosis, osmium...
One interesting way is that you can extract all the data within a polygon with osmconvert, and here are some cities polygons.
| Map | Routing system used |
|---|---|
| Paris | Graphhopper - "Dijkstrabi" |
| Amazon | Dijkstra's algorithm |
| Railway | OSRM |
| Flights | Dijkstra's algorithm |
The first thing to do is to gather the statistics of usage of all paths : for each location, execute the routing algorithm you chose to your root location (your home for example). Merge all and sort the data by the most used path.
| Map | Projection |
|---|---|
| Paris | Lambert 93-I EPSG:27571 |
| Amazon | ESRI:102032 (South America Equidistant Conic) |
| Railway | Mercator |
| Flights | WSG84 |
You can follow this guide, search SpatialReference or ESPG.io.
Considering the data is sorted and well projected.
The width and height of the image are defined like this :
width = (maxX-minX)/scale;
height = (maxY-minY)/scale;
To draw these paths, I used this function (plotted using R) :

as it gives me a percent (between [0;1] here) of how the line width must be important. Also I can accentuate the decreasing by modifying parameters inside exp().
I used cairo and I was really suprised that I can understand these map without using any shapefile.
