Modeling and visualization of wave interference and beat
patterns in Python
- Python 3.9.0
- NumPy 1.22.0
- Matplotlib 3.5.1
A beat is an interference pattern between two sounds of slightly different
frequencies at the same point in space, perceived as a periodic variation
in volume whose rate is the difference of the two frequencies

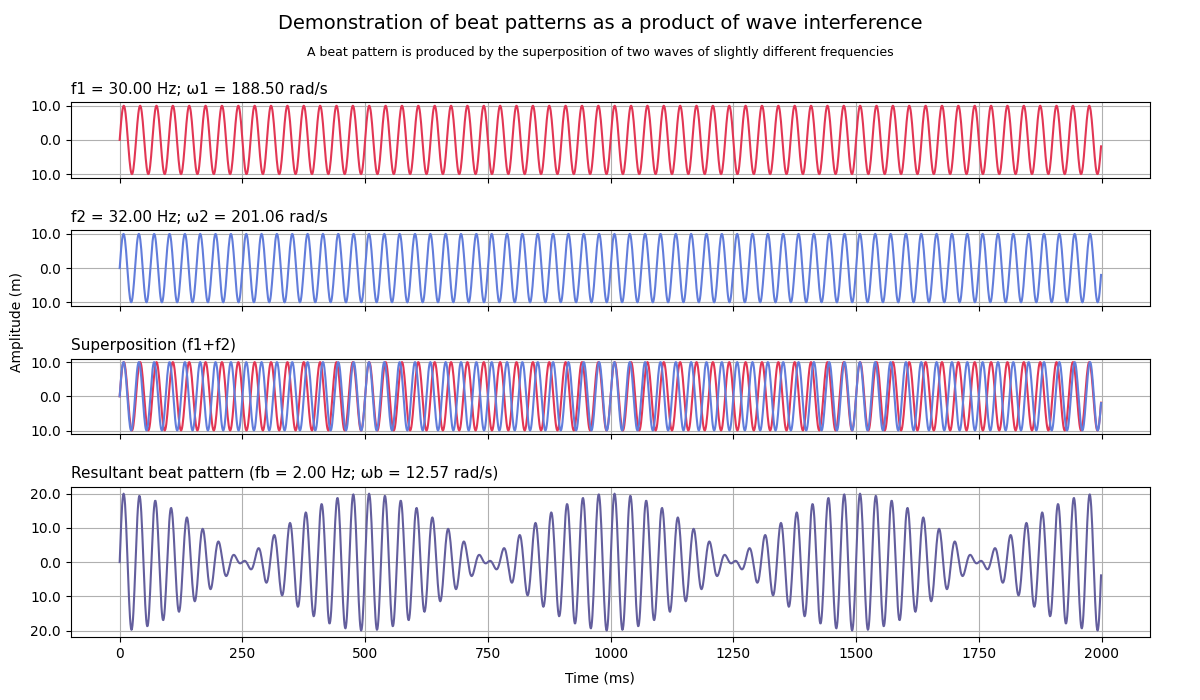
$ python beat_pattern.py -h
usage: beat_pattern.py [-h] [-w1] [-w2] [-a] [-t]

Plot the superposition of two waves by definition
of frequencies, amplitude and time

optional arguments:
  -h, --help        show this help message and exit
  -w1, --wave1      wave 1 frequency (Hz) (default: 30)
  -w2, --wave2      wave 2 frequency (Hz) (default: 32)
  -a, --amplitude   waves amplitude (m) (default: 10)
  -t, --time        points to evaluate function (s) (default: 2)
| Flag |
Argument |
Value |
Unit |
|
Wave 1 frequency |
30 (default) |
Hz |
|
Wave 2 frequency |
32 (default) |
Hz |
|
Amplitude |
10 (default) |
m |
|
Time |
2 (default) |
s |

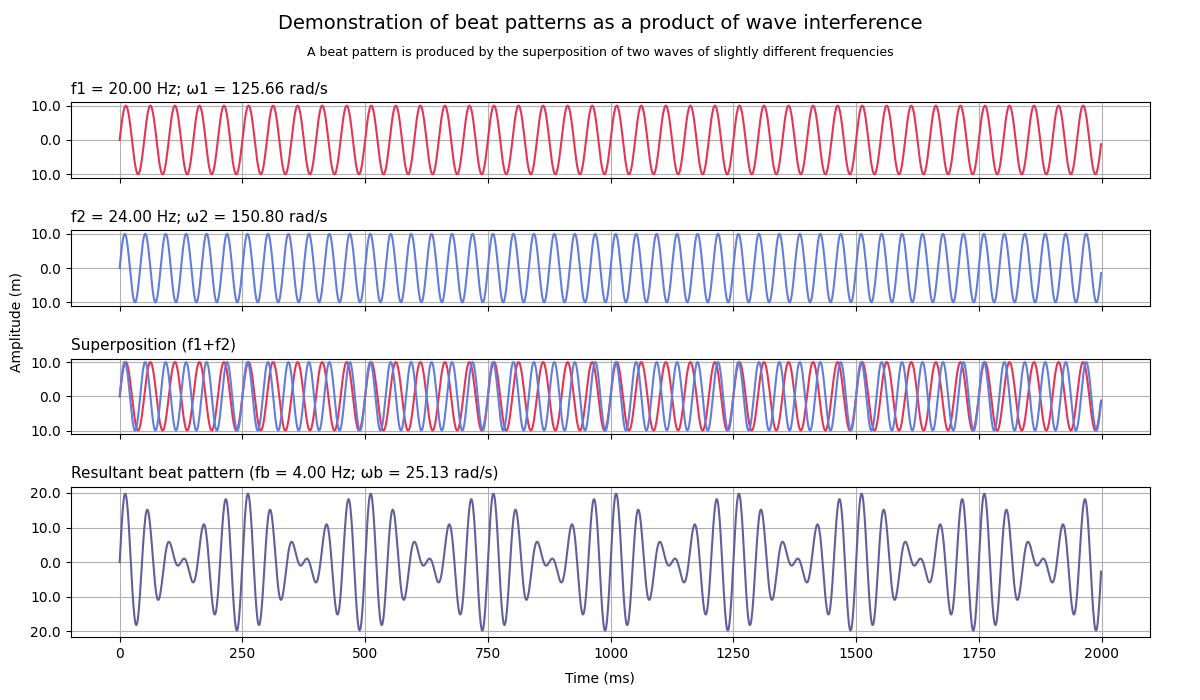
$ python beat_pattern.py -w1 20 -w2 24
| Flag |
Argument |
Value |
Unit |
| -w1 |
Wave 1 frequency |
20 |
Hz |
| -w2 |
Wave 2 frequency |
24 |
Hz |
|
Amplitude |
10 (default) |
m |
|
Time |
2 (default) |
s |

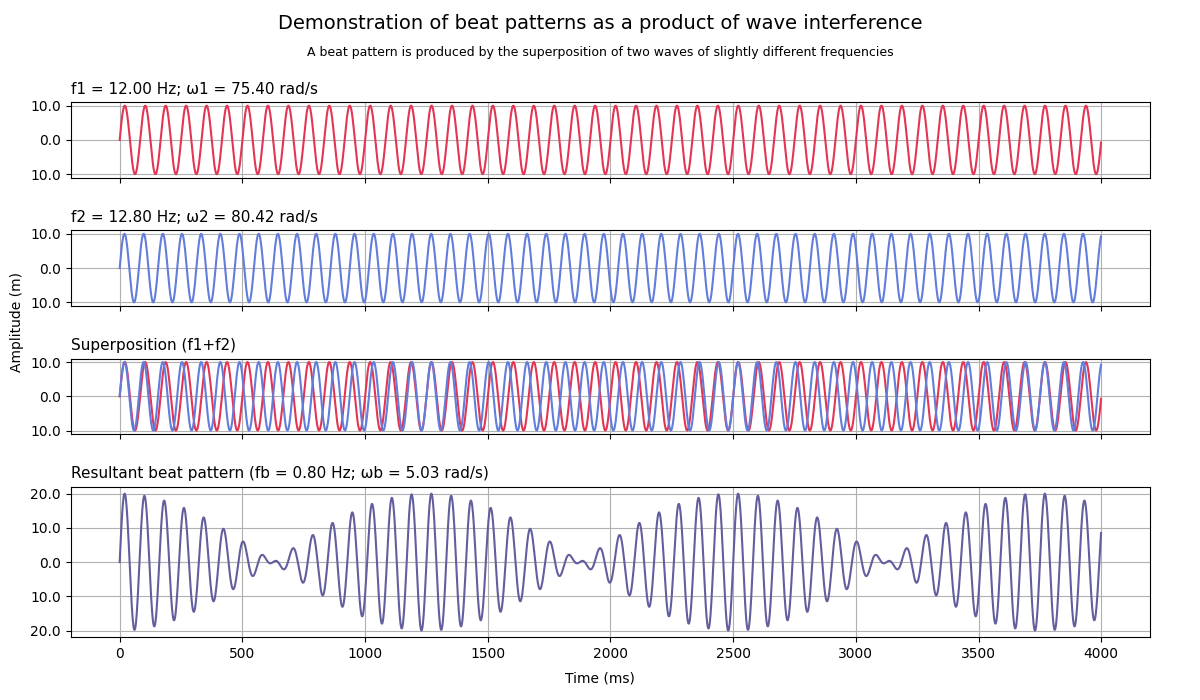
$ python beat_pattern.py -w1 12 -w2 12.8 -t 4
| Flag |
Argument |
Value |
Unit |
| -w1 |
Wave 1 frequency |
12 |
Hz |
| -w2 |
Wave 2 frequency |
12.8 |
Hz |
|
Amplitude |
10 (default) |
m |
| -t |
Time |
4 |
s |

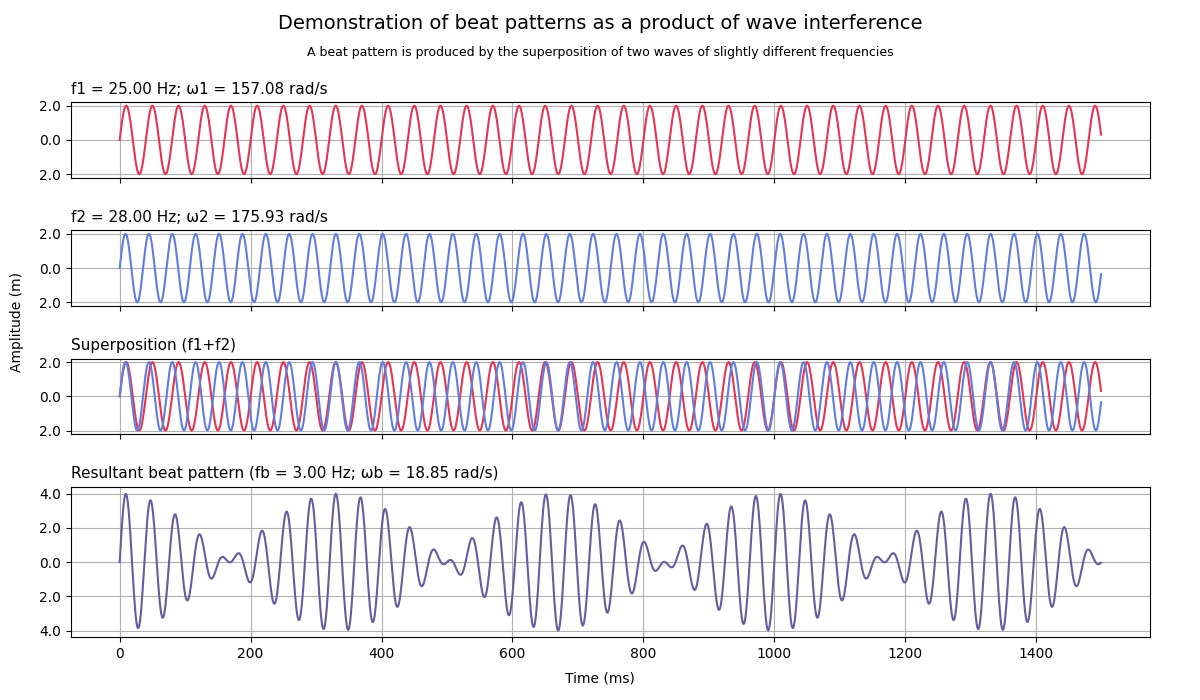
$ python beat_pattern.py -w1 25 -w2 28 -a 2 -t 1.5
| Flag |
Argument |
Value |
Unit |
| -w1 |
Wave 1 frequency |
25 |
Hz |
| -w2 |
Wave 2 frequency |
28 |
Hz |
| -a |
Amplitude |
2 |
m |
| -t |
Time |
1.5 |
s |


