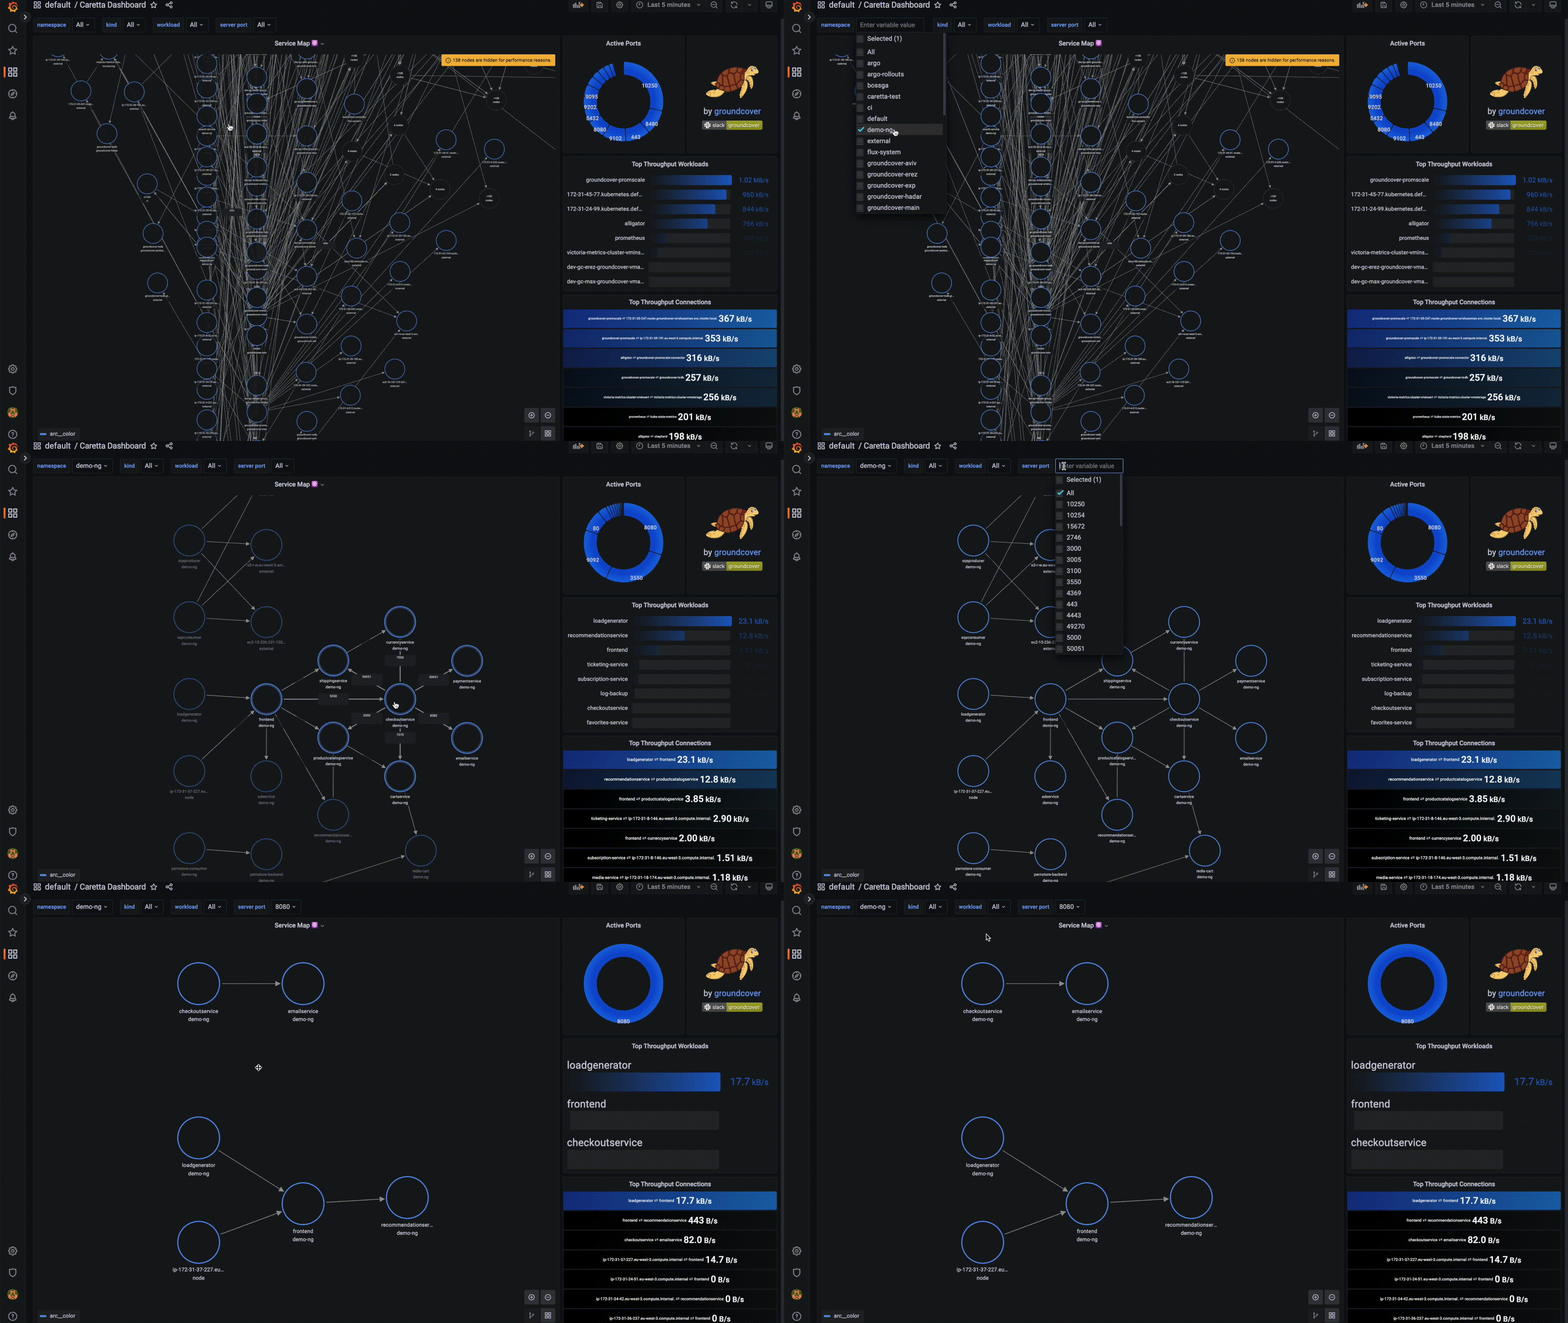
Caretta is a lightweight, standalone tool that instantly creates a visual network map of the services running in your cluster.
Carreta leverages eBPF to efficiently map all service network interactions in a K8s cluster, and Grafana to query and visualize the collected data.
Carreta is built to be efficient, with a minimal footprint on the system, and does not require any modifications of the cluster.
Caretta demonstrates the power of using eBPF for observability solutions, which is our vision at groundcover. If you're interested in understanding how Caretta is built, head over to our Caretta blog post!
As simple as installing a helm chart. It is recommended to install Caretta in a new, unique namespace.
helm repo add groundcover https://helm.groundcover.com/helm repo updatehelm install caretta --namespace caretta --create-namespace groundcover/carettaYou can configure Caretta using helm values. Useful values:
- tolerations can be specified to make sure Caretta's eBPF-agent will run on all cluster in your nodes. default value will tolerate common control-plane node annotations
- victoria-metrics-single.server.persistentVolume.enabled can be set to true if you wish to save Caretta's metrics to a persistent volume default: false
- pollIntervalSeconds can be modified to specify the polling and publishing interval of new metrics from the kernel. default: 5
- The built-in Victoria Metrics and Grafana instances can be disabled by changing the values victoria-metrics-single.enabled or grafana.enabled to false, accordingly. default: true
Example yaml for overriding these values:
pollIntervalSeconds: 15  # set metrics polling interval

tolerations:             # set any desired tolerations
  - key: node-role.kubernetes.io/control-plane
    operator: Exists
    effect: NoSchedule

 victoria-metrics-single:
  server:
    persistentVolume:
       enabled: true   # set to true to use persistent volume
This can also be done using the --set flag on the helm install command.
To uninstall, delete the helm release:
helm delete caretta --namespace carettaNote that if persistent storage was enabled in the installation, it may not be deleted automatically by this command.
- Linux kernel version >= 4.16
- CO-RE support. Supported linux distributions can be found here. Specifically, Docker for Mac uses a distribution which is not currently supported.
Caretta's helm chart ships an instance of Grafana with a predefined dashboard using data published by Caretta. This dashboard contains some examples to demonstrate the usage of Caretta's metrics.
To access Grafana, port-forward port 3000 from the Grafana pod in Caretta's namespace.
Using kubectl, it should look something like this:
kubectl port-forward --namespace caretta <grafana-pod-name> 3000:3000NOTE: Anonymous mode is enabled, making the default dashboard accessible with no login needed. To edit the default dashboard or create your own dashboard, use the default administrator's credentials user:
admin; password:caretta.
Caretta uses Victoria Metrics to collect and publish its metrics, and the outcome can be consumed by any Prometheus-compatible dashboard.
Caretta's main metric is caretta_links_observed (Gauge). It uses the following labels to represent a specific connection (network socket) going through the cluster:
client_name- either a name of a kubernetes entity, if resolved, an external domain, if resolved, or an IP address.client_namespace- either the namespace of the kubernetes entity, or "node", or "external".client_kind- either the kind of the kubernetes entity, or "node", or "external".server_name- either a name of a kubernetes entity, if resolved, an external domain, if resolved, or an IP address.server_namespace- either the namespace of the kubernetes entity, or "node", or "external".server_kind- either the kind of the kubernetes entity, or "node", or "external".server_port- the port used by the server.role- either 1 (client) or 2 (server).
Along those labels, Caretta uses other labels for Grafana's Node Graph panel.
This example shows a connection between a client named checkoutservice, controlled by a deployment, to a service named productioncatalogservice on port 3550, from the perspective of the client. Total bytes sent by the client in this connection is 2537 bytes.
caretta_links_observed{client_id="1074587981",client_kind="Deployment",client_name="checkoutservice",client_namespace="demo-ng",link_id="198768460",role="1",server_id="1112713827",server_kind="Service",server_name="productcatalogservice",server_namespace="demo-ng",server_port="3550"} 2537increase ((sum (server_port) (caretta_links_observed{client_name="some-client", server_name="some-server}))[15m]) will output the throughput observed between some-client and some-server in the last 15 minutes, aggregated by port.
sum by (server_name) (rate(caretta_links_observed{client_name="some-client"}))will output the rate of traffic from some-client to servers it communicates with, aggregated by the server's name.
sort_desc(increase((sum by (client_name)(caretta_links_observed{server_namespace="external"}))[5m])) will output communication to external servers by client's name, sorted descending.
Feel free to reach us on our slack channel, or create an issue in this repository.
Feel free to add your contribution to the project.
- Open an issue for missing features, or bugs
- Create a pull request for adding code to the project


