Generate raster image tiles for use with leaflet.
This is a modified version of gdal2tiles.py which adds support for raster images as plain 2D maps in leafletjs.
It adds the option -l or --leaflet to generate the resulting images
with the reference point [0,0] in the upper-left (North-West) corner,
opposed to the standard behaviour for TMS tiles using the lower-left
(South-East) corner.
Together with the small leafletjs plugin rastercoords.js you'll
be able to add markers at the correct position using the x,y coords of
the full-size image.
$ gdal2tiles.py -l -p raster -z 0-5 -w none karta.jpg tiles
See test/createtiles.sh.
Note: The min zoom level for tile generation must be greater or
equal to log2(max(width, height)/tilesize)
Assuming an image with 2000x3000 pixels:
$ echo "l(3000/256)/l(2)" | bc -l
# 3.55 --> min zoomlevel for tile generation is 4
# means: `gdal2tiles.py -l -p raster -z 0-2 ...`
#                                          \__ is not allowed
The same works with multicore support, thanks to gdal2tiles-Ticket-4379.
$ gdal2tiles-multiprocess.py -l -p raster -z 0-5 -w none karta.jpg tiles
To use the generated tiles with leafletjs there is a simple plugin to correctly set the required projection rastercoords.js.
<!DOCTYPE html>
<html>
	<head>
		<title>Test</title>
		<meta charset="utf-8"/>
		<meta name="viewport" content="width=device-width, initial-scale=1.0, user-scalable=no"/>
		<link rel="stylesheet" href="leaflet-0.7.3/leaflet.css" />
		<script src="leaflet-0.7.3/leaflet-src.js"></script>
		<script src="rastercoords.js"></script>
		<script src="index.js"></script>
		<style>
			html, body, #map { width:100%; height:100%; margin:0; padding:0; background-color: #B0B0B0 }
		</style>
	</head>
	<body onload="init()">
		<div id="map"></div>
	</body>
</html>
In the index.js:
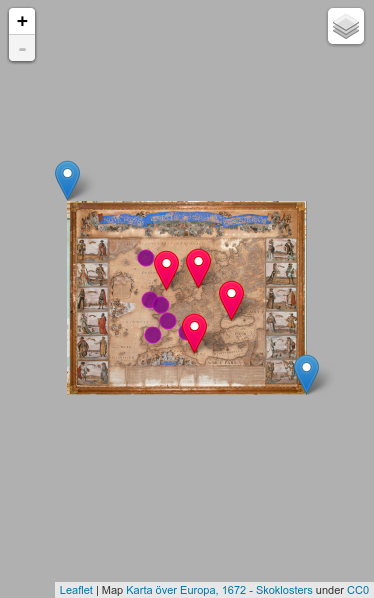
function init() {
	var minZoom = 0,
		maxZoom = 5,
		img = [
			3831,  // original width of image
			3101   // original height of image
		];

	// create the map
	var map = L.map('map',{
			minZoom: minZoom,
			maxZoom: maxZoom,
		});

	// assign map and image dimensions
	var rc = new L.RasterCoords(map, img);
	// set the bounds on map
	rc.setMaxBounds();

	// set the view centered ...
	map.setView(rc.unproject([img[0]/2, img[1]/2]), 5);

	// set marker at the image bound edges
	var layerBounds = L.layerGroup([
		L.marker(rc.unproject([0,0])).bindPopup('[0,0]'),
		L.marker(rc.unproject(img)).bindPopup(JSON.stringify(img))
	]);
	map.addLayer(layerBounds);

	// set markers on click events in the map
	map.on('click', function(event){
		var coords = rc.project(event.latlng);
		var marker = L.marker(rc.unproject(coords))
			.addTo(layerBounds);
		marker.bindPopup('['+Math.floor(coords.x)+','+Math.floor(coords.y)+']')
			.openPopup();
	});

	// the tile layer containing the image generated with gdal2tiles --leaflet ...
	L.tileLayer('./tiles/{z}/{x}/{y}.png', {
		noWrap: true,
		attribution: 'Map <a href="https://commons.wikimedia.org/wiki/'+
			'File:Karta_%C3%B6ver_Europa,_1672_-_Skoklosters_slott_-_95177.tif">'+
			'Karta över Europa, 1672 - Skoklosters</a> under '+
			'<a href="https://creativecommons.org/publicdomain/zero/1.0/deed.en">CC0</a>',
	}).addTo(map);
}
Please check the example in folder test which uses Leaflet 0.7.3.
To run the example you'll need to generate the tiles for the large image first.
$ cd test
$ ./createtiles.sh
$ open index.html
Then open index.html in a browser.
Or see it here in action.
If you contribute code to this project, you are implicitly allowing your code to be distributed under the respective license. You are also implicitly verifying that all code is your original work or correctly attributed with the source of its origin and licence.
gdal2tiles.py: (MIT licensed)
- Copyright (c) 2008, Klokan Petr Pridal
- Copyright (c) 2010-2013, Even Rouault
rastercoords.js + sample: (MIT licensed)
- Copyright (c) 2015 commenthol
leaflet for sample: (License)
- Copyright (c) 2010-2015, Vladimir Agafonkin
- Copyright (c) 2010-2011, CloudMade
See LICENSE for more info.