Figure size cannot be fixed.
Eureka-0 opened this issue · comments

Hi, I'm using SciencePlots like this:
plt.style.use("science")
Before plotting I set the figure size to A4(8.3x11.7). But after saving it to .jpg, the figure size changed adapting to chart size. Is there any way to fix the figure size?

Hi @Eureka-0
You want a figure to be the full size of a piece of A4 paper? This code does that:
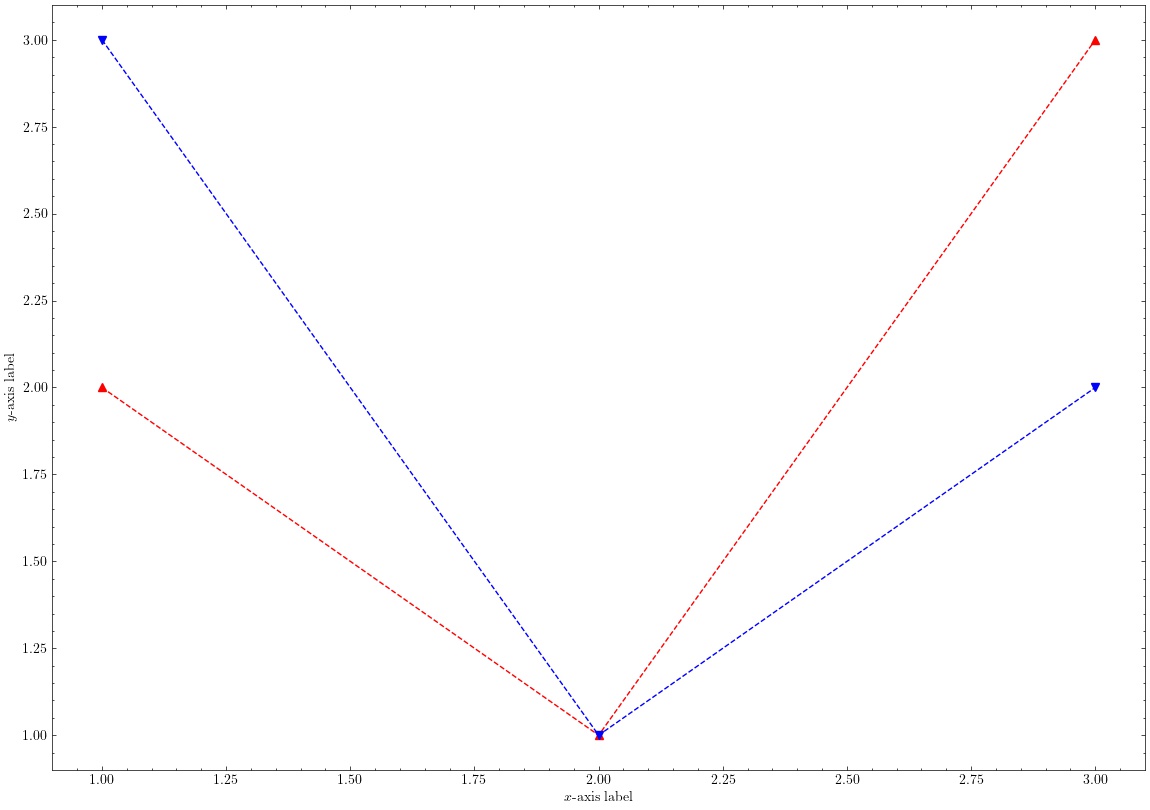
import matplotlib.pyplot as plt
plt.style.use('science')
plt.figure(figsize=(11.7, 8.3))
plt.plot([1, 2, 3], [2, 1, 3], 'r^--')
plt.plot([1, 2, 3], [3, 1, 2], 'bv--')
plt.xlabel("$x$-axis label")
plt.ylabel("$y$-axis label")
plt.tight_layout()
plt.savefig("test.jpg")
This gives me a figure with dimensions 11.5" x 8.1" (A4 in landscape).