Use HTML, CSS and BOOTSTRAP to create a web page that displays visualizations and the data that is used to create the visualizations.
Start at the index.html site
While each page conects to each other, this is the best way to start!!
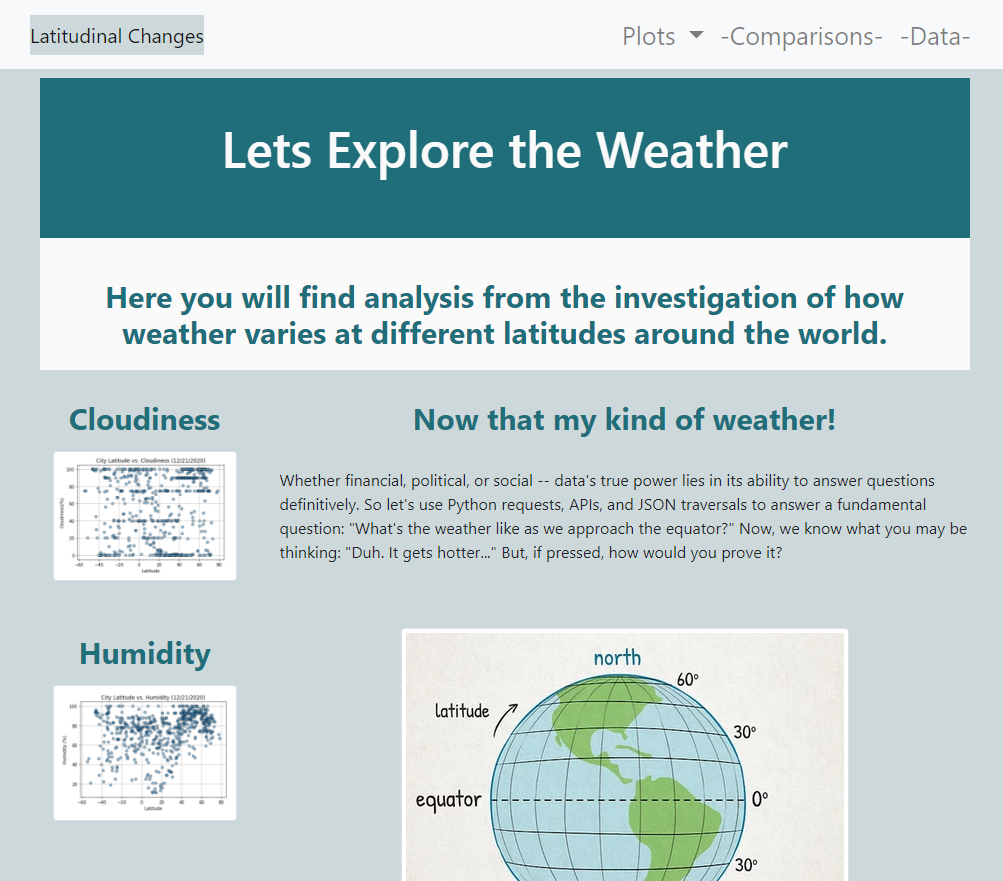
- An explanation of the project.
- A navigation bar with a link to all other pages
- Separate links to each visualizations page (can click on the picture).
- Ability to alter format at various screen sizes
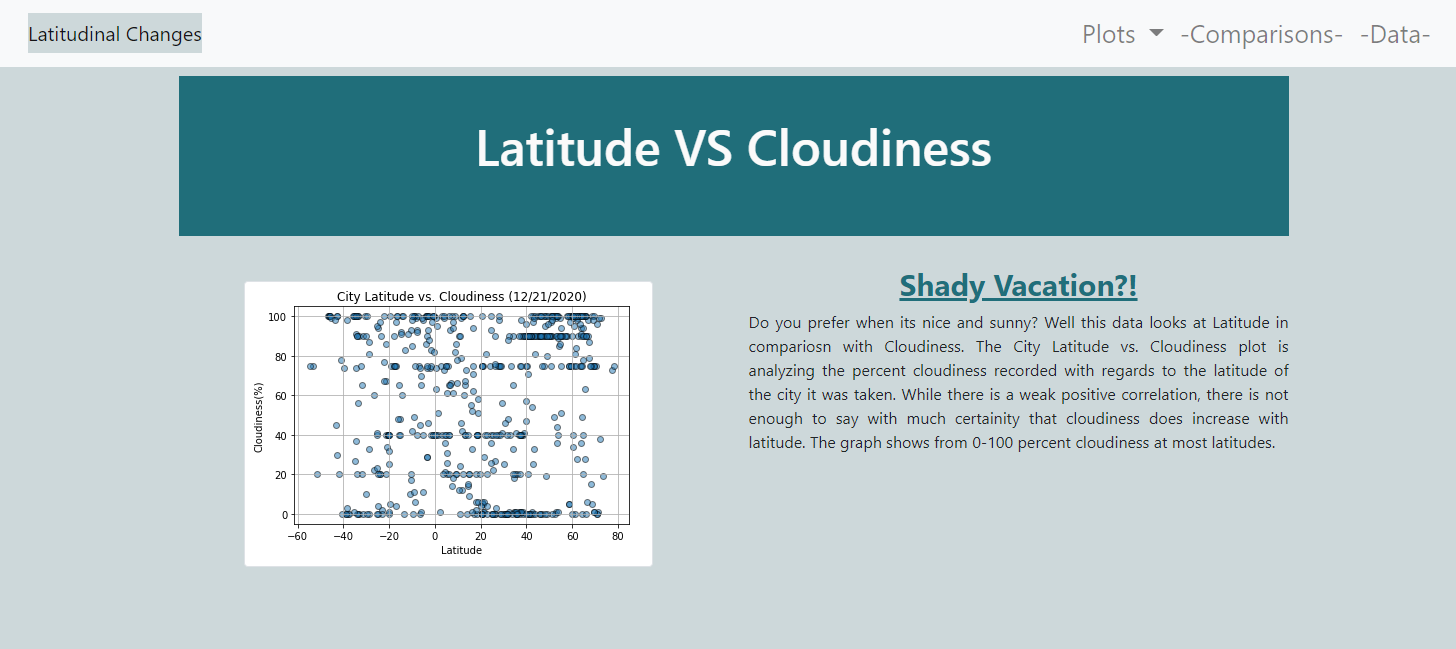
- A descriptive title and heading tag.
- The plot/visualization itself for a bettwe view.
- A paragraph describing the plot and its significance.
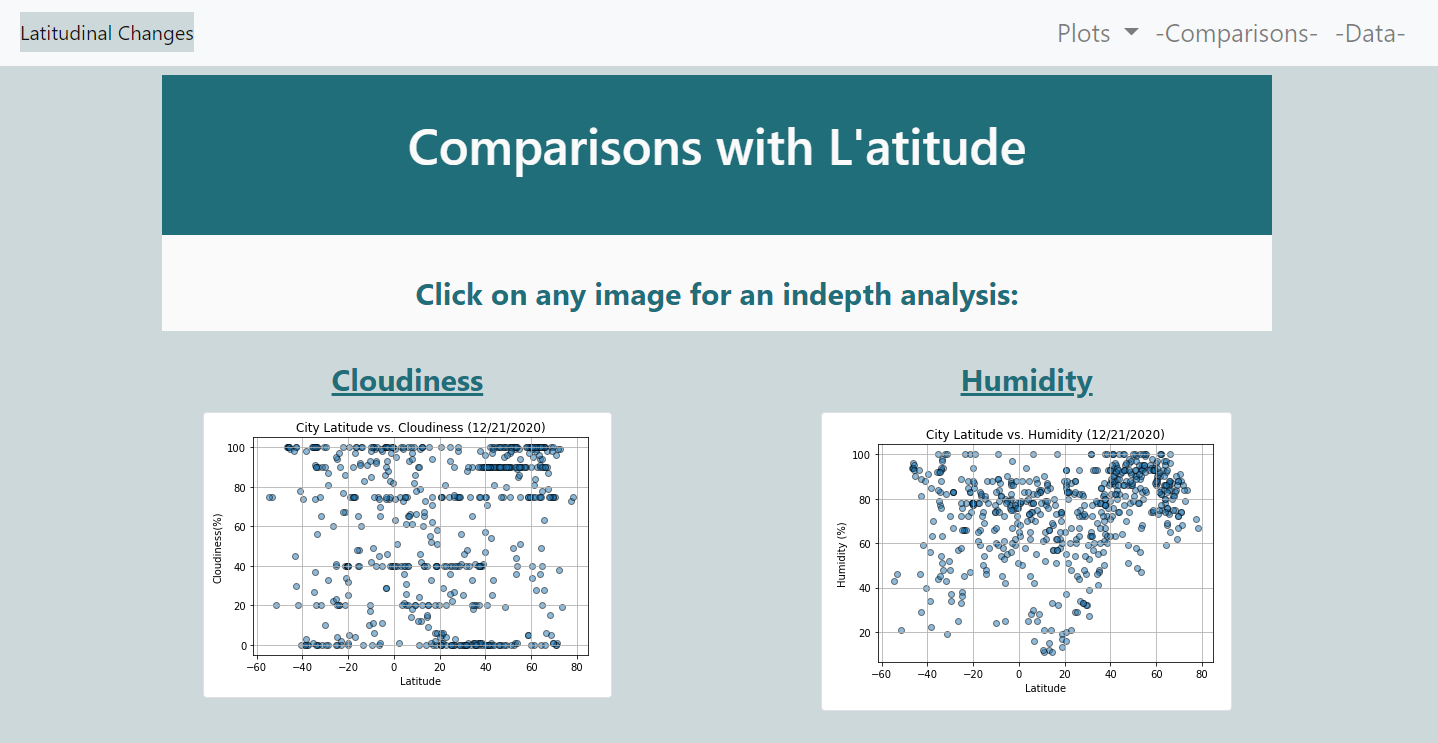
- Contains all of the visualizations on the same page so we can easily visually compare them.
- Uses a bootstrap grid for the visualizations.
- The grid must be two visualizations across on screens medium and larger, and 1 across on extra-small and small screens.
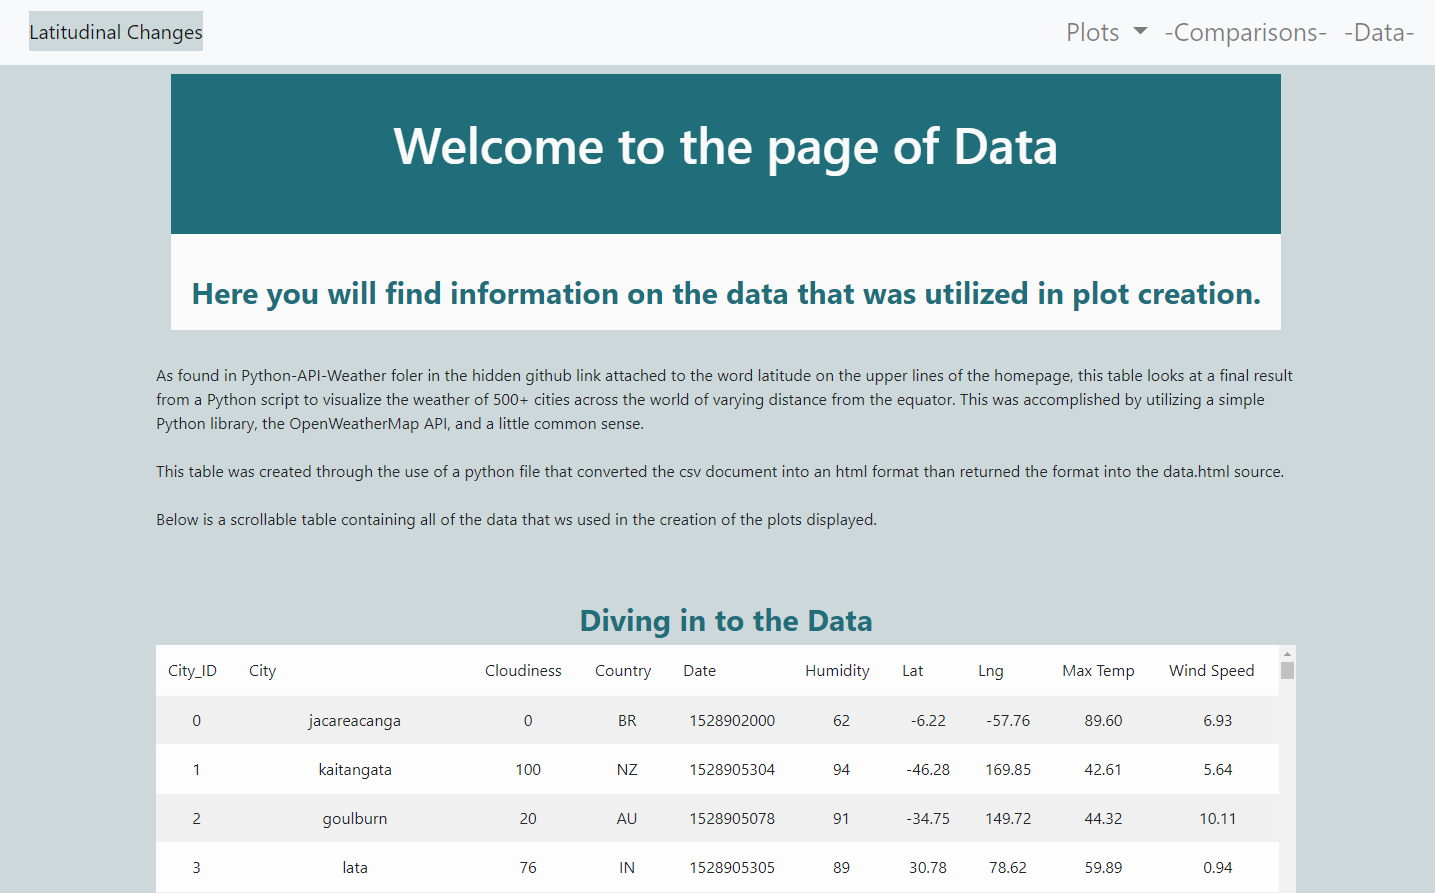
- Displays a responsive table containing the data used in the visualizations.
- The table must be a bootstrap table component.
- The data must come from exporting the
.csvfile as HTML, or converting it to HTML. - Pandas has a nifty method approprately called to_html that allows you to generate a HTML table from a pandas dataframe.


