How to run memlab in the web browser / SPA
FritzHerbers opened this issue · comments

We have an Angular application which connects to different REST api's using Windows Authentication.
To overcome issues with authentication we could add a middleware who authenticates a user automatically, which we have to add to each REST api.
The memlab CLI has to be feeded with a scenario file. The action function needs to be programmed with the use-case interactions on each page, which is very tedious.
Is it possible to run memlab within the SPA, the browser does the authentication and the use-case interactions are interactively done by the user.
The memlab documentation has several functions that result files are created on disk, which is not possible in the browser. Such structures need to be held in memory. Can they be held in memory?
The handling of memlab would be done inside an Angular service.
Which memlab API calls have to be made to process and retrieve valuable results for the following scenario?
function url() {
  return "http://localhost:4200/test/memlab";  // this is a minimal page where the app is not bootstrapped
}

// action where you suspect the memory leak might be happening
async function action(page) {
  const guide =  await page.$('a[href="/test/business-page"]');
  guide.evaluate((h)=>{h.click()});
}

// how to go back to the state before action
async function back(page) {
  const handles12 =  await page.$('a[href="/test/memlab"]');
  handles12[0].evaluate((h)=>{h.click()});
}

module.exports = { action, back, url };

node packages/cli/dist/runner.js  run --scenario .\memlab\memlab-scenario-001.js --work-dir .\memlab\results\
Which further api calls could be made to show valuable information (which needs an adapter to display in HTML (maybe just in a pre))?
Maybe this is already possible, I just need a kickstart. Can you provide an implementation. Any help is welcome.

For now, it is not possible to run MemLab in a browser due to the unavailability of the JavaScript heap snapshot browser API within the browser's JS sandbox. This API is inaccessible probably due to several reasons, including security, memory, privacy, and performance concerns.
However, if you want to utilize MemLab to analyze the heap and interact with the web page manually, you can take heap snapshots in Chrome DevTools, save them to disk, and then use the MemLab CLI tool to analyze them.
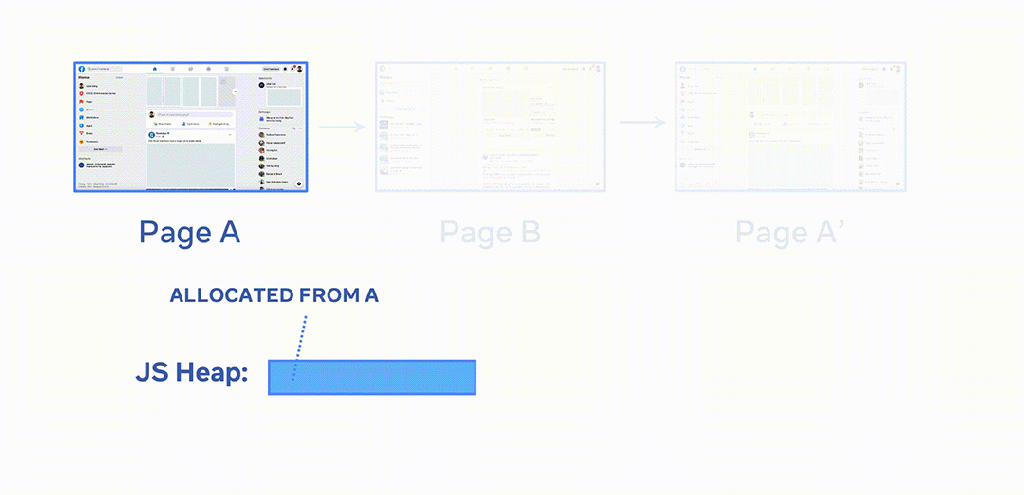
For instance, MemLab requires three separate heap snapshots - baseline, target, and final - for analysis. For more information on this, please refer to: https://facebook.github.io/memlab/docs/how-memlab-works
Here is a CLI command example:
memlab find-leaks --baseline file_path_1 --target file_path_2 --final file_path_3baseline, target, and final corresponds to the snapshot of A, B, and A' in the following animation:
MemLab provides API to be invoked programmatically, please check out the docs here:
https://facebook.github.io/memlab/docs/api/modules/api_src#functions

@JacksonGL , thanks for your great answer. I will give it a try next week.
You should mention the possibility of getting the heap snapshots from the browser as an alternative way besides the CLI and that running within the browser is not possible in your documentation.
One other thing about the documentation would be to add examples of the output of the different CLI commands: https://facebook.github.io/memlab/docs/cli/CLI-commands, or add them in a wiki.
In the documentation a tool is shown, is this tool publicly available? What are the features of this tool?
https://github.com/facebook/memlab
https://engineering.fb.com/2022/09/12/open-source/memlab/


@angelaschmid Thanks for the feedback.
The screenshots in the blog post were used as an example on how MemLab could be used inside your org. It's an internal tool visualizing memory leaks collected from regular run of MemLab inside Meta. The Dashboard was built on top of Meta's internal system, which cannot open source. MemLab saves all files (retainer traces, snapshots, scenario information) used by the Dashboard on disk (inside the $(memlab get-default-work-dir) folder).