4. Java Application as a Runtime White Box: App running, JVM and application monitoring, troubleshooting, faults analysing and tuning. 24 hrs / 3 days.
You have Java application running at prod server, Prometheus and ssh terminal. Let's start monitoring!
- Understanding modern application architecture and defect hotspots
- Understanding JVM classes, memory and threading architecture
- Hands-on skill of monitoring modern applications
- Understanding modern IO architecture and its pitfalls
- Hands-on skill of monitoring persistent data-driven applications
- RAM ≥ 8Гб
- Wi-Fi with Internet access
- Git Installation at Windows:
- Download distribution: Git for Windows Setup
- Run distribution
- All installation questions and options leave as default
- AdoptOpenJDK OpenJDK 8 HotSpot Latest Release Installation at Windows:
- Download distribution: preffered Windows Installer at corporate repo (
softwarecenter:SoftwareID=ScopeId_1999C8B9-1E4A-4832-84B4-AAC87980BDC9/Application_ec47efb0-71ec-4f0d-a374-05df14c3ae65) or fallback Windows installer at official website - Run distribution
- All installation questions and options leave as default
- VisualVM latest Installation at Windows:
- Download distribution: default latest version
- Unpack distribution to folder by your choice (e.g. "C:\Program Files")
- Install plugins "Visual GC", "VisualVM-XXX" and "Tracer-XXX"
- IntelliJ IDEA CE latest Community Edition Installation at Windows:
- Download distribution: latest Windows Community edition
- Run distribution
- All installation questions and options leave as default
- Maven latest binary zip Installation at Windows:
- Download distribution: latest Binary zip archive
- Unpack distribution to folder by your choice (e.g. "C:\Program Files")
- Remember this path, later we'll refer it as M2_HOME. Or add Windows system variable M2_HOME with value of path to unpacked distribution folder.
- Add full path to "bin" subfolder to Windows system PATH variable
- Check installation: run "cmd" program and get Maven version mvn --version
- SSH terminal (for Windows only)
- Check if you already have SSH client:
- run "cmd" program
- try run
ssh -V
If you don't have pre-installed SSH client, installation PuTTY for Windows at Windows:
- Download distribution: MSI Windows Installer 64-bit
- Run distribution
- All installation questions and options leave as default
- JMeter Installation at Windows:
- Download distribution: latest Binary ZIP
- Unpack distribution to folder by your choice (e.g. "C:\Program Files")
- Remember this path, later we'll refer it as JMETER_HOME. Or add Windows system variable JMETER_HOME with value of path to unpacked distribution folder.
- Add full path to "bin" subfolder to Windows system PATH variable
- prod host accessible
- Ports at {{ prod }}:ports_needed accessible
- Schedule
- Trainer
- Training overview
- Rules
- Pairs forming and introduction
- Attendees prerequisites check
- Topics focus demand from attendees
- Additional topics demand form attendees

| Concept | Metaphor | Code |
|---|---|---|
| Thread | Worker man | Thread created by runtime: java MyApplication |
| Thread Pool | Workers Team often the same Role | Typical architecture: pool managed by container, async arch: some pools managed by framework/application |
| Data input | Visitor's wishes | Console user input |
| Data processing | Meal recipes, conversation scripts, labor instructions | Code as instructions |
| Data storing | Persistent production store | Files as persistent store |
| Data output | Giving away to Visitor his meals | Console output |
| Concept | Metaphor | Code |
|---|---|---|
| Primitive Types | People can think and communicate only with numbers and strings | String restaurant menu |
| Structures | People can think with composite entities, concepts | Domain class and enum |
| Object of structure | Instance of concept, with its own state differs from other instance | Dealing with particular object while processing request |
| Concept | Metaphor | Code |
|---|---|---|
| Procedure | Meal recipe or conversation script | Setting behavior with methods |
| Call stack | Chain of actions workers call at others | Calling method from method |
| Class | Role: Chief or Waiter, state + bunch of procedures dealing with it | Today we likely divide state and behavior to domain entities and services |
| Object of class | Johnny the Chief and Maggy the chief differs with its state but have same behavior | |
| Application logic | Scenario how to behave all the workers in any case | Workers takes responsibilities on them to rule at their level |
| Concept | Metaphor | Implementation |
|---|---|---|
| Local/method/stack variables | Short-term memory: Chief remember sugar doze only when doing sugaring | Call Stack |
| Parameters | Details when asking others to do some work: waiter asks johnnyChief.makeMeal(whatMeals?) | Call Stack |
| Object state | State of worker or structure: its current properties values | Heap object space |
| - Request scope | Some object state accessible to all the workers in call chain handling request: sticky note or voice message given each worker to next, "not spicy" | Parameters, framework support, ThreadLocal |
| - Session scope | Some object state accessible to all the workers handling all requests from the same Visitor: "its for table 13" | Framework support |
| - Singleton/application scope | Some object state accessible to all the workers | Framework support, Language support for static variables |
| Persistent | Long-term data store surviving system restarts | File, embedded/local database, remote filesystem, remote database |
| Integration | Data stored and processed by external system | Remote system procedure call, message queue |
| Concept | Metaphor | Reality |
|---|---|---|
| Runtime | If Developer is CEO setting application logic, Runtime is your vice | JVM API and system library API |
| Working with thread: Thread API, states, pooling | We can create work force on demand to execute our instructions | But we have some RAM memory and performance cost |
| Working with class: dynamic classloading | Instructions what to do workers get just in time not ahead but worker remember it till die | But we have run-time latency costs |
| Working with instance: create and GC | We ask our vice to hire and retire workers | Objects state costs us RAM memory. When object's no longer needed it purged from RAM |
Teamwork: Why we do monitoring? What metrics do we consider for dev, test, qa and production environments? (30m)
- Why we do monitoring?
- What Quality Attributes/NFRs does JVM provide for application?
- What Quality Attributes/NFRs do we satisfy with application monitoring?
- JVM vs JRE vs JDK
- Physical point ov view for java application
- Classes, packages and JARs
- classpath x2
- Build cycle raw
- Build cycle with Maven
- JVM vs JRE vs JDK
- Run with JVM
- Ways for application run-time parameterization: jvm parameters, program arguments, sys/app properties
- Key JVM parameters for memory setup
- JMX simple tooling demo: JVisualVM
- JMX architecture overview
- Satisfied prerequisites
- Cloned locally training content
git clone --depth 1 --branch master https://github.com/eugene-krivosheyev/java-application-monitoring-and-troubleshooting
cd java-application-monitoring-and-troubleshooting- Credentials for corporate Maven Artifactory repo set up
cp iaac/roles/maven/files/settings.xml $M2_HOME/conf/
cp iaac/roles/maven/files/settings-security.xml ~/.m2/
mvn --encrypt-master-password {{ trainer_given_master_password }}
vi ~/.m2/settings-security.xml- Set up Maven to ignore SSL cert errors
-Dmaven.wagon.http.ssl.insecure=true -Dmaven.wagon.http.ssl.allowall=true -Dmaven.wagon.http.ssl.ignore.validity.dates=true- Project application built locally with IDEA's built-in maven
mvn clean verify [-DskipTests] - OR built JAR found in
iaac/roles/target_app/files - Project application ran locally with CLI
java \
  -Xms128m -Xmx256m \
  -cp target/dbo-1.0-SNAPSHOT.jar \
  -Dapp.property=value \
    com.acme.dbo.Presentation \
program arguments- JVisualVM profiler ran
$JAVA_HOME/bin/jvisualvm - JVisualVM profiler connected to running app
Local connections - OS-specific monitoring tool shows application process details
linux$ top [-pid jvmpid]
windows> taskmgr- What is the default encoding for I/O?
- Does the maximun heap size shown with JVisualVM correspond to -Xmx key?
- What is the default heap size for app running?
- How many java threads is active within JVM?
- How many OS threads is active within OS JVM process?
- What is the minimal possible heap size for app running?
- What is the difference for profiler times: Self time/Total time, CPU time?
- Application architecture overview
- Java Command Line Inspector
| Tier |
|---|
| Application logic layers: UI/P, API/C, BL/S, DAL/R |
| Application caching |
| Thread Pool |
| JPA Caching |
| JPA subsystem |
| Connection Pools |
| JDBC subsystem |
| Framework configuration with profiles |
| Framework for Spring modules management |
| Framework for Web/SOAP/REST application expose |
| Framework for Application |
| Application Server/Servlet Container |
| JVM: application debug API |
| JVM: application profiling API |
| JVM: universal monitoring API |
| JVM: threads, IO |
| JVM: memory, GC |
| JVM: process |
| Container: Networking |
| Container: Core |
| Message queues |
| DBMS |
| OS: Threads |
| OS: Processes |
| Hardware: HDD/SSD |
| Hardware: RAM |
| Hardware: CPU |
Tiers and components to monitor diagram
puml
@startuml
!define SPRITESURL https://raw.githubusercontent.com/rabelenda/cicon-plantuml-sprites/v1.0/sprites
!includeurl SPRITESURL/server.puml
!includeurl SPRITESURL/linux.puml
!includeurl SPRITESURL/docker.puml
!includeurl SPRITESURL/java.puml
!includeurl SPRITESURL/tomcat.puml
!includeurl SPRITESURL/cog.puml
!includeurl https://raw.githubusercontent.com/tupadr3/plantuml-icon-font-sprites/v2.4.0/devicons/coda.puml


component "<$server>\nhardware" as hardware #lightgray {
    [CPU]
    [RAM]
    [HDD]
    [LAN]

    component "<$linux>\nOS" as os #white {
        [container support]
        [process management]
        [thread management]
        [filesystem i/o]
        [network i/o]

        component "<$docker>\ncontainer" as container #lightgray {
            [network virtualization]
            [port mapping]
            [overlay fs]
            database "disk image"

            component "<$java>\njvm process" as jvm #white {
                [dynamic class loading]
                [JIT]
                [memory management]
                [heap GC]
                [threads management]
                [filesystem i/o api]
                [network i/o api]
                [monitoring API]
                [profiling API]
                [debug API]

                component "<$tomcat>\nservlet container" as web_container #lightgray {
                    [tcp connections\nmanagement]
                    [thread pool\nmanagement]
                    [http protocol\nhandling]
                    [web application\nlifecycle]
                    [java components\nlifecycle]

                    component "jdbc connection pool" as container_cp {
                        [jdbc driver]
                    }

                    component "<$coda>\nframework modules management system" as spring_boot #white {
                        [framework modules\nmanagement]
                        [application\nconfiguration context\nmanagement]

                        component "<$coda>\napplication framework" as spring_core #lightgray {
                            [application configuration\nhandling]
                            [application configuration\nprofiles support]
                            [application components\nmanagement]
                            [common scopes\nmanagement]
                            [user-defined thread pools\nmanagement]
                            [logging\nmanagement]

                            component "jpa persistent provider" #white {
                                [db data caching\nmanagement]
                                component "jdbc connection pool" as app_cp {
                                    [jdbc driver]
                                }
                            }

                            component "<$coda>\nweb/soap/rest framework" as spring_mvc #white {
                                [http protocol\nabstraction]
                                [request routing]
                                [data\n(de)serialization]
                                [data\nvalidation]
                                [monitoring\nendpoint]

                                component "<$cog>\napplication" as app #lightgray {
                                    [app data\ncaching management] #lightgray

                                    package "data access\nlayer" as dal #white {
                                        [repository]
                                    }
                                    package "business logic\nlayer" as bl #white {
                                        [service]
                                    }
                                    package "api\nlayer" as cl #white {
                                        [controller]
                                    }
                                    package "presentation\nlayer" as pl #white {
                                        [view]
                                    }

                                    service -> repository
                                    controller -> service
                                    view -> controller
                                }
                            }
                        }
                    }
                }
            }
        }
    }
}
@endumlpUML source
@startuml
node "dev station" as devstation {
 [ssh terminal] as terminal
 [browser]
 [jmeter]
 [jvm profiler] as profiler
}

actor Ops as ops
ops --> profiler
ops --> terminal
ops --> browser
ops --> jmeter

node "prod host" as prod {
 [node exporter] as node_exporter

 component [application] {
  [monitoring endpoint] as monitor
 }

 component [prometheus] {
  database metrics_history
 }

 [grafana] --> prometheus

 prometheus --> monitor
 prometheus -> node_exporter

 jmeter -> application
 node_exporter --> prod

 application --> [External REST service Stub]
}

terminal --> prod
browser --> prometheus
browser --> application
browser --> grafana
browser --> monitor
profiler --> application
@enduml- Node Exporter
- Prometheus
- Grafana: setting up datasource and export dashboard
- Custom Grafana dashboard as training outcome
- Adding metrics to Custom Grafana dashboard
- Types of performance testing except stress testing?
- While monitoring: What type should we use? What performance metrics do we test?
- Testing vs Monitoring
- JMeter overview
- Test plan
- Constants
- Test plan elements
- Running test plan: GUI and CLI modes
- Statistics overview: GUI and CLI mode
-
SSH user session with domain account to {{ prod host }}
ssh {{ account }}@s-msk-t-jvm-XXX -
Demo Application codebase cloned remotely
cd /opt
sudo git clone --depth 1 --branch master https://github.com/eugene-krivosheyev/agile-practices-application
sudo chown {{ account }}:users -R agile-practices-application
cd agile-practices-application- Made Maven able to run with given user
chmod a+x -R /opt/maven- Credentials for corporate Maven Artifactory repo set up
mkdir ~/.m2
cp /opt/maven/settings-security.xml ~/.m2/
mvn --encrypt-master-password {{ trainer_given_master_password }}
vi ~/.m2/settings-security.xml- Demo Application built remotely
cd /opt/agile-practices-application
mvn clean verify [-DskipTests]- External Legacy System REST stub started
cd target/test-classes # cat mappings/legacyAccountingSystemResponse.json
java -jar wiremock-jre8-standalone-2.31.0.jar --port 8888 [--verbose] & # curl localhost:8888/api/account- Application ran at {{ prod }}
cd /opt/agile-practices-application
rm -rf dbo-db

nohup \
  java \
    -Xms128m -Xmx128m \
    -XX:+IgnoreUnrecognizedVMOptions -XX:+UnlockDiagnosticVMOptions -XX:+UnlockExperimentalVMOptions \
    -XX:+PrintCompilation -XX:+LogCompilation -XX:LogFile=jit.log \
    -XX:+HeapDumpOnOutOfMemoryError -XX:HeapDumpPath=heapdump.hprof \
    -XX:+TraceClassLoading -XX:+TraceClassUnloading \
    -Xloggc:gc.log -XX:+PrintGCDetails -XX:+PrintGCTimeStamps -XX:+UseGCLogFileRotation -XX:NumberOfGCLogFiles=8 -XX:GCLogFileSize=8m \
    -Xlog:gc*,safepoint:gc.log:time,uptime:filecount=10,filesize=128K \
    -XX:NativeMemoryTracking=detail \
    -Dderby.stream.error.file=log/derby.log \
    -Dcom.sun.management.jmxremote=true -Dcom.sun.management.jmxremote.ssl=false -Dcom.sun.management.jmxremote.authenticate=false \
    -Djava.rmi.server.hostname="$(hostname -i)" -Dcom.sun.management.jmxremote.port=9999 -Dcom.sun.management.jmxremote.rmi.port=9999 \
    -jar dbo-1.0-SNAPSHOT.jar \
      --spring.profiles.active=qa \
      --server.port=8080 \
> /dev/null 2>&1 &- Local load emulation set up: database test data provisioning (
dbo-dbfolder)
cd java-application-monitoring-and-troubleshooting
jmeter -t load.jmx -j log/jmeter/jmeter.log # GUI mode- Read constants section
- Set up ${PROD_HOST} constant
- Toggled on setup test plan entry
- Shown entry setup/Summary Report
- Menu: Run/Start
- Wait while got samples of ${CLIENTS} constant count
- Toggled off setup test plan entry
- Toggled on reporting-users, admin-users, operations-users test plan entries
- Test plan saved
- Local load emulation ran
cd java-application-monitoring-and-troubleshooting
mkdir -p log/jmeter/report
jmeter -n -t load.jmx -j log/jmeter/jmeter.log -l log/jmeter/jmeter.jtl -e -o log/jmeter/report # CLI mode-
Java Command Line Inspector used to analyse application startup command line
-
CLI tools used at {{ prod }}
uname --all
cat /etc/os-release
uptime

df -ah
free -m

ps -ef
ps -eaux --forest
ps -eT | grep <pid>

top + 'q'
top + 'f'
top -p <pid>
top -H -p <pid>

vmstat 1 [-w] # mpstat 1
iostat 1 [-xm]
pidstat 1
netstat 1 [-tulnp]

jps [-lvm]
jcmd <pid> help
jcmd <pid> VM.uptime
jcmd <pid> VM.system_properties
jcmd <pid> VM.flags
jcmd <pid> PerfCounter.print
jcmd <pid> GC.heap_info
jcmd <pid> GC.finalizer_info
jcmd <pid> GC.class_stats
jcmd <pid> GC.class_histogram
jcmd <pid> Thread.print

java -XX:+UnlockDiagnosticVMOptions -XX:+UnlockExperimentalVMOptions -XX:+PrintFlagsFinal -version
jinfo <pid>
jinfo -flag PrintGCDetails <pid> # get jvm flag value
jinfo -flag +PrintGCDetails <pid> # change flag value, makes sense only for _manageable_ ones- Web applications used
http://{{ prod }}:8080/dbo/swagger-ui.html

http://{{ prod }}:8080/dbo/actuator/health
http://{{ prod }}:8080/dbo/actuator
http://{{ prod }}:8080/dbo/actuator/metrics
http://{{ prod }}:8080/dbo/actuator/metrics/jvm.memory.max?tag=area:nonheap&tag=id:Metaspace

http://{{ prod }}:8080/dbo/actuator/prometheus

http://{{ prod }}:9090/alerts
http://{{ prod }}:9090/graph
http://{{ prod }}:9090/graph?g0.range_input=15m&g0.tab=0&g0.expr=http_server_requests_seconds_count

http://{{ prod }}:3000
- JMeter load emulation stopped at dev station after ${TEST_DURATION_SEC}
- Application gracefully stopped at {{ prod }}
curl --request POST http://{{ prod }}:8080/dbo/actuator/shutdown
- Free HDD space? Free RAM?
- How many JVMs running?
- What DBMS used for application?
- What JVM version used for application? What are the parameters, properties and arguments used?
- What are the
healthindicator for application? - What is the application uptime?
- What is the CPU usage for application?
- How many http requests servlet container handled by different URLs?
- How many http sessions are active?
- What is the current
system load average? - What is the 90% percentile of service response time?
- Updated your custom Grafana dashboard with metrics you think is important
http://{{ prod }}:3000 - Full JVM Options Explorer added to bookmarks
| Tier | Implementation | Tools |
|---|---|---|
| Application Layers | PWA or Server-side Template Engine, Spring @Controllers, @Services, Spring Data JPA @Repositories | Spring Metrics for Counters, Timers, Long Task Timers, Statistics |
| Application caching | spring-boot-starter-cache module + built-in default Simple cache provider | Spring Metrics for Caches |
| Thread Pool | Java built-in ExecutorService | Spring Metrics for DataSources |
| JPA subsystem and JPA Caching | Hibernate | service:jmx:// Hibernate built-in statistics |
| JDBC subsystem and Connection Pools | Derby JDBC driver + HikariCP | service:jmx://com.zaxxer.hikari, Spring Metrics for DataSources |
| Framework for modules management | Spring Boot | spring-boot-actuator + Built-in Micrometer + Prometheus Adapter |
| Framework for Application | Spring Core + Spring MVC (spring-boot-starter-web) | Spring Metrics for Web Instrumentation [for Prometheus], Core Micrometer [for Prometheus] |
| Application Server/Servlet Container | spring-boot-starter-tomcat | |
| JVM: application debug API | JPDA | jsadebugd |
| JVM: application profiling API | JVMTI | hprof |
| JVM: threads, IO | JVM scheduler, JNI | jstack |
| JVM: memory, GC | Built-in Garbage Collectors | jstat, jstatd, jmap, jhat removed at jdk9 |
| JVM: universal monitoring API | JMX | jvisualvm |
| JVM: process | Oracle/OpenJDK JRE | jps, jcmd 9 + jcmd 8 (non-experimental status), jinfo |
| Containers | Docker | docker cli, docker api for Prometheus, Prometheus cAdvisor |
| Message queues | n/u | vendor tools, prometheus exporters |
| DBMS | Apache Derby / Postgresql | vendor tools, Prometheus pg_exporter, pg explain, pg analyse |
| OS | Linux | ps, top |
| Hardware | x86 | df, free, SNMP, Prometheus Node Exporter |
- Adding metrics to Custom Grafana dashboard
-
javac - JIT compilation and compilation eligibility
- Code Cache Memory: JIT native code
- C1 and C2 JIT compilers
- Compilation threads: C1(1/3) + C2(2/3)
- On-stack replacement (OSR) and background compilation queue
- C1 & C2 compiler queues dynamically resizes depending on available %CPU
- Tiers/Levels:
0: interpreted mode
1: simple C1 compiled code: w/o profiling
2: limited C1 compiled code: basic profiling
3: full C1 compiled code: full profiling
4: C2 compiled code
- Performance-happy path: 0 -> 3 -> 4
- Trivial Method: 0 -> {2,3} -> 1
- Deoptimization -> level 0 (not entrant or zombie code)
- Dead code elimination
- Inlining
- C2 Escape analysis for var caching, synchronization, skipping object creation
- Intel SSE and AVX instruction set
- Classes compiled -> commited code cache size
- Startup time
- Application throughput as f(warmup time)
CodeCache is full. Compiler has been disabled.
- Application ran at {{ prod }}
- External Legacy System REST stub started
- Load emulation ran
- CLI tools used at {{ prod }}
# java -XX:+PrintCompilation -XX:+PrintInlining -XX:+PrintAssembly -XX:+PrintOptoAssembly (C2 only)
# java -XX:+LogCompilation -XX:LogFile=jit.log

java -XX:+UnlockDiagnosticVMOptions -XX:+UnlockExperimentalVMOptions -XX:+PrintFlagsFinal -version | grep CodeCache
jinfo -flag UseCodeCacheFlushing <pid>
jinfo -flag InitialCodeCacheSize <pid>
jinfo -flag ReservedCodeCacheSize <pid>

jinfo -flag CICompilerCount <pid>
jinfo -flag BackgroundCompilation <pid>

jinfo -flag TieredCompilation <pid>
jinfo -flag CompileThreshold <pid> # _compile_ threshold applies only when standard compilation: -XX:-TieredCompilation
jinfo -flag Tier3InvocationThreshold <pid> # _invocation_ threshold applies when tiered compilation: -XX:+TieredCompilation
jinfo -flag Tier4InvocationThreshold <pid> # _invocation_ threshold applies when tiered compilation: -XX:+TieredCompilation

jstat -compiler <pid>
jstat -printcompilation <pid> [1000]
jstat -snap <pid> -J-Djstat.showUnsupported=true | grep .ci.

jcmd <pid> Compiler.codecache
jcmd <pid> Compiler.codelist | more - Web applications used
http://{{ prod }}:8080/dbo/actuator/metrics
http://{{ prod }}:9090/graph
- JConsole Profiler used
jconsole://{{ prod }}:9999/Memory/Code cache
jconsole://{{ prod }}:9999/MBeans- jitwatch tool used
- JMeter load emulation stopped
- Application gracefully stopped
- Database filled up with tests data removed
- Did system warm-up while load?
- Is Code Cache enough?
- Updated your custom Grafana dashboard with metrics you think is important
- CPU (threads)
- Memory (f.o.a. heap)
- Events (allocations, synchronizations, io, etc.)
- JMX Console
- Instrumenting profiler (-)
- Sampling profiler (+/-)
- Sampling profiler (+)
-
perfevents - Flame graphs
- JMX Console
- Sampling profiler
- "OS events"
- JVM embeds Flight Recorder events dump

- Thread definition and duality
- Scheduler and preemptive concurrency
- Scheduling overhead
- Green and native threads
- Thread resources consumption: heap, stack, CPU, OS limits for threads and native stack memory
- Main states and transitions
- Types of blocking/waiting
- What does thread do?
- Stack trace
- Thread dump
- Why thread pools?
- Pool metrics
- For given application codebase spot all the timepoints and places of starting thread.
| Issue | WTF | Solutions |
|---|---|---|
| Data Race | Concurrent non-atomic operation execution | Blocking: synchronized/monitor, non-blocking: atomics/CAS |
| Visibility and Reordering | JVM aggressive optimizations | JMM: synchronized + volatile |
| Deadlock | Threads blocked by each other | oops ( |
- Performance = f(% sync code) ?
- async operations + thread synchronization: wait/notify
- threading patterns for logic processing: sync/async with multiple pools
- MMO game/DBMS cases: entry point synchronization, coarse-grained data objects locking, fine-grained data objects subsequent locking
- concurrent data structures
- Adding metrics to Custom Grafana dashboard
- Application ran at {{ prod }}
- External Legacy System REST stub started
- Load emulation ran
- CLI tools used at {{ prod }}
top + 'f' -> nTH -> space -> Esc
jstack <pid> > thread-dump.tdump
scp -P 22 {{ account }}@{{ prod }}:/tmp/thread-dump.txt .- Profiler used
jvisualvm://File/Load (thread-dump.tdump)
jvisualvm://Threads (plugin Threads inspector required)-
Thread dump analysed
-
Web applications used
http://{{ prod }}:8080/dbo/actuator/metrics
http://{{ prod }}:9090/graph
- JMeter load emulation stopped
- Application gracefully stopped
- Database filled up with tests data removed
- How many threads are in system?
- Native or Green threads implemented by JVM?
- How many threads working on requests processing?
- Common thread state at normal load?
- Is it enough of threads?
- Where threads count can be adjusted?
- Is there contended in-memory resource?
- Hypothesis on what business logic is most CPU consuming
- Hypothesis on application threading patterns: (a) connection handling, (b) logic processing, (c) data access?
- Updated your custom Grafana dashboard with metrics you think is important
- Synchronous IO concept
- What sources do we use to get/store data?
- Excessive IO wrapper classes objects allocation
- Encoding
- Buffering as extra-resource allocation, non-reusability with OS
- Buffering as CAP case
- Blocking expensive server thread for user data IO
- Excessive resource allocation: closing resources
- Resource pools main metrics
- HTTP overview
- Commands and response codes
- HTTP session concept
- Keep-alive
- Content zipping
- Adding metrics to Custom Grafana dashboard
- Asynchronous IO concept
- NIO overview
- Threading patterns for connection data processing: sync/async (supported by sync/async Servlets, Spring MVC/WebFlux)
- Threading scope patterns: thread-per-request, thread-per-connection, thread-per-session
- Threading patterns for logic processing: sync/async with multiple pools
- Data access: sync/async (files, DB, HTTP REST calls)
- Application ran at {{ prod }}
- External Legacy System REST stub started
- Load emulation ran
- Profiler used
jvisualvm://Threads (plugin Threads inspector required)- Thread dump analysed
- Heap dump analysed
- Web applications used
http://{{ prod }}:8080/dbo/actuator/metrics
http://{{ prod }}:9090/graph
- JMeter load emulation stopped
- Application gracefully stopped
- Database filled up with tests data removed
- Did test clients get http errors?
- Incoming http connections long-liveness
- What is the system default IO encoding?
- Is there excessive IO wrapper objects allocation?
- Is outgoing HTTP connections pooled?
- Is it enough HTTP connections in pool?
- What threading pattern for connection data processing used in application design?
- What threading scope pattern used in application design?
- Updated your custom Grafana dashboard with metrics you think is important

- [Non-heap] Code Cache: JIT native code, thread stacks, native libraries
- [Non-heap] Allocated native memory: direct allocation, NIO buffers
- [Non-heap] Compressed Class space
- [Non-heap] Perm/Meta space
- [Heap/Object space] New/Young generation (including Eden and Survivor spaces)
- [Heap/Object space] Old/Tenured generation

- For given application codebase spot all the timepoints and places of memory allocation.
- What is garbage: objects ready for gc?
- GC Roots: Stack trace, static fields, etc.
- Minor VS Full GC and theirs ratio
- Copying collector
- Mark-sweep-compact (MSC) collector
- Single-threaded GC
- Parallel GC
- Stop-the-world pauses issue
- Concurrent/low-pause collectors: without stopping application threads when it possible (e.g. Mark phase)
- Trade-off: low-pauses (latency) vs CPU utilization taken out from application (throughput) vs Memory overhead (footprint)
| Serial | Parallel | Parallel + Concurrent | |
|---|---|---|---|
| New Gen | DefNew |
ParNew/PScavenge |
|
| Old Gen | Tenured/PSOld |
PSParOld |
CMS |
| Whole heap | G1 |
| Collector name | Main idea | Outcome | Full support /deprecation /experimental in JDK8 | JDK 11 | JDK 12 | Settings |
|---|---|---|---|---|---|---|
| Serial | Single-threaded for new and old gen. S-t-w for new and old gen. Copying for new gen, MSC for old gen. | Suitable for containerized apps. | + | + | + | -XX:+UseSerialGC |
| Throughput / Parallel | Parallel for new and old gen. S-t-w for new and old gen. Copying for new gen, MSC for old gen. | Maximum throughput ценой latency. | + | + | + | -XX:+UseParallelGC -XX:+UseParallelOldGC |
| Concurrent Mark-Sweep (CMS) | Parallel for new and old gen. S-t-w for new gen, mostly concurrent for old gen. Copying for new gen, MS for old gen, Compact for full GC only. | Latency oriented. | + | - | - | -XX:+UseConcMarkSweepGC |
| G1 | Multi-regional. Parallel for new and old gen. S-t-w for new gen, partly concurrent (for old gen Mark phase). Copying for new and old gen. | Latency oriented. | +/- | + | + | -XX:+UseG1GC |
| Epsilon | No-Op Garbage Collector | Test and research oriented. | n/a | + | + | -XX:+UnlockExperimentalVMOptions -XX:+UseEpsilonGC |
| ZGC | Scalable low latency concurrent garbage collector. | Latency oriented. Pauses no more 10ms. | n/a | ? | ? | |
| Shenandoah | Scalable low latency concurrent garbage collector. | Latency oriented. | ?? | ?? | ?? | |
| Actual collectors by JVM vendor and version |

- Multi-regional:
-XX:G1HeapRegionSize=n, value will be a power of two and can range from 1MB to 32MB. The goal is to have around 2048 regions based on the minimum Java heap size - Dynamic multi-regional: regions made E,S,O dynamically at run-time
- Pause time oriented ergonomics:
-XX:MaxGCPauseMillis=200-XX:GCPauseIntervalMillis-XX:G1HeapWastePercent=10(garbage allowed to left, Karl!)- нет гарантий по паузам
- Loves large heaps (> 5G) and non-full heaps
- in case of heaps < 2G maybe CMS?
- G1 tracks gc times to autotune
- Footprint overhead ~5-10% (Remember sets, Collection Sets)
- Allowed heap size autotune
-XX:AdaptiveSizePolicy-XX:MinHeapFreeRatio=40(расширение)-XX:MinHeapFreeRatio=70(сжатие)- G1 schedules Old (mixed) GC based on heap usage:
-XX:InitiatingHeapOccupancyPercent=45 - Young, mixed and full GCs
- young regions
- mixed: young + 1/8 of old regions
- full
- Humongous objects corner case
-
50% of region
- The only owner of region(s)
- Old gen from the beginning
- Creating heap dump
- Analysing heap dump
- GC roots
- Sizes: Shallow, deep (aggregation) and retained (composition)
- Heap Dominators
- Objects size and alignment (e.g. %8bytes), jol tool
- Object reference types: hard, soft, weak, phantom
- Compressed Oops as 35-bit reference (up to 32Gb) stored as 32-bit reference
- Adding metrics to Custom Grafana dashboard
- Metaspace
- Thread stacks
- Code cache
- GC structures
- Symbols as interned constants
- Native Byte Buffers: JNI allocations
- Native Byte Buffers: NIO direct buffers
- Application ran at {{ prod }}
- External Legacy System REST stub started
- Load emulation ran
- CLI tools used at {{ prod }}
jstat -gccapacity <pid>
jstat -gcutil <pid> [1000]
jstat -gc <pid>
jstat -gc <pid> 1000 10

jcmd <pid> GC.heap_info
jinfo -flag DisableExplicitGC <pid>
jcmd <pid> GC.run
jcmd <pid> GC.heap_info

jinfo -flag NewRatio <pid>
jinfo -flag NewSize <pid>
jinfo -flag MaxNewSize <pid>
jinfo -flag MetaspaceSize <pid>
jinfo -flag MaxMetaspaceSize <pid>
jinfo -flag ParallelGCThreads <pid>
jinfo -flag ConcGCThreads <pid>
jinfo -flag MaxGCPauseMillis <pid> # for Throughput collector
jinfo -flag InitiatingHeapOccupancyPercent <pid> # for G1 collector

jcmd <pid> GC.class_histogram # jmap -histo[:live] <pid>

jcmd <pid> GC.heap_dump /tmp/dump.hprof # jmap -dump[:live,format=b],file=/tmp/dump.hprof <pid>
devstation$ scp -P 22 {{ account }}@{{ prod }}:/tmp/dump.hprof .

jcmd <pid> VM.native_memory summary- Web applications used
http://{{ prod }}:8080/dbo/actuator/metrics
http://{{ prod }}:9090/graph
- Profiler used
jconsole://localhost:9999/Memory/Chart:*
jconsole://localhost:9999/MBeans
jvisualvm://File/Load (dump.hprof)
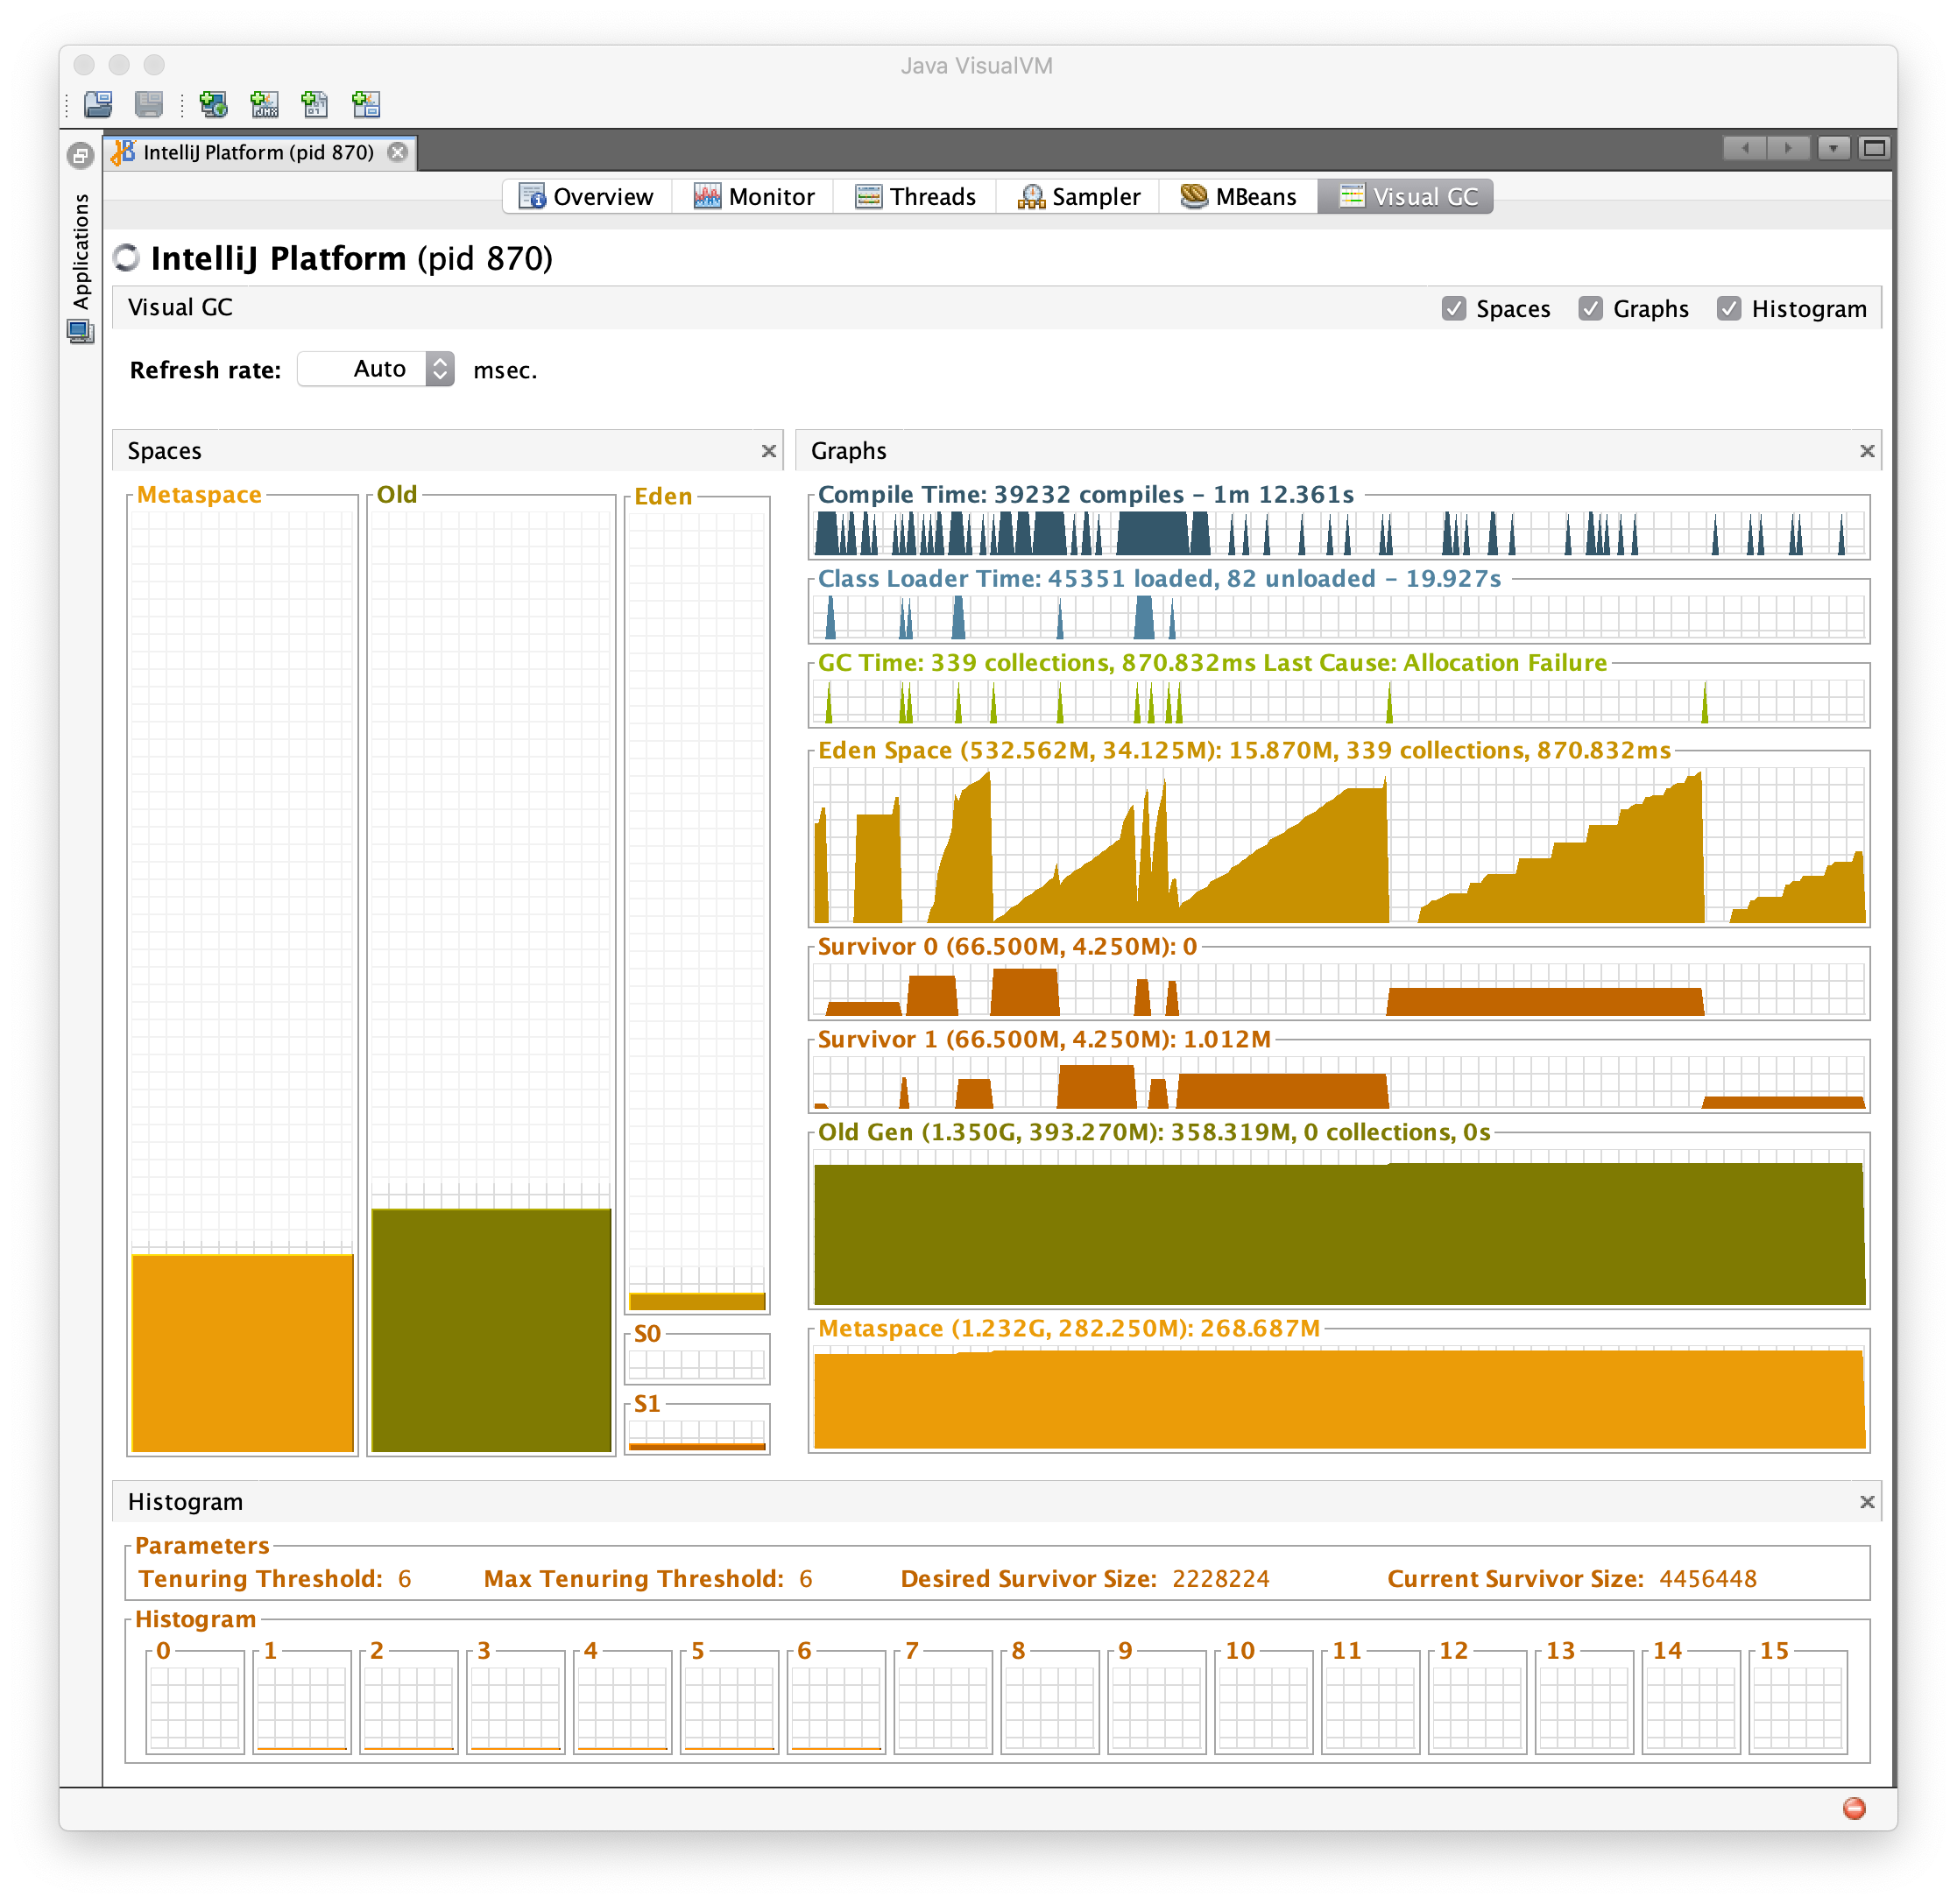
jvisualvm://VisualGC (plugin required)
jvisualvm://Buffer Pools (plugin required)- JMeter load emulation stopped
- Application gracefully stopped
- Database filled up with tests data removed
- What GC type is used?
- Has application stop-the-world GC pauses?
- Is enough memory for given load?
- Memory region with most risk of OOME
- Top memory consuming application classes
- What are the memory dominators?
- What is the native memory footprint?
- Updated your custom Grafana dashboard with metrics you think is important
- JDBC API
- Driver types
- Connection lifecycle
- Prepared statements
- ResultSet fetching
- DB Connection pool architecture
- Prepare Statements pooling
- Pool metrics
- Transaction concept
- Isolation levels
- Transaction resources trade-offs
- Adding metrics to Custom Grafana dashboard
- JPA API
- EntityManager and Context/Session
- Caching levels
- JPA transactions architecture
- Spring Data JPA module
- Repositories code generation
- Spring transaction management
- Application ran at {{ prod }}
- External Legacy System REST stub started
- Load emulation ran
- Profiler used
jvisualvm://Threads (plugin Threads inspector required)- Thread dump analysed
- Heap dump analysed
- Web applications used
http://{{ prod }}:8080/dbo/actuator/metrics
http://{{ prod }}:9090/graph
- JMeter load emulation stopped
- Application gracefully stopped
- Database filled up with tests data removed
- Is JDBC connections pooled?
- Is it enough JDBC connections in pool?
- ORM cache state?
- Can we set less transaction isolation level to gain throughput?
- Updated your custom Grafana dashboard with metrics you think is important
- Value taken
- Process Improvement Actions
- Training Improvement Actions
- Custom Grafana dashboards competition