Chart overflows when applying an offset on Axis
dJani97 opened this issue · comments

Hi!
I discovered an issue with the chart, which happens in case there is an offset on one of the Y-axes. You can see my example code here: My example code
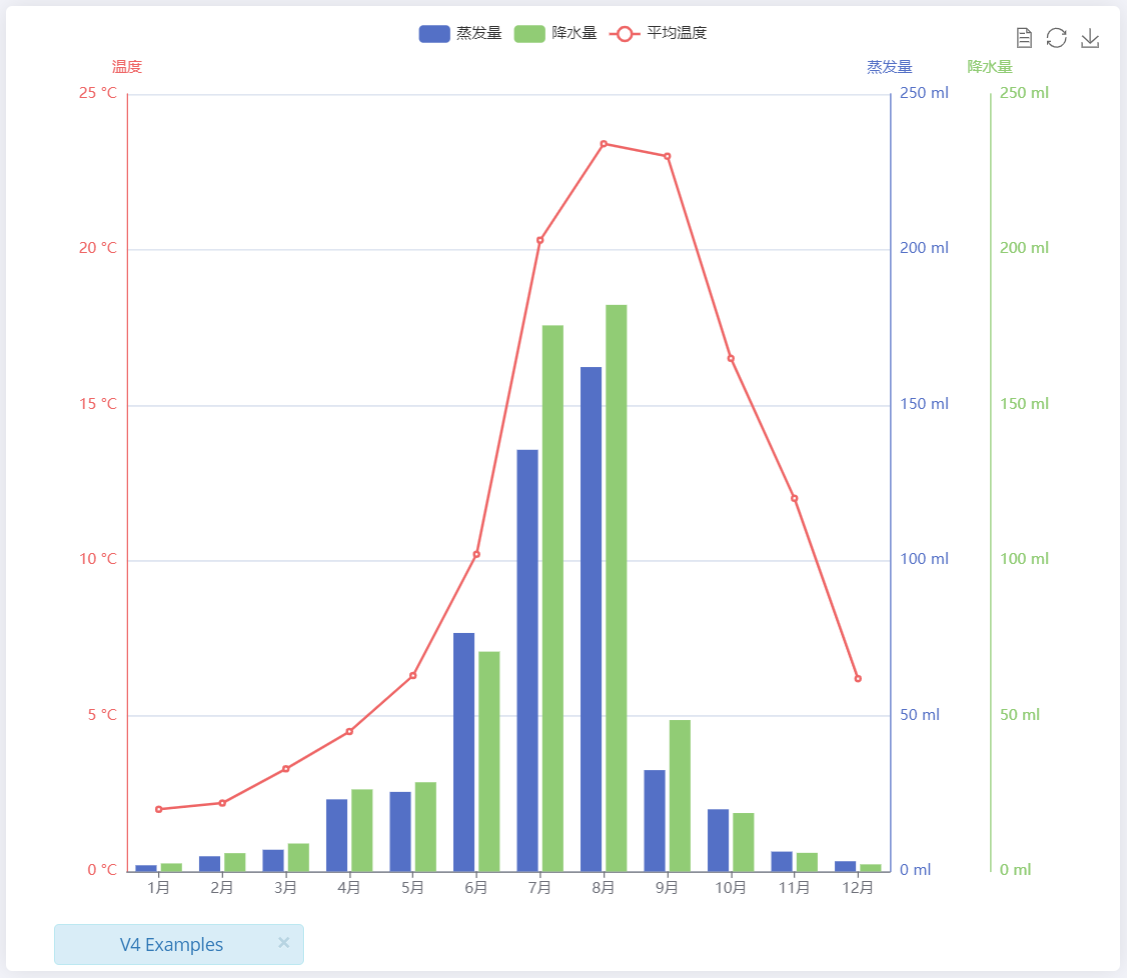
The chart used in this repository is the exact copy of this example from the ECharts website: Multiple Y-Axis Chart. I did not modify the example in any way.
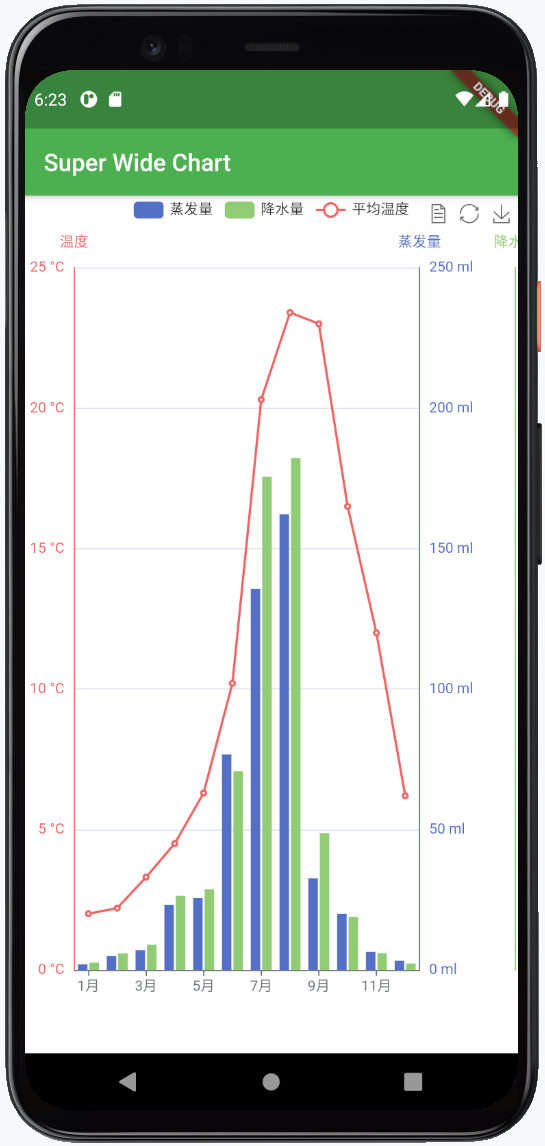
The main problem is that the third (GREEN) axis is not actually visible in the app.
This is probably caused by the offset on that axis, which in this case is not avoidable, since we have so many axes on this chart.
Resizing or applying a scale on the parent Flutter container in any possible way didn't help. It just makes the chart smaller, but the green axis is still cut off.
Please help me if you know how to fix this issue.
| Desired result (a screenshot from the ECharts website): | How it actually appears in the application: |
|---|---|
 |
 |
Accidental duplicate