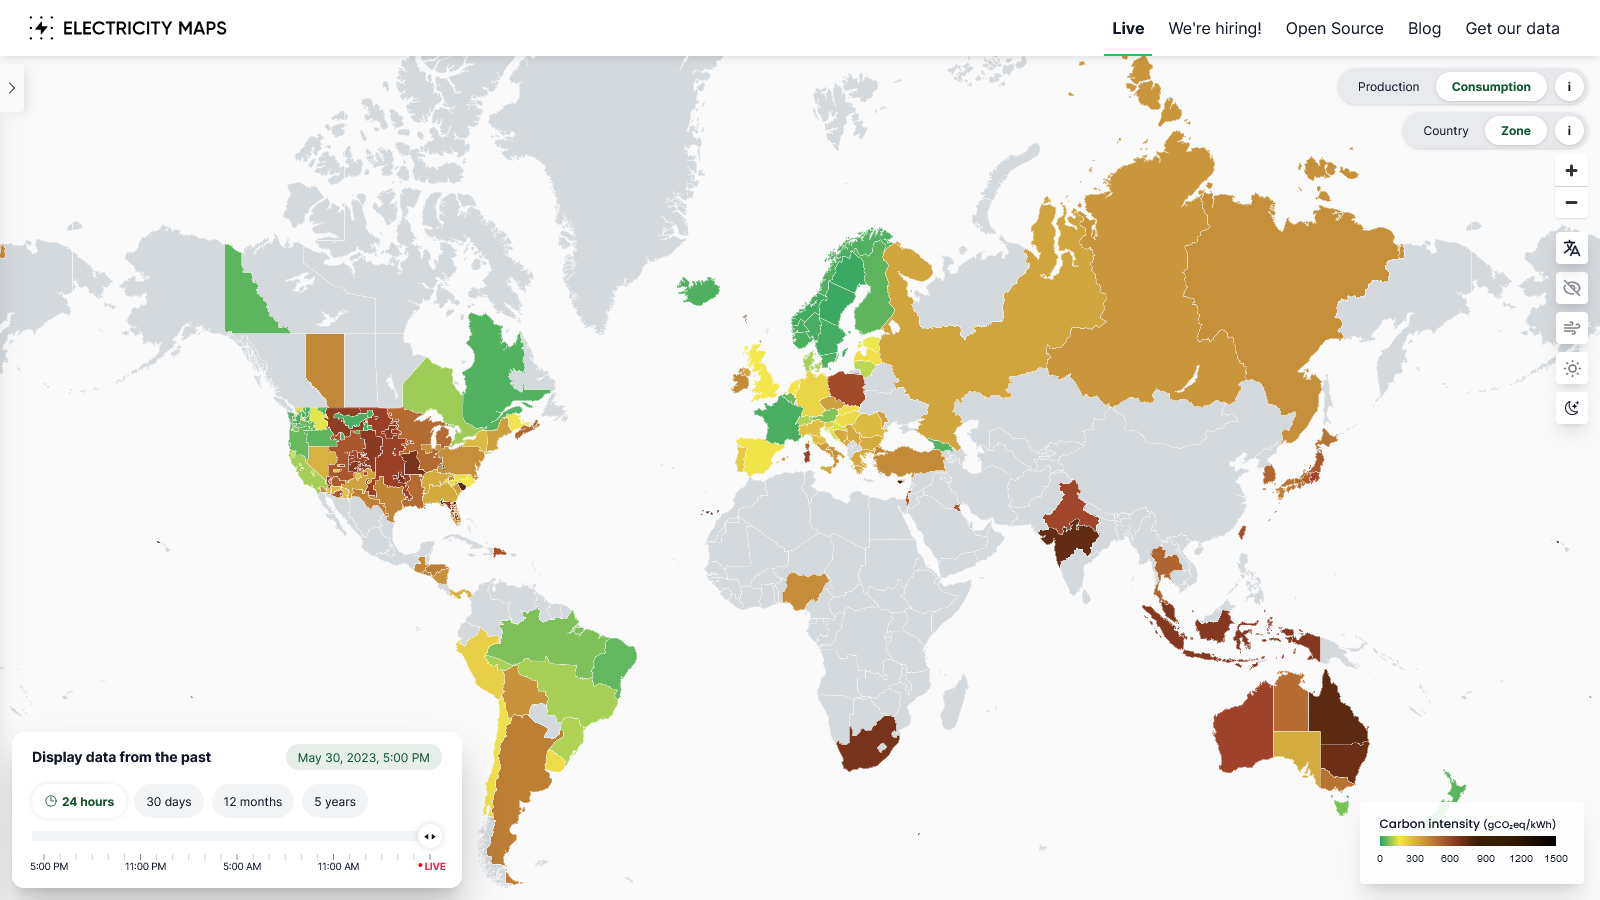
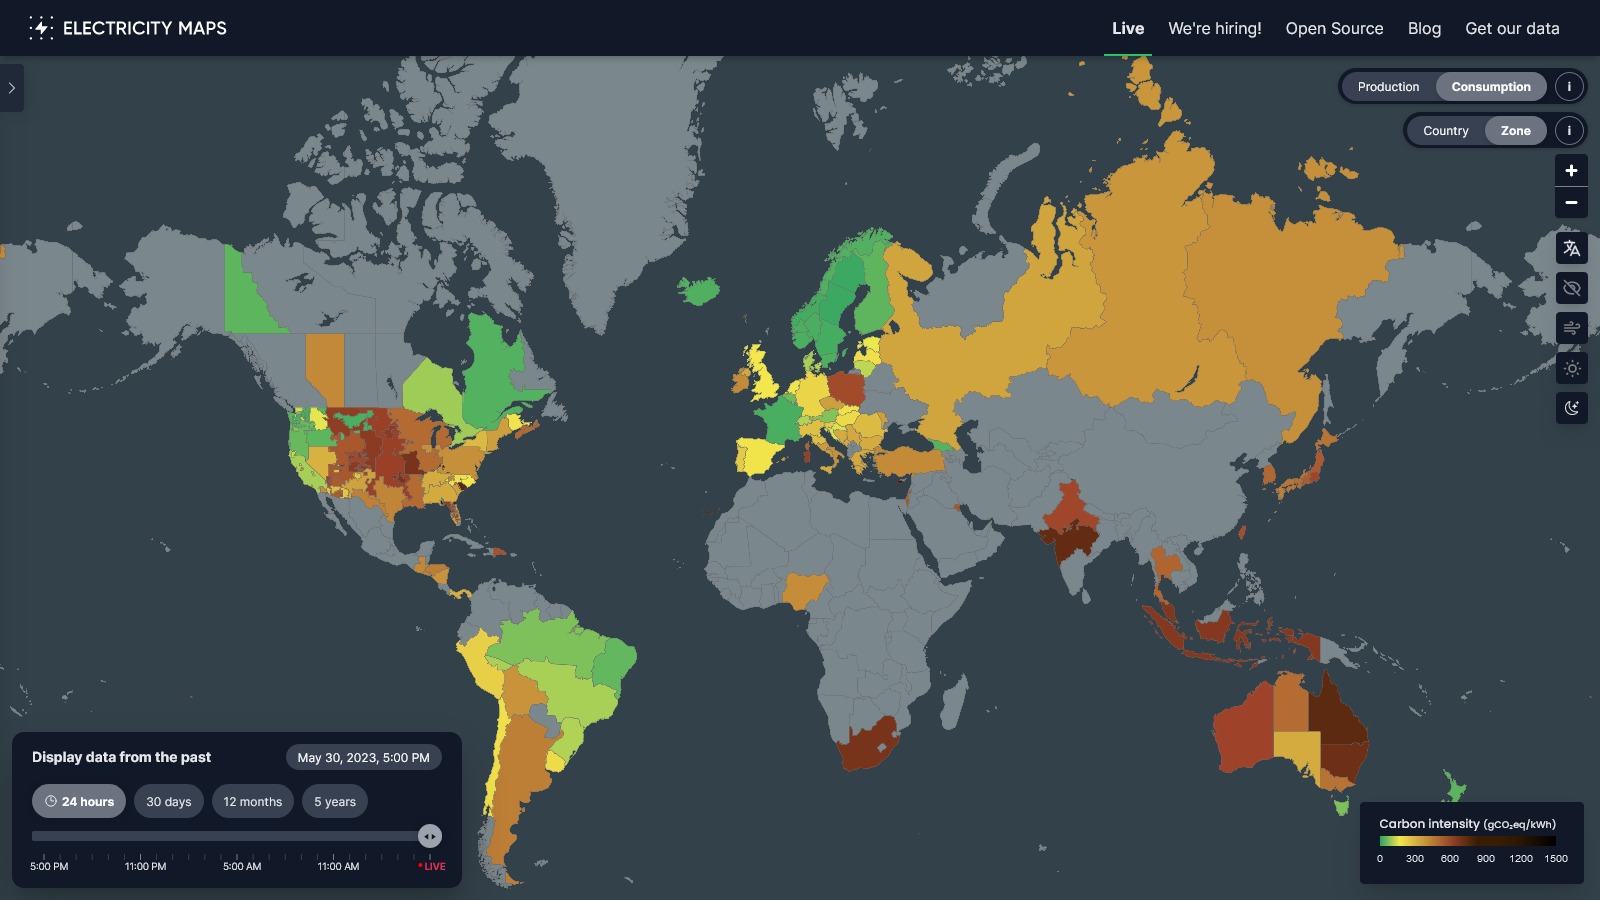
A real time and historical visualisation of the Greenhouse Gas Intensity (in terms of CO2 equivalent) of electricity production and consumption around the world.
app.electricitymaps.com »
This project aims to provide a free, open-source, and transparent visualisation of the carbon intensity of electricity consumption around the world.
We fetch the raw production data from public, free, and official sources. They include official government and transmission system operators' data. We then run our flow-tracing algorithm to calculate the actual carbon intensity of a country's electricity consumption.
Try it out at app.electricitymaps.com, or download the app on Google Play or App store.
The Electricity Maps app is a community project and we welcome contributions from anyone!
We are always looking for help to build parsers for new countries, fix broken parsers, improve the frontend app, improve accuracy of data sources, discuss new potential data sources, update region capacities, and much more.
Read our contribution guidelines to get started.
Use these channels to be part of the community, ask for help while using Electricity Maps, or just learn more about what's going on:
- Slack: This is the main channel to join the community. You can ask for help, showcase your work, and stay up to date with everything happening.
- GitHub Issues: Raise any issues you encounter with the data or bugs you find while using the app.
- GitHub Discussions: Join discussions and share new ideas for features.
- GitHub Wiki: Learn more about methodology, guides for how to set up development environment, etc.
- FAQ: Get your questions answered in our FAQ.
- Our Commercial Website: Learn more about how you or your company can use the data too.
- Our Blog: Read about the green transition and how Electricity Maps is helping to accelerate it.
- Twitter: Follow for latest news
- LinkedIn: Follow for latest news
This repository is licensed under GNU-AGPLv3 since v1.5.0, find our license here. Contributions prior to commit cb9664f were licensed under MIT license
We also have a lot more questions answered on app.electricitymaps.com/faq!
Where does the data come from? The data comes from many different sources. You can check them out here
Why do you calculate the carbon intensity of consumption? In short, citizens should not be responsible for the emissions associated with all the products they export, but only for what they consume. Consumption-based accounting (CBA) is a very important aspect of climate policy and allows assigning responsibility to consumers instead of producers. Furthermore, this method is robust to governments relocating dirty production to neighboring countries in order to green their image while still importing from it. You can read more in our blog post here.
Why don't you show emissions per capita? A country that has few inhabitants but a lot of factories will appear high on CO2/capita. This means you can "trick" the numbers by moving your factory abroad and import the produced good instead of the electricity itself. That country now has a low CO2/capita number because we only count CO2 for electricity (not for imported/exported goods). The CO2/capita metric, by involving the size of the population, and by not integrating all CO2 emission sources, is thus an incomplete metric. CO2 intensity on the other hand only describes where is the best place to put that factory (and when it is best to use electricity), enabling proper decisions.
CO2 emission factors look high — what do they cover exactly? The carbon intensity of each type of power plant takes into account emissions arising from the whole life cycle of the plant (construction, fuel production, operational emissions and decommissioning). Read more on the Emissions Factor Wiki page.
How can I get access to historical data or the live API? All this and more can be found here. You can also visit our data portal to download historical datasets.


