This repo takes the data I collected for a project in my Intro to Statistics course my freshman year and assesses it more in-depth. Most of the results are printed/commented in MD in the notebook. For more information about the context of this project, read below in Project Overview.
Notebook is cells of all procedural coding. No classes & hardly any functions are defined. However, the code is well commented, so it should be easy to follow.
During my first college statistics course, I decided to look at used-car sale values between two cars that still flood the streets of Denver: a Jeep Liberty, and a Subaru Outback. I originally wanted to look at earlier models (2002-2007), because those are actually a lot more common, but the website I used for the data collection (cargurus.com) didn't sell cars that old. So, I settled for the 2008s.
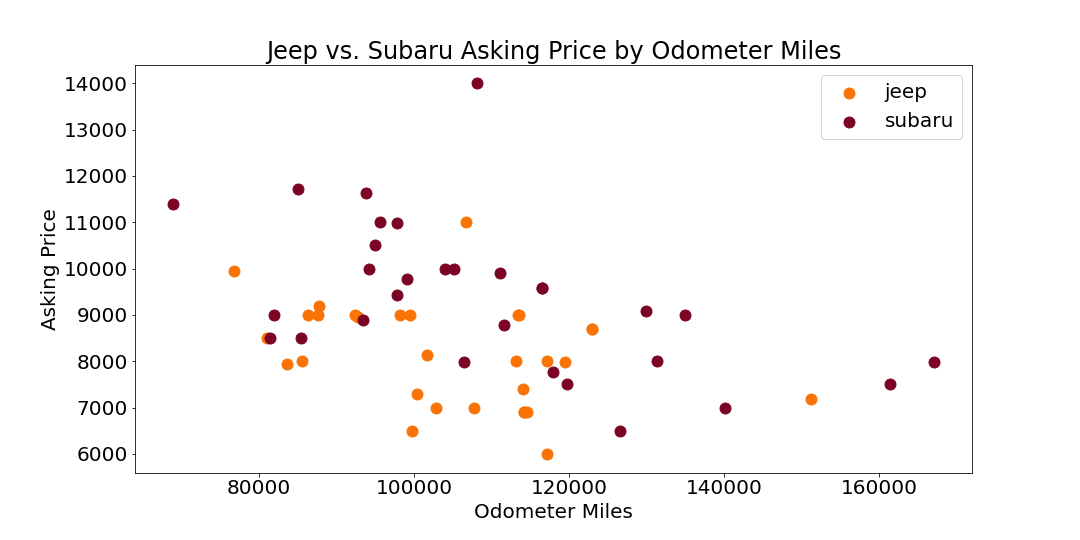
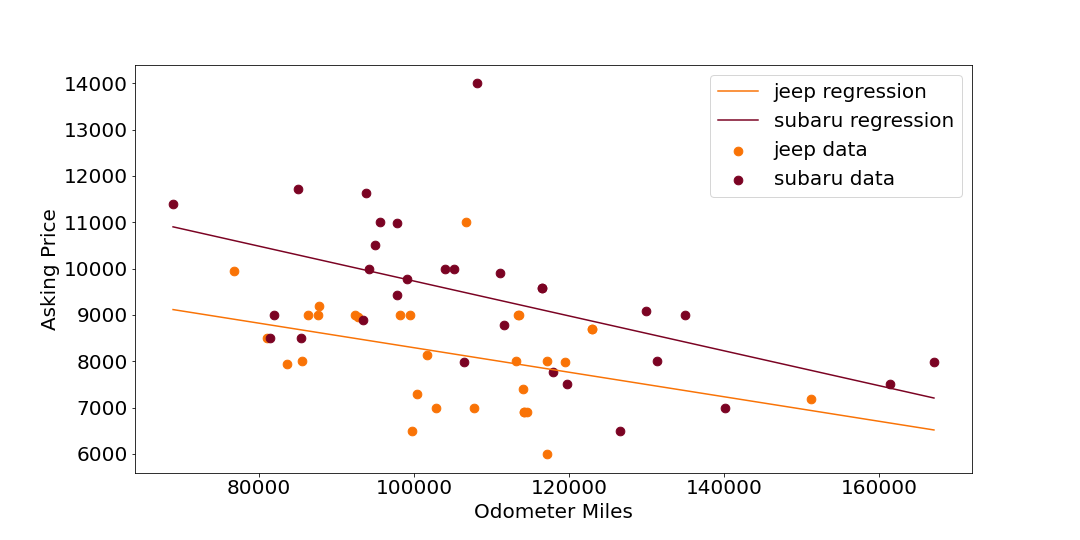
The initial project was a simple analysis of the means and standard deviations for used sales prices between the two cars. However, I decided to keep track of other information such as mileage because I thought it would be interesting to explore the correlations between milage and asking price. In the end I calculated some basic descriptive statistics (means, stds, etc.), ran a t-test or two, and put it on a poster to present for the class.
But then over a year later, after I began to take interest in coding and data science, I decided to open the data back up and work with it on python. I spent a couple hours cleaning the data and teaching myself how to access and utilize data in .csv files through Python. I learned a little bit, but I began to encounter some obstacles that were especially hard to tackle because I lacked the foundational knowledge of Python and CS in general to apply the ideas I had for the data. So, I met up with @mathematicalmichael and we spent all of a Saturday afternoon executing analyses and building matplotlib plots to represent the results. The project has been a work-in-progress since then.
Why pick these Jeeps and Subarus, though?
As I mentioned above, Jeeps and Subarus are charactaristic vehicles of Colorado, and the Libertys and Outbacks seemed perfect: they shared enough common ground that they were playing in the same playing field, yet enough differences that it was worth a competition.
- both have some form of AWD system (see differences)
- both have more clearance than the average sedan
- both are mid-size vehicles
- both have a hatchback (the trunk is not separate from the main cab)
- Subarus are Japanese makes, while Jeeps are American makes
- The Subaru Outbacks have AWD, while the Jeep Libertys have 4WD (yes--there is a distinct difference)
- The Subaru Outbacks obtain slightly higher gas mileage than Jeep Libertys
- The Jeep Libertys--with 4WD and a higher clearance--are more equipped for off-roading
The two vehicles seemed comparable enough, and thus the result of this comparison was the following null-hypothesis:
There is no statistically significant difference between the used asking-price of 2008 Subaru Outbacks and 2008 Jeep Libertys.
Despite the statement of the null-hypothesis, I did predict that the Subarus would have a higher value due to one main factor: reliability. As a Colorado native I grew up driving and riding in old Jeeps--and I loved them to death--but they seemed to break down nearly religiously. Not only this, but their transmissions seemed to go out at ~120k miles like clockwork; and, when people's transmissions go out, they sometimes tend to sell their cars.
Luckily I still have the original documents that I submitted for the class, because the process I used for collecting the data was absurdly strict and complicated. It did, however, do a relatively good job creating a strong randomization in the study.
- Label states 1-50 in alphabetical order. Perform a simple random sample until 30 sample states have been selected.
- Find CarGuru location for the state. If there are multiple locations in state, do SRS with the states ordered 1-x as read top-bottom on the website and select the location that the SRS elects. If there is no CarGuru in the state, do a 1-50 SRS until a state that has not yet been selected is drawn, then use that state to replace the aforementioned state in the sample. Record the zip code for each location.
- Plug the previously selected zip code into CarGuru with 50 mile radius with search criteria: 2008 Subaru Outback; and 2008 Jeep Liberty, respectively.
- Select first vehicle that matches criteria; record price and odometer reading.
- CRITERIA: Must be within state. Must be a 2008 model. Select the first vehicle (top-bottom reading of website) between 80,000 and 120,000 miles. If none within that range appear with the search criteria, pick the next closest odometer reading. No Subaru Outback XTs.
- Repeat steps 3 and 4 with each zip code in the size-30 sample.
- Perform analysis...
Most of the data analysis for this project was exploratory. Although I was still pursuing the original goal of exploring how the two cars matched up against eachother, I was also enjoying simply learning about Python and modules in Python (e.g. Numpy, Pandas, Matplotlib, etc.), while also synthesizing the knowlege I had about statistics and data analysis with my developing CS skills.
All data analysis was accomplished using Python & Python modules. Data display & visualization were executed using Pandas and Matplotlib; distributions, t-tests, & linear regression were accomplished utilizing Numpy & Scipy.stats. All of the data analysis was co-completed by djdebonis (David J DeBonis) & mathematicalmichael (Michael Pilosov).
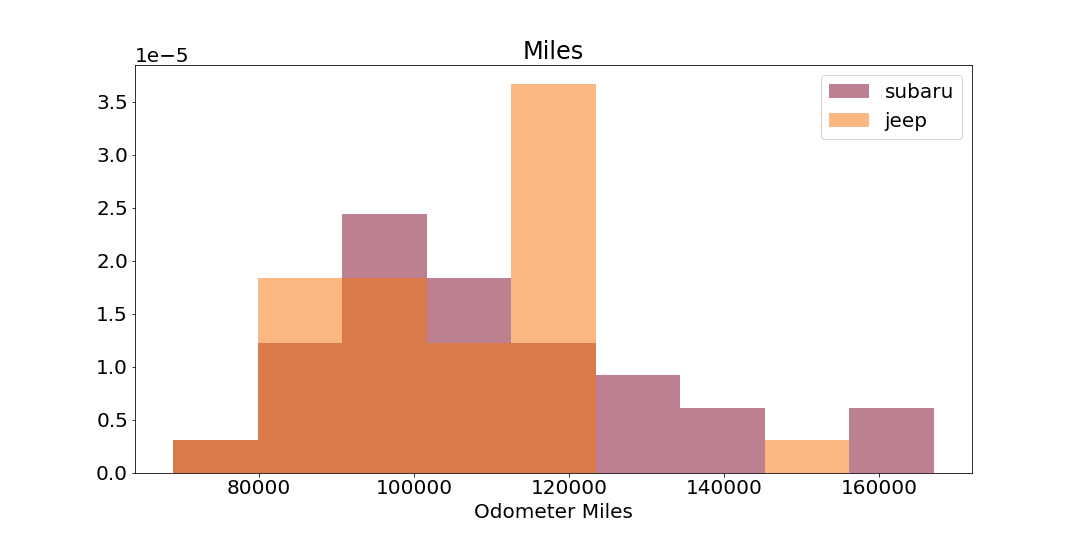
From the sample data set, 30 2008 Jeep Libertys and 30 2008 Subaru Outbacks from similar zip codes in 30 states were analyzed. The Jeep Libertys had a mean odometer reading of 104626.97 miles with a standard deviation of 16025.69 miles; the Subaru Outbacks had a mean odometer reading of 109269.37 miles with a standard deviation of 22754.72 miles. A 2-sample t-test (p < 0.10) between the mean odometer readings of the Jeep Libertys and the Subaru Outbacks determined that there is not enough evidence to support that there is a statistically significant difference between the odometer readings (t-stat = 0.9136; p = 0.3647). Therefore, we can proceed with the assumption that odometer reading was not a major confounding variable in the experiment, and thus that diferences in asking price are likely due to other factors.
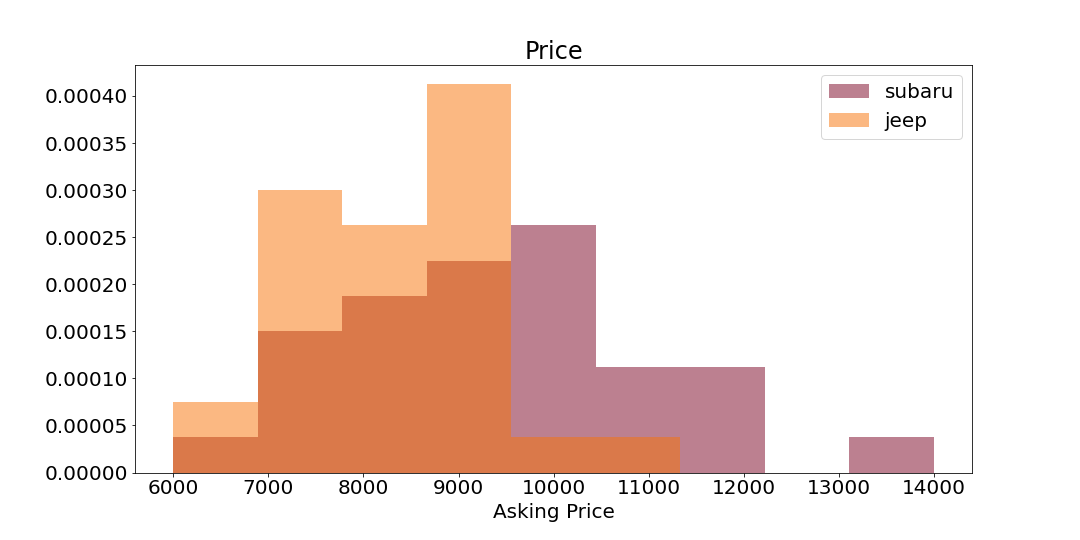
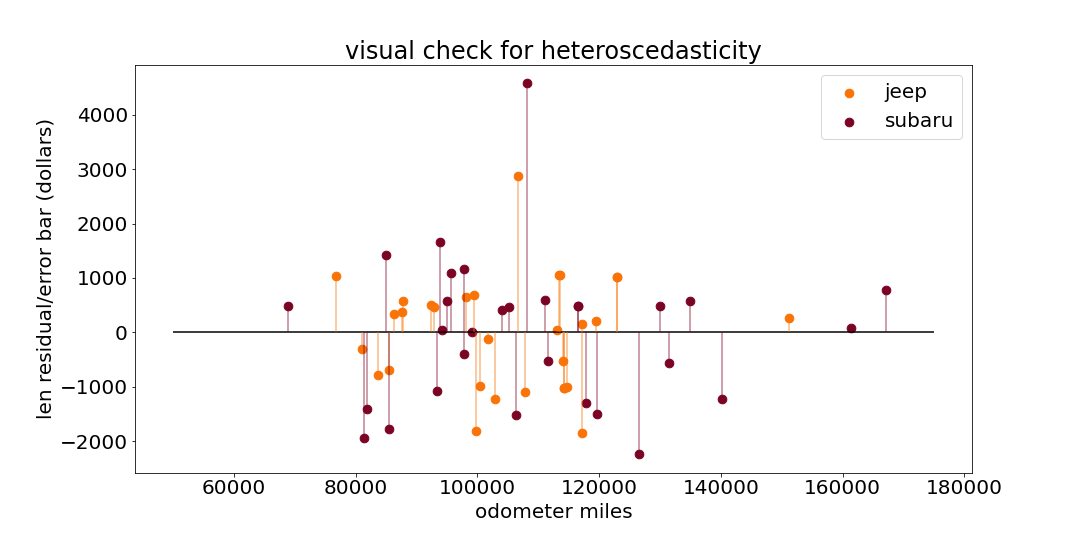
The Jeep Libertys had a mean asking price of $8169.23 with a standard deviation of $1112.19, while the Subarus had a mean asking price of $9381.53 with a standard deviation of $1618.68. Although there is a clear difference in the mean asking prices, there is also a clear difference in the standard deviations. However, when the asking price standard deviations are compared with the odometer reading standard deviations, the proportion of standard deviations from Jeep to Subaru for price (0.68709) and for mileage (0.70427) are almost identical; this shows that the fact that the Subarus have a larger standard deviation (wider spread) of price than the Jeeps is likely not because of some inherent factor in the car or the market, but can instead be explained almost entirely by the odometer differences that happened to come through on this sample.
