This repository contains Dockerfile of Graylog2 for Docker's automated build published to the public Docker Hub Registry.
Specifically, contains:
Need external ElasticSearch instance.
- Why this Docker?
- Installation
- Usage
- Persisting data
- Graylog2 web: get started
- Send logs from Symfony2 to Graylog2 server
- OS X & boot2docker
Both Kibana and Graylog2 are great tools for real time data analytics. We wanted to test each product with a unique ElasticSearch instance:
- All logs are sent to Graylog2 server
- Graylog2 server sends logs into ElasticSearch
- Both Kibana and Graylog2 web fetch same data from ElasticSearch

-
Install Docker.
-
Download automated build from public Docker Hub Registry:
$ docker pull arcus/kibana
$ docker pull himedia/elasticsearch
$ docker pull himedia/graylog2
Alternatively, you can build an image from Dockerfile:
$ docker build -t="himedia/graylog2" github.com/Hi-Media/docker-elasticsearch
$ docker build -t="himedia/graylog2" github.com/Hi-Media/docker-graylog2
Launch all 3 Docker containers:
$ ./graylog2-kibana-run.shOr manually:
$ ES_ID=$(docker run -d -p 9200:9200 -p 9300:9300 himedia/elasticsearch)
$ ES_IP=$(docker inspect --format '{{ .NetworkSettings.IPAddress }}' ${ES_ID})

$ docker run -d -p 8080:80 -e "ES_HOST=localhost" -e "ES_PORT=9200" arcus/kibana

$ docker run -d -p 9000:9000 -p 12201:12201 -p 12201:12201/udp -p 12900:12900 -p 27017:27017 -p 28017:28017 \
    -e "ES_CLUSTER_NAME=graylog" -e "ES_CLUSTER_HOSTS=$ES_IP:9300" himedia/graylog2
URLs:
- ElasticSearch:
http://localhost:9200/_cluster/health?pretty=true - Kibana:
http://localhost:8080/index.html#/dashboard/file/default.json - MongoDB:
http://localhost:28017/ - Graylog2 web, after few seconds (admin/admin):
http://localhost:9000/
- Logs sent to ElasticSearch via Graylog2 server are stored into
/datavolume. - Kibana's dashboards are saved into ElasticSearch
- Graylog2's dashboards are save into MongoDB, on the same container, into
/var/lib/mongodbvolume.
Mounting data directories:
$ ./graylog2-kibana-run.sh --es-data=<host-dir> --mongodb-data=<host-dir>First steps are not trivial…
-
➟
System➟Inputs➟ selectGELF TCPas input type ➟ click onLaunch new input➟ port 12201, bind address 0.0.0.0 ➟ click onLaunch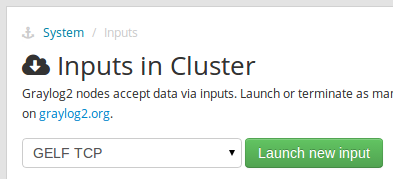
-
Same with
GELF UDPas input type
-
➟
Streams➟ click onCreate stream➟ fill title and click onCreate stream and continue -
click on
Add stream rule➟ Field: "source", Type: "match exactly", Value "example.org" ➟ click onSave➟ click onI'm done!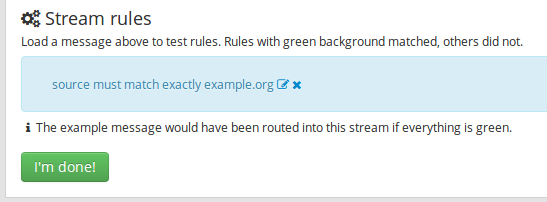
-
click on
Action➟Resume this stream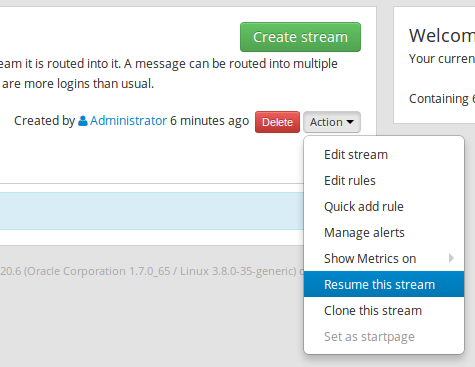
-
click on
Action➟Manage alerts➟ selectMessage count conditionand click onConfigure new alert condition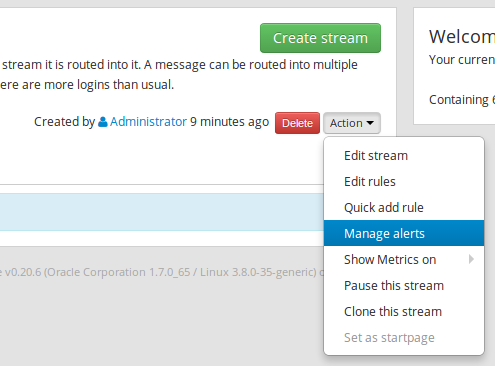
-
Fill "New alert condition" form, then click on
Add alert condition: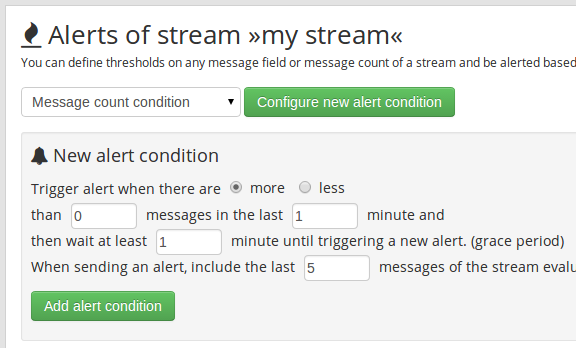
-
Configure Alert receivers filling
Email address➟ click onSubscribe➟ click onSend test alert
On host:
-
TCP test:
$ echo -e '{"version": "1.1","host":"example.org","short_message":"A short message that helps you identify what is going on","full_message":"Backtrace here\n\nmore stuff","level":1,"_user_id":9001,"_some_info":"foo","_some_env_var":"bar"}\0' | nc -w 1 127.0.0.1 12201
-
UDP test:
$ echo '{"version": "1.1","host":"example.org","short_message":"A short message that helps you identify what is going on","full_message":"Backtrace here\n\nmore stuff","level":1,"_user_id":9001,"_some_info":"foo","_some_env_var":"bar"}' | nc -w 1 -u 127.0.0.1 12201
Messages must appear on Graylog2 web. Click on magnifying glass if needed. Mail must have been sent.
Send logs from Symfony2 to Graylog2 server
Add following to composer.json:
"graylog2/gelf-php": "dev-master"Then:
$ composer update graylog2/gelf-phpIn config.yml:
monolog:
    handlers:
        main:
            type:      gelf
            publisher: { hostname: 127.0.0.1, port: 12201 }
Finally:
$this->get('logger')->notice('Hello notice…');If you are using boot2docker (VM boot2docker-vm) in Mac OS X, use below scripts to forward docker VM host ports to OS X host.
Use boot2docker poweroff before you perform below tasks.
# VM must be powered off
for i in 8080 9000 9200 27017 28017; do
 VBoxManage modifyvm "boot2docker-vm" --natpf1 delete "tcp-port$i";
 VBoxManage modifyvm "boot2docker-vm" --natpf1 delete "udp-port$i";
done
or execute vb_ports_forwarding.sh bash script.
Execute delete_vb_ports_forwarding.sh to delete the forwarded ports from docker VM host to OS X.
Now, restart boot2docker-vm again by executing boot2docker up.
For running Kibana, you might also have to do boot2docker ssh -L 9200:localhost:9200
to create a SSH tunnel between docker VM host and mac osx (localhost).
Use boot2docker ip to get the IP and access it via this IP.