![]()

This extension supports full jest features in vscode environment to make testing more intuitive and fun. It should work out-of-the-box for most common jest projects. To get started:
- Setup jest in your project if you haven't.
- install "Jest" extension in vscode.
- reload or restart vscode
If the extension can find the jest command, by default it will automatically run and monitor all tests in watch mode upon launch, and you should see tests, status, errors, coverage (if enabled) in TestExplorer and editors like this:

If you have a more sophisticated project configuration or prefer to run tests differently, fear not, the extension supports extensive customization settings. For example:
- you can use jest.jestCommandLine to tell the extension to use
yarn testinstead of the default jest command. - you can use jest.autoRun to optimize performance and control when the extension should run your tests.
- you can use the extension with monorepo projects, see monorepo project support for details.
You can see the full features and learn more details in the How-To section. If you encounter an unexpected error, feel free to checkout the Troubleshooting or file an issue.
Happy testing!
Pre-Release: v4.7.0
- expand the "jest.shell" setting to support LoginShell config. This can resolve the runtime environment issues due to vscode incomplete initialization, which often showed
env: node: No such file or directoryorenv: yarn: No such file or directory. - Enhance troubleshooting for resolve runtime environment issues.
Stable: v4.6.0
- added a new setting "jest.showTerminalOnLaunch" to control if test explorer terminal should be automatically opened upon launch. Default is true.
- refactor README
4.4.0
Interactive run has been extended to watch mode in v4.4.0. Users in watch mode can now run any test/folder/workspace interactively just like with non-watch mode.
Other features:
-
debug config v2
expand for detail
This release introduced debug config v2, which changed how we inject jest runtime information, such as test file and name, to the debug config. Replacing the "behind-the-scene-injection" with a "variable-substitution" model, so no more hidden operations and surprises, the extension will only substitute the jest specific variables present in the config.
A default jest debug config in v2 will look like this:
{
"type": "node",
"name": "vscode-jest-tests.v2",
"request": "launch",
"program": "${workspaceFolder}/node_modules/.bin/jest",
"args": [
  "--runInBand",
  "--watchAll=false",
  "--testNamePattern",
  "${jest.testNamePattern}",
  "--runTestsByPath",
  "${jest.testFile}"
],
"cwd": "${workspaceFolder}",
"console": "integratedTerminal",
"internalConsoleOptions": "neverOpen",
"disableOptimisticBPs": true,
"windows": {
  "program": "${workspaceFolder}/node_modules/jest/bin/jest"
}
}
Jest like vscode variables, the
"${jest.testNamePattern}"and"${jest.testFile}"are jest specific variables and, if present, will be substituted by the extension upon debugging. Note the config name change:"vscode-jest-tests.v2", which signal the extension to use the substitution mode.This change is backward compatible. All existing config (with
"vscode-jest-tests") will continue to function as before.More info see Debug Config v2
-
supports
vuefile testing -
enhanced test output discovery by automatically opening TestExplorer terminal upon launch.
-
enhance run/debug tests with quotes in the name.
-
update documentations and a few bug fixes.
More details see v4.4.0 release
v4.2.1
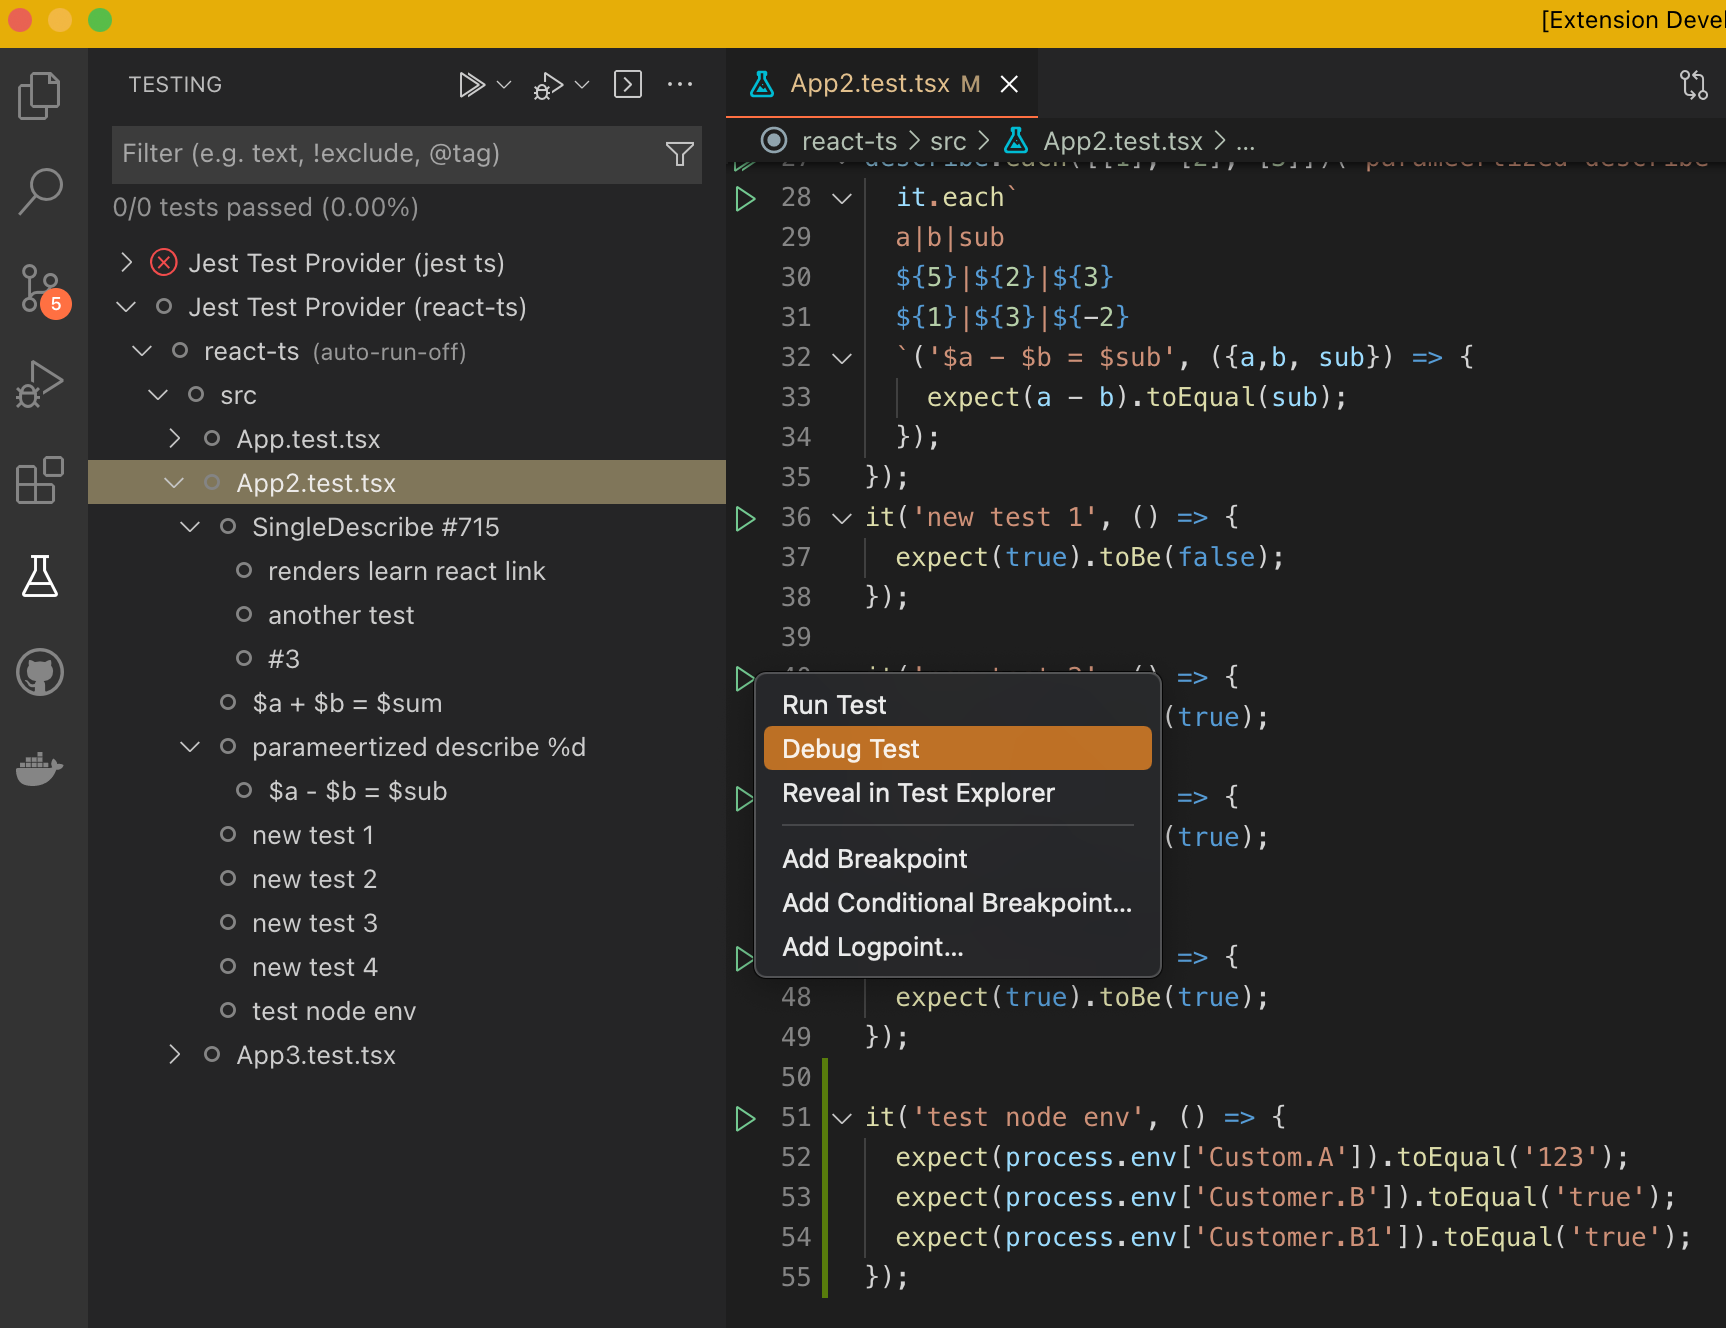
Test menu is now accessible for all tests, regardless of run mode. If cursor jumping when editing tests is a bit annoying, you can now alternatively disable the DebugCodeLens and use "Debug Test" from the test menu:
For users struggled with the jest process environment, this release added 2 new settings to
- modify nodejs process env (
"jest.nodeEnv") - use custom shell when spawning jest process (
"jest.shell")
Also fixed inline error pop-up in vscode 1.61, and enhanced snapshot language support.
more info see v4.2.1 release
v4.1 with Test Explorer
Test explorer is one of the highly requested feature for this extension. Last year vscode announced the plan for the official test explorer and we have been trying out the new proposed API since. Now the vscode test explorer is live (2021 July release - v1.59), we are excited to release v4.1 and our users can finally tap into this great new UI experience 🎉

Please note, the test explorer is new and some of the features might be missing or imperfect (see How to use test explorer for more details), nevertheless, we will continue to improve it. Please do not hesitate to ask questions or file issues, thanks and have fun!
v4 Release
After longer than expected development, v4 is finally released! 😄
This is a big release packed with changes to address many nagging issues you have been asking for, such as inconsistent test status indicators, high CPU usage, more granular control of the test runner, missing coverage, supporting parameterized tests, mysterious start up failure etc.
Knowing the scope of the changes is significant, while we tried to test it as much as we can, there are probably still some rough edges we have not discovered. If it interrupted your work, our apology! You can either look up on the document below to see if you can find a workaround; or revert to the earlier version. Please do not hesitate to file issues or ask questions in discussions, we will be monitoring them closely and address issues as best we can.
Feel free to read more about the features and migration or come chat with us in the release discussion for general comments or questions about this release.
P.S. We find the new version did made the development of this extension a bit easier (yes, we do eat our own dog food 🐶), hopefully, it will do the same for your project. Happy coding!
Content
- vscode-jest
- Starts Jest automatically when you're in a root folder project with Jest installed.
- Show individual fail / passes inline.
- Show fails inside the problem inspector.
- Highlights the errors next to the
expectfunctions. - Adds syntax highlighting to snapshot files.
- A one button update for failed snapshots.
- Show coverage information in files being tested.
- Help debug jest tests in vscode.
- Supports multiple test run modes (automated, manual, and hybrid onSave) to meet user's preferred development experience.
- Track and shows overall workspace/project test stats
Simply open Jest - Visual Studio Marketplace and click "Install". Alternatively open Visual Studio Code, go to the extension view and search for "Jest".
For detailed releases and migration help, please see releases.
The extension starts jest on behave of the user, therefore a valid Jest command is the minimal required info.
-
default jest command This extension can automatically start the jest process without any custom configuration if:
- it finds Jest installed in the workspace:
node_modules/.bin/jest - it finds the workspace has been bootstrapped with create-react-app:
node_modules/react-scripts/node_modules/.bin/jestornode_modules/react-native-scripts
- it finds Jest installed in the workspace:
-
custom jest command
- if no default jest command is found, the extension will fail unless a custom jest command is configured.
- user can set custom jest command with jest.jestCommandLine setting, for example
"jest.jestCommandLine": "yarn test". - or to use the Setup Wizard via command
"Jest: Setup Extension (Beta)".
By default, users need not do anything, the extension will automatically trigger related test run when needed by running jest in the watch mode. However, this can be easily changed if more granular control is desired. Below shows the execution models supported and how to use jest.autoRun to opt into it:
fully automated
No need to manually trigger any test run, all changes will be monitored and related tests will be run accordingly. It is basically running jest with --watch or --watchAll. This is the default mode prior to v4. Example:
"jest.autoRun": {"watch": true}=> will start the jest with the watch flag and leave all tests at "unknown" state until changes are detected."jest.autoRun": {"watch": true, "onStartup": ["all-tests"]}=> will start running all tests upon project launch to update overall project test stats, followed by the jest watch for changes.
interactive mode
Allow users to control test run completely either through commands/menu/TestExplorer manually or use vscode's onSave event to automate related test runs:
- fully manual
- there will be no automatic test run, users will trigger test run by either command or context-menu.
- Example:
"jest.autoRun": "off"
- automatically run tests when test file changed
- the extension will trigger test run for the given test file upon save.
- Example: "jest.autoRun":
{"watch": false, "onSave": "test-file"}
- automatically run tests when either test or source file changed:
- the extension will trigger test run for the given test or source file upon save.
- Example: "jest.autoRun":
{"watch": false, "onSave": "test-src-file"}
Note: other than the "off" mode, users can specify the "onStartup" option for any "jest.autoRun" config, for example: {"watch": false, "onSave": "test-file", "onStartup": ["all-tests"]}
A test can be debugged via the debug codeLens appeared above the debuggable tests. Simply clicking on the codeLens will launch vscode debugger for the specific test. The extension also supports parameterized tests and allows users to pick the specific parameter set to debug.
The simplest use cases should be supported out-of-the-box. If VS Code displays errors about the attribute program or runtimeExecutable not being available, you can either use setup wizard to help or create your own debug configuration within launch.json. See more details in Customization - Debug Config.
Illustration
For parameterized tests, you might see debug codeLens like Debug (2), which indicated there are 2 test candidates can be debugged. In such case, you will be prompted to choose when clicking the debug codeLens. All failed test results will appear in both the hovering message panel and the PROBLEMS area.

By default debug codeLens will appear for failed and unknown tests, to change that and others, please see customization for more details.
Code coverage can be triggered via Command Palette, select command like Jest: Toggle Coverage to activate or deactivate code coverage (see full list in commands. The coverage state is also shown in the StatusBar:

How to read coverage scheme and customize it
In addition to the coverage summary that is shown on the top of the file, each line will be marked by its coverage status according to the coverage formatter configured. There are 3 types of coverage you might see in your source code, distinguished by colors:
- "covered": if the code is covered. Either not marked or "green" by default, depends on the formatter.
- "not-covered": if the code is not covered. Marked as "red" by default.
- "partially-covered": Usually this mean the branch (such as if, switch statements) only partially tested. Marked as "yellow" by default.
- Please note, istanbuljs (the library jest used to generate coverage info) reports switch branch coverage with the first "case" statement instead of the "switch" statement.

You can customize coverage start up behavior, style and colors, see customization for more details.
--watch flag), where only changed files/tests are run (see jestjs/jest#1284).
The recommended approach is to setup the monorepo project as a multi-root workspaces in vscode. This is a simple one time setup that add each sub package as a "folder" in the workspace.
You can use jest.disabledWorkspaceFolders setting to exclude non-jest folders, if needed.
Note: While you can use jest projects to run all tests without multi-root workspaces, you won't be able to take advantage a more fine grained control such as toggle coverage for a specific package instead of all packages.
StatusBar shows 2 kinds of information:
Jest shows the mode and state of the "active" workspace folder.
Jest-WS shows the total test suite stats for the whole workspace.
Clicking on each of these button will reveal the OUTPUT channel with more details.
Illustration
 shows the active workspace has coverage on.

shows the active workspace has onSave for test file only, and that the workspace stats is out of sync with the code, such as when the source file is changed but the related tests are not run yet.

shows the autoRun will be triggered by either test or source file changes.
Users with vscode v1.59 and vscode-jest v4.1 and up will start to see tests appearing in the test explorer automatically. Test explorer provides a "test-centric" view (vs. "source-centric" view in the editors), allows users to run/debug tests directly from the explorer (in addition to the inline debug codeLens), and provides a native terminal output experience (with colors!):
You can further customize the explorer with jest.testExplorer in settings.
However, test explorer is new and some features are still work-in-progress or not available yet:
- can't turn on/off coverage yet (pending on vscode API change)
- not able to accurately indicate run/debug eligibility on the item level, this means you might not be able to run/debug some items through run/debug buttons. (pending on vscode API change)
- the tests stats on the top of the explorer might not be accurate, especially for multiroot workspaces. (pending on vscode fix))
- for watch-mode workspaces, the run button is turned off since tests will be automatically executed.
- debug can only be executed for the test blocks, not on the file or folder level. (Please let us know if you have an use case otherwise)
It is usually helpful to see the actual command and shell environment the extension spawned for your project. You can see them in the developer console (via Help > Toggle Developer Tools menu), for example to examine the PATH environment variables: look for the "spawn" log, expand the "options" object, expand "env" property, all env variables (inherited from vscode process) should be there (view animation).
You can also see process output in the following methods:
- The color coded process output terminal from TestExplorer. If it is not open or not updated, you can manually open it from TestExplore view (the square arrow icon on the top of the Explorer View)
- Otherwise you can see the output in "OUTPUT" channel, which is usually named after the workspace folder, such as
Jest (your-workspace-name). Or you can click onJestlabel on status bar to show Jest Output window. This will show you the jest run output and the errors.
You can also turn on the debug mode to see more internal debugging message in the developer console:
- set
"jest.debugMode": truein.vscode/settings.json
Users can use the following settings to tailor the extension for their environments.
- All settings are prefixed with
jestand saved in standard.vscode/settings.json. - settings crossed out are to be deprecated in the future
- settings marked with 💼 apply to the whole project, otherwise per workspace.
| setting | description | default | example/notes |
|---|---|---|---|
| Process | |||
| autoEnable ❌ | Automatically start Jest for this project | true | Please use autoRun instead |
| jestCommandLine | The command line to start jest tests | undefined | "jest.jestCommandLine": "npm test -" or "jest.jestCommandLine": "yarn test" or "jest.jestCommandLine": "node_modules/.bin/jest --config custom-config.js" |
| nodeEnv | Add additional env variables to spawned jest process | null | "jest.nodeEnv": {"PORT": "9800", "BAR":"true"} |
| shell | Custom shell (path or LoginShell) for executing jest | null | "jest.shell": "/bin/bash" or "jest.shell": "powershell" or "jest.shell": {"path": "/bin/bash"; args: ["--login"]} |
| autoRun | Controls when and what tests should be run | undefined | "jest.autoRun": "off" or "jest.autoRun": {"watch": true, "onStartup": ["all-tests"]} or "jest.autoRun": false, onSave:"test-only"} |
| pathToJest ❌ | The path to the Jest binary, or an npm/yarn command to run tests | undefined | Please use jestCommandLine instead |
| pathToConfig ❌ | The path to your Jest configuration file" | "" | Please use jestCommandLine instead |
| rootPath | The path to your frontend src folder | "" | "jest.rootPath":"packages/app" or "jest.rootPath":"/apps/my-app" |
| runAllTestsFirst ❌ | Run all tests before starting Jest in watch mode | true | Please use autoRun instead |
| Editor | |||
| Whether errors should be reported inline on a file | -- | This is now deprecated in favor of jest.testExplorer |
|
| testExplorer | Configure jest test explorer | {"enabled": true} |
{"enabled": false}, {"enabled": true, showClassicStatus: true, showInlineError: true} |
| Snapshot | |||
| enableSnapshotUpdateMessages | Whether snapshot update messages should show | true | "jest.enableSnapshotUpdateMessages": false |
| enableSnapshotPreviews 💼 | Whether snapshot previews should show | true | "jest.enableSnapshotPreviews": false |
| restartJestOnSnapshotUpdate ❌ | Restart Jest runner after updating the snapshots | false | This is no longer needed in v4 |
| Coverage | |||
| showCoverageOnLoad | Show code coverage when extension starts | false | "jest.showCoverageOnLoad": true |
| coverageFormatter | Determine the coverage overlay style | "DefaultFormatter" | "jest.coverageFormatter": "GutterFormatter" |
| coverageColors | Coverage indicator color override | undefined | "jest.coverageColors": { "uncovered": "rgba(255,99,71, 0.2)", "partially-covered": "rgba(255,215,0, 0.2)"} |
| Debug | |||
| enableCodeLens 💼 | Whether codelens for debugging should show | true | "jest.enableCodeLens": false |
| debugCodeLens.showWhenTestStateIn 💼 | Show the debug CodeLens for the tests with the specified status. (window) | ["fail", "unknown"] | "jest.debugCodeLens.showWhenTestStateIn":["fail", "pass", "unknown"] |
| Misc | |||
| debugMode | Enable debug mode to diagnose plugin issues. (see developer console) | false | "jest.debugMode": true |
| disabledWorkspaceFolders 💼 | Disabled workspace folders names in multiroot environment | [] | "jest.disabledWorkspaceFolders": ["package-a", "package-b"] |
| showTerminalOnLaunch 💼 | automatically open test explorer terminal on launch (>= v4.5) | true | "jest.showTerminalOnLaunch": false |
This should be the command users used to kick off the jest tests in the terminal. However, since the extension will append additional options at run time, please make sure the command line can pass along these options, which usually just means if you uses npm, add an additional "--" at the end (e.g. "npm run test --") if you haven't already in your script.
It is recommended not to add the following options as they are managed by the extension: --watch, --watchAll, --coverage
If your project doesn't live in the root of your repository, you may want to customize the jest.rootPath setting to enlighten the extension as to where to look. For instance: "jest.rootPath": "src/client-app" will direct the extension to use the src/client-app folder as the root for Jest.
Possible status are: [ "fail", "pass", "skip", "unknown"]. Please note that this is a window level setting, i.e. its value will apply for all workspaces.
There are 2 formatters to choose from:
DefaultFormatter: high light uncovered and partially-covered code inlilne as well as on the right overview ruler. (this is the default)

GutterFormatter: render coverage status in the gutter as well as the overview ruler.

(Note, there is an known issue in vscode (microsoft/vscode#5923) that gutter decorators could interfere with debug breakpoints visibility. Therefore, you probably want to disable coverage before debugging or switch to DefaultFormatter)
Besides the formatter, user can also customize the color via jest.coverageColors to change color for 3 coverage categories: "uncovered", "covered", or "partially-covered",
example
for example:
"jest.coverageColors": {
  "uncovered": "rgba(255,99,71, 0.2)",
  "partially-covered": "rgba(255,215,0, 0.2)",
}
the default color scheme below, note the opacity might differ per formatter:
"jest.coverageColors": {
  "covered": "rgba(9, 156, 65, 0.4)",
  "uncovered": "rgba(121, 31, 10, 0.4)",
  "partially-covered": "rgba(235, 198, 52, 0.4)",
}AutoRun =
| 'off'
| { watch: true, onStartup?: ["all-tests"] }
| {
watch: false,
onStartup?: ["all-tests"],
onSave?: 'test-file' | 'test-src-file',
}example
-
Turn off auto run, users need to trigger tests run manually via run commands and menus:
"jest.autoRun": "off"
-
Run all the tests in the workspace upon extension startup, followed by jest watch run for subsequent test/src file changes.
"jest.autoRun": {
  "watch": true,
  "onStartup": ["all-tests"]
}
-
Only run tests in the test file when the test file itself changes. It will neither run all tests for the workspace upon startup nor trigger any test run when the source file changes.
"jest.autoRun": {
   "watch": false,
   "onSave": "test-file"
}
-
Like the one above but does run all tests upon extension start up
"jest.autoRun": {
  "watch": false,
  "onSave": "test-file",
  "onStartup": ["all-tests"]
}
-
migration rule from settings prior to v4:
- if
"jest.autoEnabled" = false=> manual mode:"jest.autoRun": "off" - if
"jest.runAllTestsFirst" = false=>"jest.autoRun": {"watch": true } - if no customization of the 2 settings and no
"jest.autoRun"found =>"jest.autoRun": { "watch": true, "onStartup": ["all-tests"] }
- if
testExplorer =
  | {enabled: true; showClassicStatus?: boolean; showInlineError?: boolean}
| {enabled: false}enabled: switch to turn on/off the explorer support. Default is true.showClassicStatus: (optional) show status symbol (prior to 4.1) in editor gutter, in addition to explorer status symbols. Default is false if explorer is enabled.showInlineError: (optional) show vscode style inline error and error message viewer. Default is false.
4.1 default is "jest.testExplorer": {"enabled": true}
shell = string | LoginShell;

interface LoginShell
{
  path: string;
  args: string[];
}
By default, jest command is executed in default shell ('cmd' for windows, '/bin/sh' for non-windows). Users can use the "jest.shell" setting to either pass the path of another shell (e.g. "/bin/zsh") or a LoginShell config, basically a shell path and login arguments (e.g. {"path": "/bin/bash", "args": ["--login"]})
Note the LoginShell is only applicable for non-windows platform and could cause a bit more overhead.
This extension looks for jest specific debug config ("vscode-jest-tests" or "vscode-jest-tests.v2") in the workspace .vscode/launch.json. If not found, it will attempt to generate a default config that should work for most standard jest or projects bootstrapped by create-react-app.
If the default config is not working for your project, you can either use the setup wizard, probably the easier approach (available in v4), or edit the launch.json file manually.
If you choose to edit the launch.json manually, you can use the jest templates, such as "Jest: Default jest configuration" or "Jest: create-react-app", as a starting point. See more detail on how to add debug config in vscode Debugging.
There are many information online about how to setup vscode debug config for specific environments/frameworks, you might find the following helpful:
- vscode debug config properties
- Launch configurations for common scenarios
- vscode-recipes for debug jest tests
v4.3 introduces a "variable substitution" based config with name "vscode-jest-tests.v2". The extension will merely substitute the jest variables in the config, without adding/removing anything else.
Currently supported variables:
- ${jest.testNamePattern} - will be replaced by the test block's full name (include the surrounding describe block names).
- ${jest.testFile} - will be replaced by the test file name.
- ${jest.testFilePattern} - will be replaced by the test file name suitable for regex arguments such as
--testPathPattern.
Examples
- Plain jest debug config:
{ "type": "node", "name": "vscode-jest-tests.v2", "request": "launch", "program": "${workspaceFolder}/node_modules/.bin/jest", "args": [ "--runInBand", "--watchAll=false", "--testNamePattern", "${jest.testNamePattern}", "--runTestsByPath", "${jest.testFile}" ], "cwd": "${workspaceFolder}", "console": "integratedTerminal", "internalConsoleOptions": "neverOpen", "disableOptimisticBPs": true, "windows": { "program": "${workspaceFolder}/node_modules/jest/bin/jest" } } - Angular users using yarn:
{
  "type": "node",
  "name": "vscode-jest-tests.v2",
  "request": "launch",
  "runtimeExecutable": "yarn",
  "args": [
    "test",
    "--run-in-band",
    "--watch-all=false",
    "--test-name-pattern",
    "${jest.testNamePattern}",
    "--test-path-pattern",
    "${jest.testFilePattern}"
  ],
  "cwd": "${workspaceFolder}",
  "console": "integratedTerminal",
  "internalConsoleOptions": "neverOpen",
  "disableOptimisticBPs": true
}
This extension contributes the following commands and can be accessed via Command Palette:
| command | description | availability |
|---|---|---|
| Jest: Start All Runners | start or restart all jest runners | always |
| Jest: Stop All Runners | stop all jest runners | always |
| Jest: Toggle Coverage | toggle coverage mode for all runners | always |
| Jest: Start Runner (Select Workspace) | start or restart the jest runner for the selected workspace | multi-root workspace |
| Jest: Stop Runner (Select Workspace) | stop jest runner for the selected workspace | multi-root workspace |
| Jest: Toggle Coverage (Select Workspace) | toggle coverage mode for the selected workspace | multi-root workspace |
| Jest: Run All Tests | run all tests for all the workspaces | always |
| Jest: Run All Tests (Select Workspace) | run all tests for the selected workspace | multi-root workspace |
| Jest: Run All Tests in Current Workspace | run all tests for the current workspace based on the active editor | always |
| Jest: Toggle Coverage for Current Workspace | toggle coverage mode for the current workspace based on the active editor | always |
| Jest: Setup Extension | start the setup wizard | always |
In addition, TestExplorer also exposed many handy commands, see the full list by searching for testing in vscode keyboard shortcuts editor. One can assign/change keyboard shortcut to any of these commands, see vscode Key Bindings for more details.
User can trigger the following action from the text editor context-menu
| menu | description | keyboard shortcut |
|---|---|---|
| Jest: Run Related Tests | if in test file, run all tests in the file; if in source file, run all tests with dependency to the file | Ctrl-Option-t (Mac) or Ctrl-Alt-t |
Please see vscode Key Bindings if you want to change the keyboard shortcut.
Sorry you are having trouble with the extension. If your issue did not get resolved after checking out the how-to section and the tips below, feel free to ask the community, chances are some one else had a similar experience and could help resolving it.
If you can't run jest in the terminal, please reference jest configuration to setup accordingly.
If you can run jest manually in the terminal but the extension showed error like "xxx ended unexpectedly", following are the most common causes (see self-diagnosis if you need more debug info):
- runtime environment issue: such as the shell env is not fully initialized upon vscode start up. A good indicator is messages prefixed with "env:", or node/yarn/npm command not found, such as
env: node: No such file or directory- This should only happened in Linux or MacOS and is caused by vscode not able to fully initialize the shell env when it starts up (more details here).
- The extension usually spawns the jest process with a non-login/not-interactive shell, which inherits the vscode env. If vscode env is not complete, the jest process could fail for example the
PATHenv variable is not correct. (more details here) - There are many ways to workaround such issues:
- simply restart vscode sometimes can fix it
- start vscode from a terminal
- add
PATHdirectly tojest.nodeEnvsettings, if that is the only problem. - force the jest command to be executed in a login shell by setting "jest.shell" to a LoginShell. Note this might have some slight performance overhead.
- *jest command line issue: such as you usually run
yarn testbut the extension uses the defaultjestinstead.- Try configuring the jest.jestCommandLine to mimic how you run jest from the terminal, such as
yarn testornpm run test --. The extension can auto-config common configurations like create react apps but not custom scripts like CRACO. - or you can use the "Run Setup Wizard" button in the error panel to resolve the configuration issue, see Setup Wizard.
- Try configuring the jest.jestCommandLine to mimic how you run jest from the terminal, such as
- monorepo project issue: you have a monorepo project but not setup as a multi-root workspace.
- see monorepo projects on how to set it up correctly.
There could be other causes, such as jest test root path is different from the project's, which can be fixed by setting jest.rootPath. Feel free to check out the customization section to manually adjust the extension if needed.
This means the extension is not activated.
vscode will automatically activate the extension upon detecting any of the following files from the project root directory:
- jest config file (
jest.json,jest.config.js,jest.config.ts,jest.config.mjs,jest.config.cjs) - jest command (
node_modules/.bin/jest,node_modules/react-scripts/node_modules/.bin/jest) - react-native script (
node_modules/react-native-scripts)
If none of the activation criteria is met because
- you have a monorepo project: see monorepo projects support.
- your source and tests are not in the project root directory: try jest.rootPath to point to that directory instead.
Users can also try to manually activate the extension via command palette: "Jest: Start All Runners"
By default the extension will run all tests when it is launched followed by a jest watch process. If you have many resource intensive tests or source files that can trigger many tests when changed, this could be the reason. Check out jest.autoRun to see how you can change and control when and what tests should be run.
If your test file happen to have parameterized tests, i.e. test.each variations, please make sure you have jest version >= 26.5.
If the above did not resolve your issue, please see the self-diagnosis to show more insight of why the test and result could not be matched.
Thanks for considering! Check here for useful tips and guidelines.
vscode-jest is MIT licensed.