vizceral
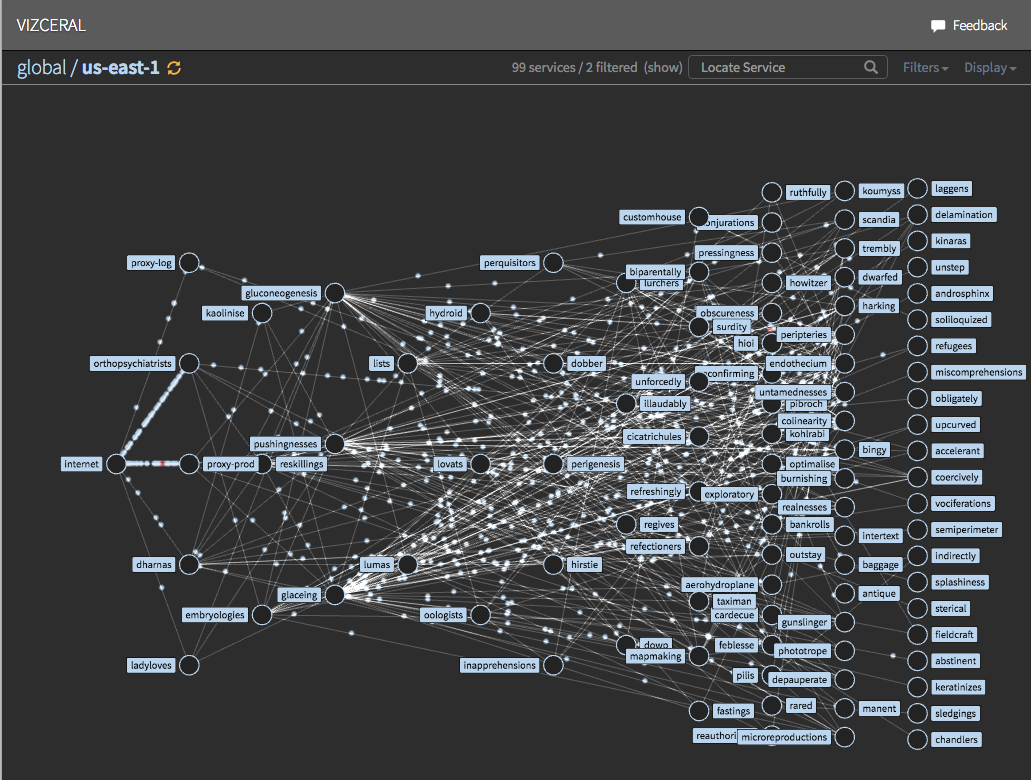
vizceral is a component for displaying traffic data on a webgl canvas. If a graph of nodes and edges with data about traffic volume is provided, it will render a traffic graph animating the connection volume between nodes.
This component can take multiple traffic graphs and will generate a 'global' graph showing all incoming traffic into each of the 'regions', with support for cross-region traffic.
There are three levels of information, global, regional, and service-level, with clicking or double-clicking on a node bringing you one level deeper.
Using
If you are using either React or web components, there are some helper modules that make it easier to get started:
- React: https://github.com/Netflix/vizceral-react
- Web Components: https://github.com/Netflix/vizceral-component
There is an example app using the react wrapper with some sample data to show how the component works. It would also be an easy jumping off point for building your own UI.
Otherwise, to integrate it from scratch:
-
Add vizceral to package.json
npm install vizceral --save
-
Start using the component
import Vizceral from 'vizceral';
const viz = new Vizceral();

// Add event handlers for the vizceral events
viz.on('viewChanged', view => {});
viz.on('nodeHighlighted', node => {});
viz.on('rendered', data => {});
viz.on('nodeContextSizeChanged', dimensions => {});

// Sample data
viz.updateData({
  name: 'us-west-2',
  renderer: 'global',
  nodes: [
    {name: 'INTERNET'},
    {name: 'service'}
  ],
  connections: [
    {
      source: 'INTERNET',
      target: 'service',
      metrics: { normal: 100, warning: 95, danger: 5 },
      metadata: { streaming: true }
    }
  ]
});
viz.setView();
viz.animate();
Note: The component will not show anything unless you call updateData on the component with relevant traffic data.
Data Structures
See DATAFORMATS.md for example data in the format expected by the component.
Styling
The component uses a map of variables to set all the styles. You may override any number of the default styles. The following example shows all the styles that are used in the component.
import Vizceral from 'vizceral';
const vizceral = new Vizceral();
vizceral.updateStyles({
  colorText: 'rgb(214, 214, 214)',
  colorTextDisabled: 'rgb(129, 129, 129)',
  colorTraffic: {
    normal: 'rgb(186, 213, 237)',
    normalDonut: 'rgb(91, 91, 91)',
    warning: 'rgb(268, 185, 73)',
    danger: 'rgb(184, 36, 36)',
  },
  colorNormalDimmed: 'rgb(101, 117, 128)',
  colorBackgroundDark: 'rgb(35, 35, 35)',
  colorLabelBorder: 'rgb(16, 17, 18)',
  colorLabelText: 'rgb(0, 0, 0)',
  colorDonutInternalColor: 'rgb(35, 35, 35)',
  colorDonutInternalColorHighlighted: 'rgb(255, 255, 255)',
  colorConnectionLine: 'rgb(91, 91, 91)',
  colorPageBackground: 'rgb(45, 45, 45)',
  colorPageBackgroundTransparent: 'rgba(45, 45, 45, 0)',
  colorBorderLines: 'rgb(137, 137, 137)',
  colorArcBackground: 'rgb(60, 60, 60)'
});
Since the main underlying rendering is done via three.js, the component needed an easy way to use the same values for CSS and JS variables.
Notices
Vizceral supports showing notices on connections and nodes. If you want to use this feature, a DOM element with a class of vizceral-notice will have to be provided as a sibling to the vizceral canvas.
API
View USAGE.md
Developing Locally
To see your changes to vizceral locally, you'll need to link the package with bower:
$ git clone git@github.com:Netflix/vizceral.git
$ cd vizceral
$ npm link
$ npm run dev
$ cd /path/to/project-using-vizceral
$ npm link vizceral
Contributing
- Clone this repo
- Create a branch:
git checkout -b your-feature - Make some changes
- Test your changes by running your local version
- Push your branch and open a Pull Request
Supported Browsers
Currently only developing with Chrome in mind. Seems to work in Safari and Firefox, but more testing is needed.
TODO
- Unit Tests
- Modular layout algorithms
- Smarter current layout algorithm
- Cross-browser support / testing
- Create predefined locations and design styles to modularly represent custom metadata
- Implement redesigned third-level view
License
Code released under the Apache 2.0 license.

