pvc-exporter
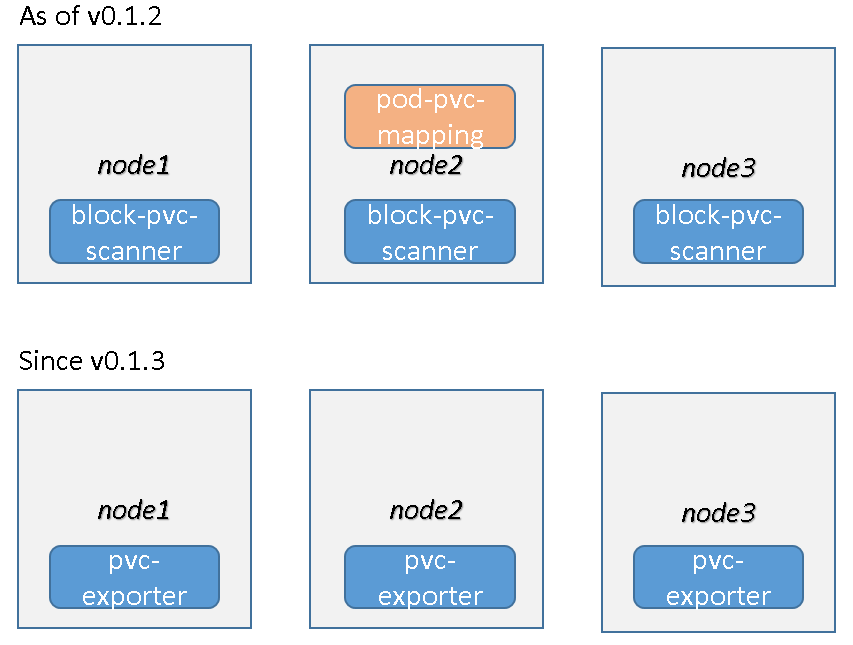
As of v0.1.2


Since v0.1.3


This project provides 2 metrics to monitoring block storage, hostpath and nfs pvcs. One for monitoring mounted pvc usage named "pvc_usage", and one for provides the mapping between pod and pvc named "pvc_mapping".
Note
Now, the hostpath pvc and nfs pvc will be supported starting with version 0.1.3. So we currently support 3 types of pvc: hostpath, nfs, blockstorage.
For blockstorage just supported the pvc mounted as "volumeMounts". If your pv is block model and mounted as "volumeDevices" that not supported yet.
Architecture Change:
-
Previously, "pvc_usage" and "pvc_mapping" were divided into 2 images. Now, they have merged into one image, called pvc-exporter. In addition, the field of the metrics have also been changed.
-
Based on the development of k8s, the native metrics like kubelet_volume_stats_used_bytes was now able to work normally and part of the demand has been met. So the pod-pvc-mapping image is maintained separately now, you can use this alone with the native metrics to monitoring pvc.
-
If you want to upgrade to v0.1.3, we recommend that you uninstall old version then install new version.
Support list
The following storage provisioners has been tested..
1.longgorn
2.trident
3.rook-ceph
4.aliyun flexvolume
5.iomesh
6.nutanix-csi
...
The following architectures:
1.x86_64
2.ARM64
Usage
###v0.1.2###
helm repo add pvc-exporter https://kais271.github.io/pvc-exporter/helm3/charts/
kubectl create namespace pvc-exporter
helm install demo pvc-exporter/pvc-exporter --namespace pvc-exporter --version v0.1.2

###v0.1.3###
#This will be provide 2 metrics: pvc_usage and pvc_mapping
helm repo add pvc-exporter https://kais271.github.io/pvc-exporter/helm3/charts/
kubectl create namespace pvc-exporter
helm install demo pvc-exporter/pvc-exporter --namespace pvc-exporter --version v0.1.3

#If you just want to get pvc_mapping:
helm repo add pvc-exporter https://kais271.github.io/pvc-exporter/helm3/charts/
kubectl create namespace pod-pvc-mapping
helm install demo pvc-exporter/pod-pvc-mapping --namespace pod-pvc-mapping --version v0.1.3
Metrics Examples
#pvc_usage
The value is pvc usage percent that equal pvc_used_MB/pvc_requested_MB. Some informations about pvc is also provided.
pvc_usage{container="pvc-exporter", endpoint="metrics", grafana_key="pvc-957af729-41e3-40cc-b90d-71ffab0ec149-web-3", instance="10.3.179.59:8848", job="demo-pvc-exporter", namespace="pvc-exporter", persistentvolume="pvc-957af729-41e3-40cc-b90d-71ffab0ec149", persistentvolumeclaim="www-web-3", pod="demo-pvc-exporter-phbmt", pvc_namespace="default", pvc_requested_size_MB="1024.0", pvc_requested_size_human="1G", pvc_type="block", pvc_used_MB="2.5", service="demo-pvc-exporter"} 0.01
#pvc_mapping
This metrics provide mapping between pvc and pod.
pvc_mapping{container="pvc-exporter", endpoint="metrics", grafana_key="pvc-e555d811-c0b1-4e0b-b3ee-25c7cb1c66ee-web-0", host_ip="192.168.175.129", instance="10.3.179.59:8848", job="demo-pvc-exporter", mountedby="web-0", namespace="pvc-exporter", persistentvolume="pvc-e555d811-c0b1-4e0b-b3ee-25c7cb1c66ee", persistentvolumeclaim="www-web-0", pod="demo-pvc-exporter-phbmt", pod_namespace="default", service="demo-pvc-exporter"} 0
Promethesus & Grafana
You can use this expression " sum without (grafana_key,container,pod,service,namespace,job,instance,endpoint,pvc_namespace,pvc_requested_size_MB) ( (pvc_usage) + on(grafana_key) group_left(persistentvolumeclaim,mountedby,pod_namespace)pvc_mapping*0) " to grafana to monitoring pvc usage.
note!!! You can see one pvc usage percent more than 1, that's a nfs pvc. As we know the nfs and hostpath pvc will exceed the requested size if the provisioner not support quota.
For dashboard, you can refer /docs/PVC-Dashboard.json
