![]()
Chalk is a declarative drawing library. The API draws heavy inspiration from Haskell's diagrams, Scala's doodle and Jeremy Gibbons's lecture notes on Functional Programming for Domain−Specific Languages.
The documentation is available at https://chalk-diagrams.github.io.
The library is available on PyPI as chalk-diagrams and can be installed with pip:
pip install git+https://github.com/chalk-diagrams/chalk/On Debian (or Colab) you will need to install Cairo for PyCairo
sudo apt-get install libcairo2-devIf you want to use the LaTeX extension, run:
pip install chalk-diagrams[latex]For the LaTeX extension you might need to install pdf2svg and texlive;
on Debian these dependencies can be installed as follows:
sudo apt-get install pdf2svg texlive texlive-science texlive-latex-recommended texlive-latex-extraInstallation with Conda
You can install the library with conda from conda-forge channel.
conda install -c conda-forge chalk-diagramsBelow we provide a brief introduction of the main functionality of the library.
These examples are available in the examples/intro.py file.
We start by importing the colour module and the diagrams functions:
from colour import Color
from chalk import *
We also define some colors that will be shortly used:
papaya = Color("#ff9700")
blue = Color("#005FDB")
We can easily create basic shapes (the functions circle, square, triangle) and style them with various attributes (the methodsfill_color, line_color, line_width).
For example:
d = circle(1).fill_color(papaya)
The diagram can be saved to an image using the render method:
d.render("examples/output/intro-01.png", height=64)We can glue together two diagrams using the combinators atop (or +), beside (or |), above (or /).
For example:
circle(0.5).fill_color(papaya) | square(1).fill_color(blue)which is equivalent to
circle(0.5).fill_color(papaya).beside(square(1).fill_color(blue))This code produces the following image:

We also provide combinators for a list of diagrams:
hcat for horizontal composition, vcat for vertical composition.
For example:
hcat(circle(0.1 * i) for i in range(1, 6)).fill_color(blue)
We can use Python functions to build more intricate diagrams:
def sierpinski(n: int, size: int) -> Diagram:
    if n <= 1:
        return triangle(size)
    else:
        smaller = sierpinski(n - 1, size / 2)
        return smaller.above(smaller.beside(smaller).center_xy())

d = sierpinski(5, 4).fill_color(papaya)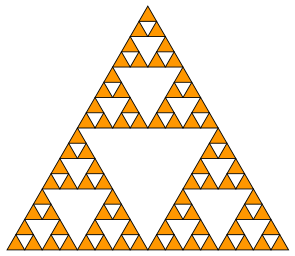
For more examples, please check the examples folder;
their output is illustrated below:
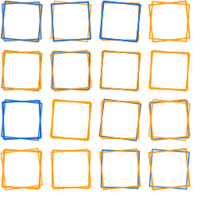 squares.py |
logo.py |
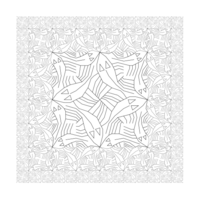 escher_square_limit.py |
 hilbert.py |
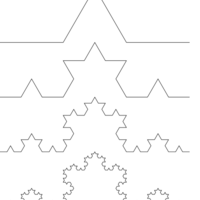 koch.py |
 hex-variation.py |
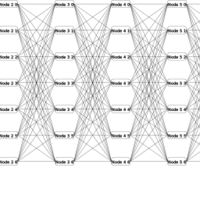
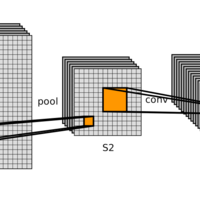 lenet.py |
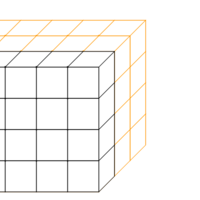 tensor.py |
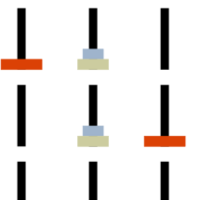 hanoi.py |
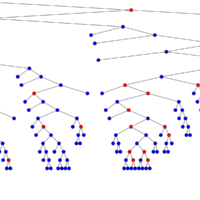 tree.py |
 lattice.py |
These scripts can be run as follows:
python examples/squares.pySpecial thanks to:
- Sugato Ray, for his significant contributions and suggestions;
- Ionuț G. Stan, for providing many useful insights and comments.