Same Geo data and code but different representation between v5.16.0 and v6.0.0
jkiss opened this issue · comments

Hi, I draw a geo map, it's normal when I use d3.js@5.16.0. After I upgrade to v6.0.0, the map is small with a outer square box, it's so weird!
Here is my same code:
let
    proj = d3.geoMercator().fitSize([svg_w, svg_h], ChinaBoundary),
    path = d3.geoPath().projection(proj)

svg.append('g')
        .attr('id', 'boundary')
        .selectAll('path')
        .data(ChinaBoundary.features)
        .join('path')
        .attr('d', path)
        .attr('fill', 'none')
        .attr('stroke', '#ccc')
        .attr('stroke-width', 1)
        .attr('data-name', d=>d.properties.name)
Here is different results:
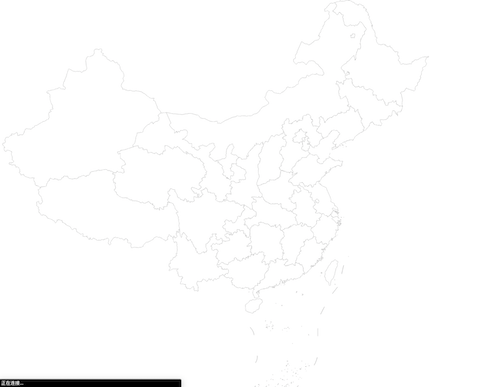
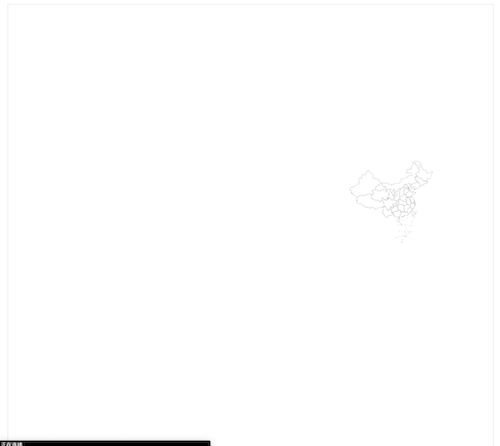
The code is SAME!

Presumably it is similar to #140 : in that case a feature has a wrong winding order (hence should span the whole sphere), but is so small it was ignored by d3-geo@1; d3-geo@2 has more precision and does not ignore it any more. Can you try mapshaper to confirm or share the geojson with us?
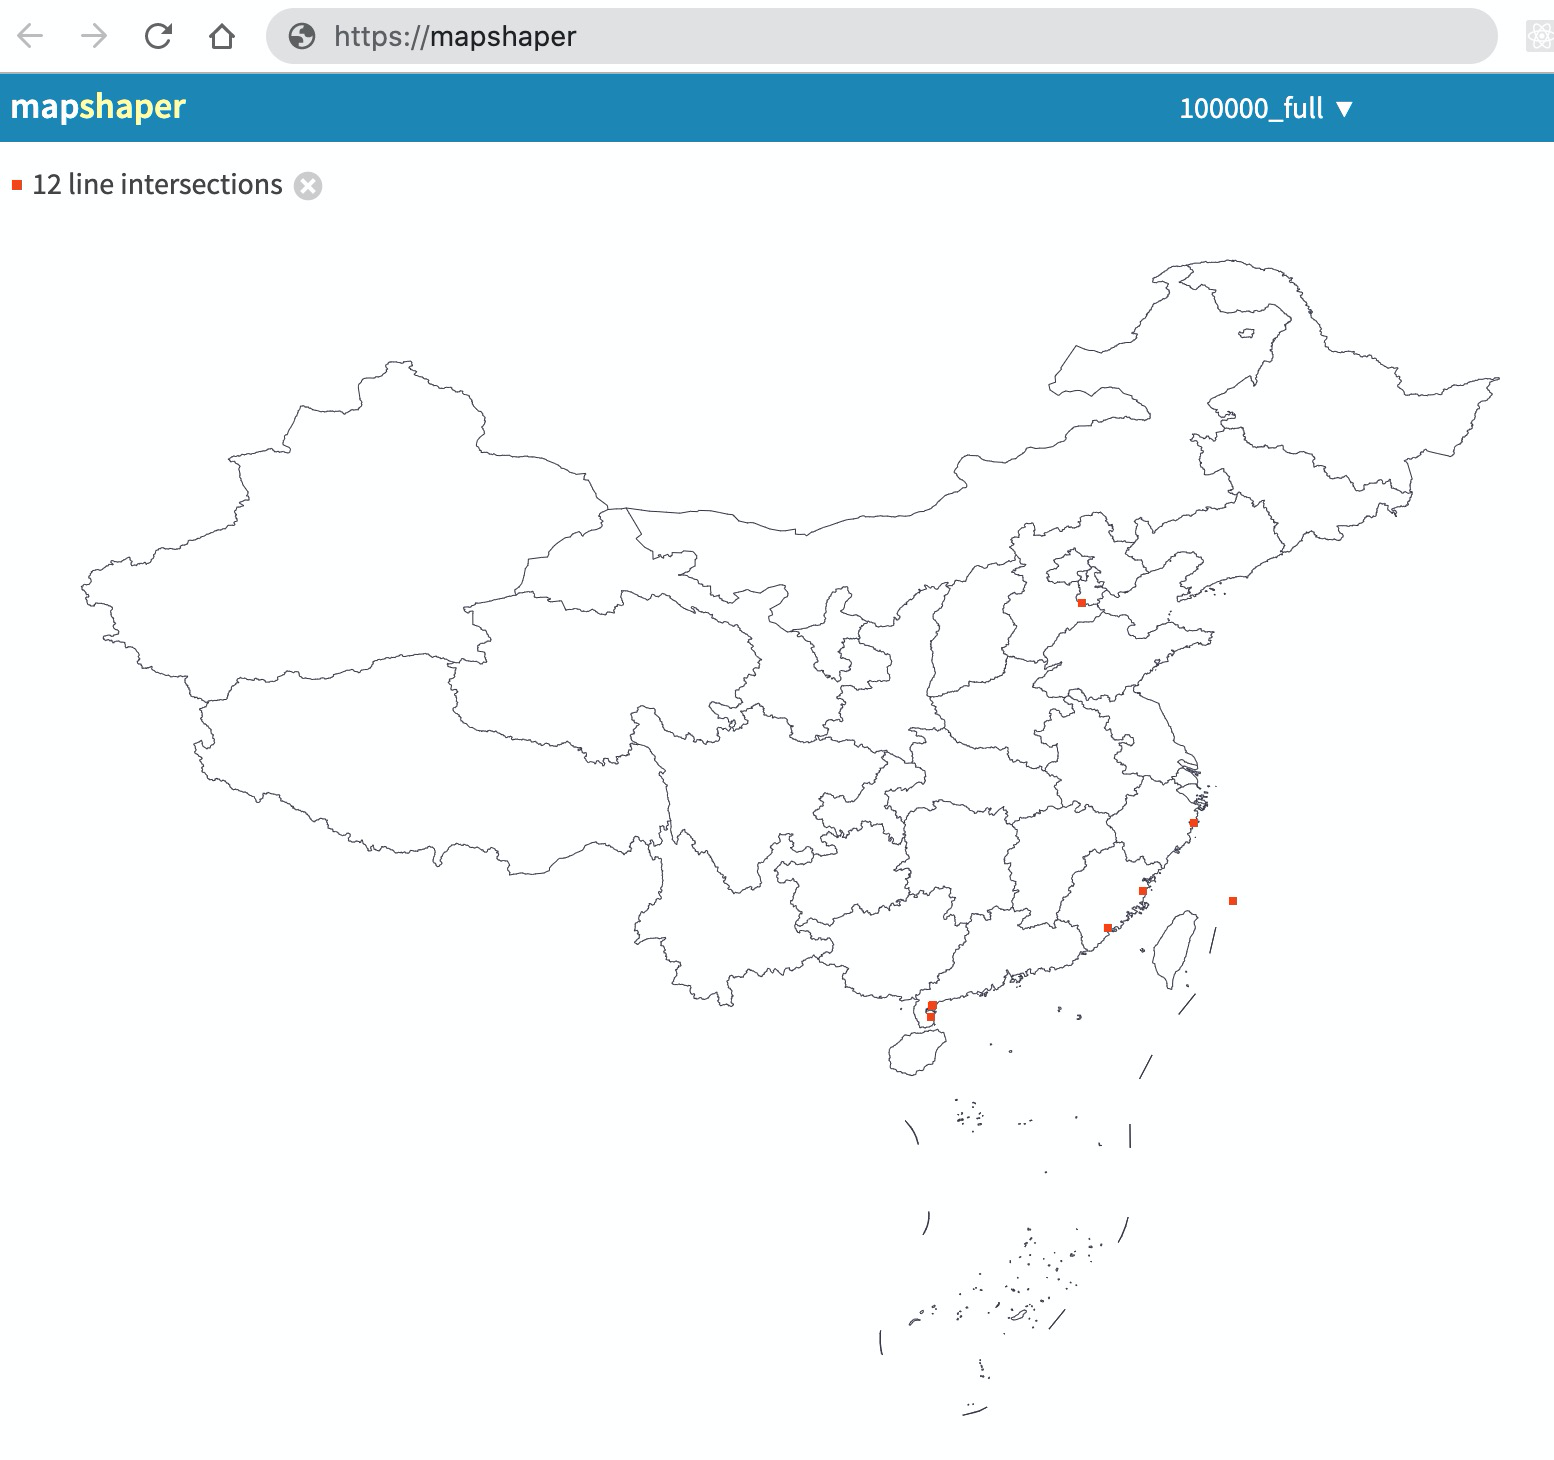
Three rings of this geojson are "anticlockwise", I have shown them here https://observablehq.com/d/0d1d483bffcb1bbf
Note that the results are identical with d3@6 and d3@5

Hi, I draw a geo map, it's normal when I use d3.js@5.16.0. After I upgrade to v6.0.0, the map is small with a outer square box, it's so weird!
Here is my same code:
let
    proj = d3.geoMercator().fitSize([svg_w, svg_h], ChinaBoundary),
    path = d3.geoPath().projection(proj)

svg.append('g')
        .attr('id', 'boundary')
        .selectAll('path')
        .data(ChinaBoundary.features)
        .join('path')
        .attr('d', path)
        .attr('fill', 'none')
        .attr('stroke', '#ccc')
        .attr('stroke-width', 1)
        .attr('data-name', d=>d.properties.name)
Here is different results:
The code is SAME!
Hi, how to fix the anti-clockwise data?
怎样找到geojson的哪个部分出的问题?怎样修复啊?
Here's a solution
https://observablehq.com/d/ad95fe77b3e10504