Show scale extrema values in ticks
AdrienLemaire opened this issue · comments

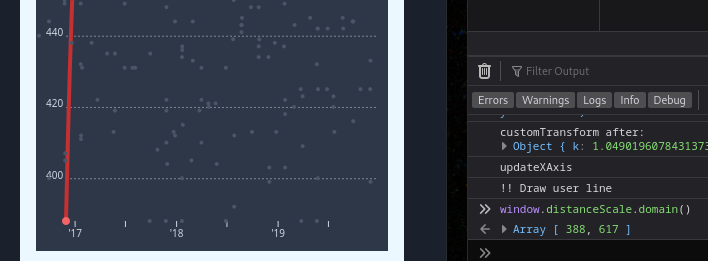
Is there an option to show extrema ticks (in my case, the origin tick would suffice).
As you can see below, my y axis ticks are fine, except that I'd like a tick going through my x-axis. The domain goes from 388 to 617, and I'd like to keep the same ticks as shown on the graph + a new tick at position 388.
I will use tickValues for the time being and manually calculate all the ticks needed. Hopefully you can tell me about a simpler way :)
Sorry, realizing that this is a d3-scale issue, and that I should have asked the question on SO. Closing
Edit: For the record, I needed to update the domain of my scale with nice rounded values for d3.ticks
This did the trick
  // Rescale yAxis
  const [minValue, maxValue] = array.extent(userData, d => d.total);
  const newDistanceScale = window.distanceScale.domain([
    Math.floor(minValue / 10) * 10,
    Math.ceil(maxValue / 10) * 10
  ]);
  const newYScale = d3zoom.zoomIdentity.rescaleY(newDistanceScale);
  updateYAxis(newYScale);