import numpy as np
import pandas as pd
import matplotlib.pyplot as plt
%matplotlib inlinedf = pd.read_csv('wine.data.csv')
df.head(10).dataframe thead th {
text-align: left;
}
.dataframe tbody tr th {
vertical-align: top;
}
| Class | Alcohol | Malic acid | Ash | Alcalinity of ash | Magnesium | Total phenols | Flavanoids | Nonflavanoid phenols | Proanthocyanins | Color intensity | Hue | OD280/OD315 of diluted wines | Proline | |
|---|---|---|---|---|---|---|---|---|---|---|---|---|---|---|
| 0 | 1 | 14.23 | 1.71 | 2.43 | 15.6 | 127 | 2.80 | 3.06 | 0.28 | 2.29 | 5.64 | 1.04 | 3.92 | 1065 |
| 1 | 1 | 13.20 | 1.78 | 2.14 | 11.2 | 100 | 2.65 | 2.76 | 0.26 | 1.28 | 4.38 | 1.05 | 3.40 | 1050 |
| 2 | 1 | 13.16 | 2.36 | 2.67 | 18.6 | 101 | 2.80 | 3.24 | 0.30 | 2.81 | 5.68 | 1.03 | 3.17 | 1185 |
| 3 | 1 | 14.37 | 1.95 | 2.50 | 16.8 | 113 | 3.85 | 3.49 | 0.24 | 2.18 | 7.80 | 0.86 | 3.45 | 1480 |
| 4 | 1 | 13.24 | 2.59 | 2.87 | 21.0 | 118 | 2.80 | 2.69 | 0.39 | 1.82 | 4.32 | 1.04 | 2.93 | 735 |
| 5 | 1 | 14.20 | 1.76 | 2.45 | 15.2 | 112 | 3.27 | 3.39 | 0.34 | 1.97 | 6.75 | 1.05 | 2.85 | 1450 |
| 6 | 1 | 14.39 | 1.87 | 2.45 | 14.6 | 96 | 2.50 | 2.52 | 0.30 | 1.98 | 5.25 | 1.02 | 3.58 | 1290 |
| 7 | 1 | 14.06 | 2.15 | 2.61 | 17.6 | 121 | 2.60 | 2.51 | 0.31 | 1.25 | 5.05 | 1.06 | 3.58 | 1295 |
| 8 | 1 | 14.83 | 1.64 | 2.17 | 14.0 | 97 | 2.80 | 2.98 | 0.29 | 1.98 | 5.20 | 1.08 | 2.85 | 1045 |
| 9 | 1 | 13.86 | 1.35 | 2.27 | 16.0 | 98 | 2.98 | 3.15 | 0.22 | 1.85 | 7.22 | 1.01 | 3.55 | 1045 |
df.iloc[:,1:].describe().dataframe thead th {
text-align: left;
}
.dataframe tbody tr th {
vertical-align: top;
}
| Alcohol | Malic acid | Ash | Alcalinity of ash | Magnesium | Total phenols | Flavanoids | Nonflavanoid phenols | Proanthocyanins | Color intensity | Hue | OD280/OD315 of diluted wines | Proline | |
|---|---|---|---|---|---|---|---|---|---|---|---|---|---|
| count | 178.000000 | 178.000000 | 178.000000 | 178.000000 | 178.000000 | 178.000000 | 178.000000 | 178.000000 | 178.000000 | 178.000000 | 178.000000 | 178.000000 | 178.000000 |
| mean | 13.000618 | 2.336348 | 2.366517 | 19.494944 | 99.741573 | 2.295112 | 2.029270 | 0.361854 | 1.590899 | 5.058090 | 0.957449 | 2.611685 | 746.893258 |
| std | 0.811827 | 1.117146 | 0.274344 | 3.339564 | 14.282484 | 0.625851 | 0.998859 | 0.124453 | 0.572359 | 2.318286 | 0.228572 | 0.709990 | 314.907474 |
| min | 11.030000 | 0.740000 | 1.360000 | 10.600000 | 70.000000 | 0.980000 | 0.340000 | 0.130000 | 0.410000 | 1.280000 | 0.480000 | 1.270000 | 278.000000 |
| 25% | 12.362500 | 1.602500 | 2.210000 | 17.200000 | 88.000000 | 1.742500 | 1.205000 | 0.270000 | 1.250000 | 3.220000 | 0.782500 | 1.937500 | 500.500000 |
| 50% | 13.050000 | 1.865000 | 2.360000 | 19.500000 | 98.000000 | 2.355000 | 2.135000 | 0.340000 | 1.555000 | 4.690000 | 0.965000 | 2.780000 | 673.500000 |
| 75% | 13.677500 | 3.082500 | 2.557500 | 21.500000 | 107.000000 | 2.800000 | 2.875000 | 0.437500 | 1.950000 | 6.200000 | 1.120000 | 3.170000 | 985.000000 |
| max | 14.830000 | 5.800000 | 3.230000 | 30.000000 | 162.000000 | 3.880000 | 5.080000 | 0.660000 | 3.580000 | 13.000000 | 1.710000 | 4.000000 | 1680.000000 |
for c in df.columns[1:]:
    df.boxplot(c,by='Class',figsize=(7,4),fontsize=14)
    plt.title("{}\n".format(c),fontsize=16)
    plt.xlabel("Wine Class", fontsize=16)
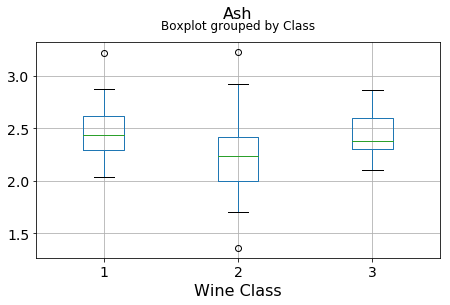
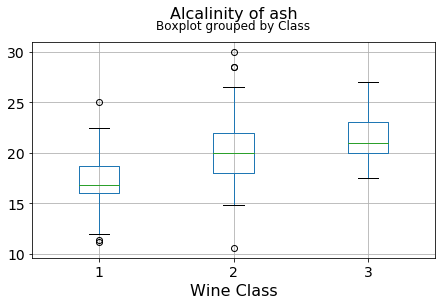
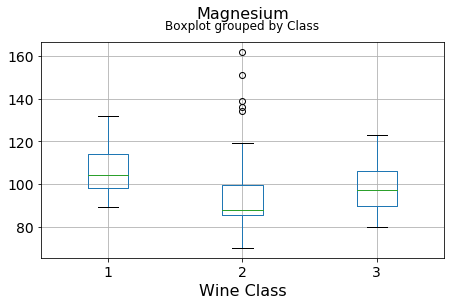
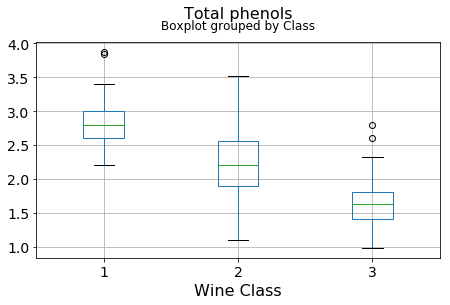
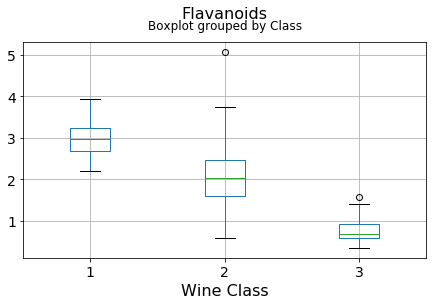
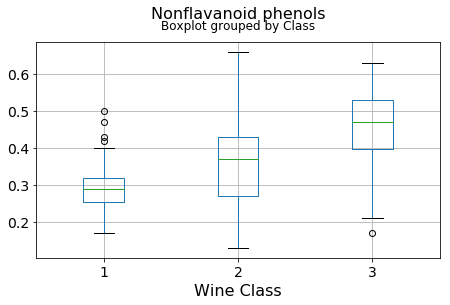
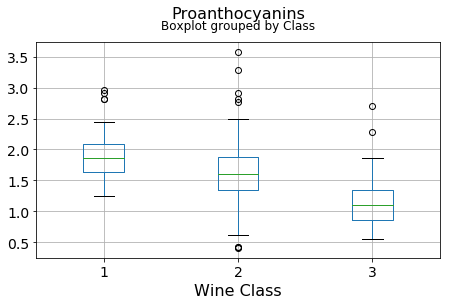
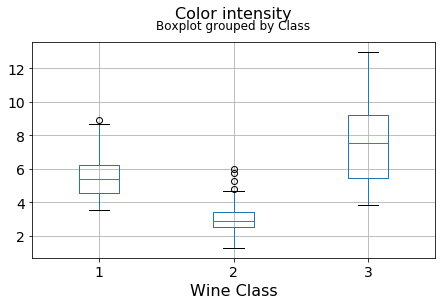
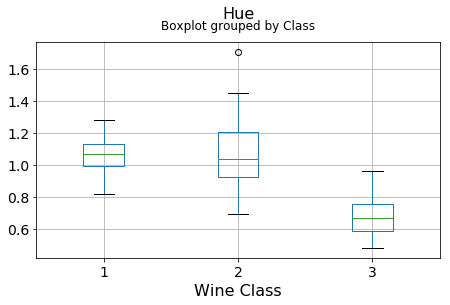
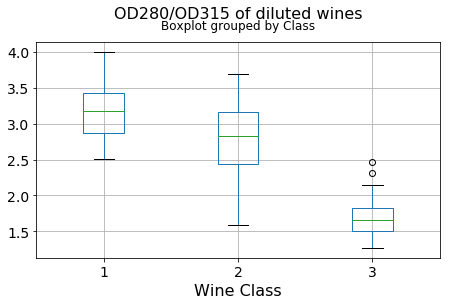
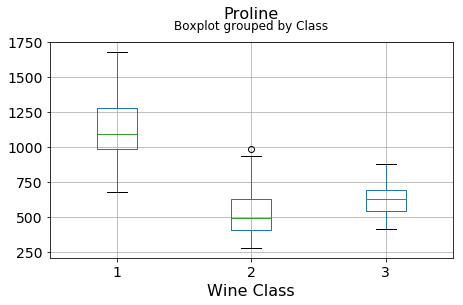
It can be seen that some features classify the wine labels pretty clearly. For example, Alcalinity, Total Phenols, or Flavonoids produce boxplots with well-separated medians, which are clearly indicative of wine classes.
Below is an example of class seperation using two variables
plt.figure(figsize=(10,6))
plt.scatter(df['OD280/OD315 of diluted wines'],df['Flavanoids'],c=df['Class'],edgecolors='k',alpha=0.75,s=150)
plt.grid(True)
plt.title("Scatter plot of two features showing the \ncorrelation and class seperation",fontsize=15)
plt.xlabel("OD280/OD315 of diluted wines",fontsize=15)
plt.ylabel("Flavanoids",fontsize=15)
plt.show()It can be seen that there are some good amount of correlation between features i.e. they are not independent of each other, as assumed in Naive Bayes technique. However, we will still go ahead and apply the classifier to see its performance.
def correlation_matrix(df):
    from matplotlib import pyplot as plt
    from matplotlib import cm as cm

    fig = plt.figure(figsize=(16,12))
    ax1 = fig.add_subplot(111)
    cmap = cm.get_cmap('jet', 30)
    cax = ax1.imshow(df.corr(), interpolation="nearest", cmap=cmap)
    ax1.grid(True)
    plt.title('Wine data set features correlation\n',fontsize=15)
    labels=df.columns
    ax1.set_xticklabels(labels,fontsize=9)
    ax1.set_yticklabels(labels,fontsize=9)
    # Add colorbar, make sure to specify tick locations to match desired ticklabels
    fig.colorbar(cax, ticks=[0.1*i for i in range(-11,11)])
    plt.show()

correlation_matrix(df)PCA requires scaling/normalization of the data to work properly
from sklearn.preprocessing import StandardScalerscaler = StandardScaler()X = df.drop('Class',axis=1)
y = df['Class']X = scaler.fit_transform(X)dfx = pd.DataFrame(data=X,columns=df.columns[1:])dfx.head(10).dataframe thead th {
text-align: left;
}
.dataframe tbody tr th {
vertical-align: top;
}
| Alcohol | Malic acid | Ash | Alcalinity of ash | Magnesium | Total phenols | Flavanoids | Nonflavanoid phenols | Proanthocyanins | Color intensity | Hue | OD280/OD315 of diluted wines | Proline | |
|---|---|---|---|---|---|---|---|---|---|---|---|---|---|
| 0 | 1.518613 | -0.562250 | 0.232053 | -1.169593 | 1.913905 | 0.808997 | 1.034819 | -0.659563 | 1.224884 | 0.251717 | 0.362177 | 1.847920 | 1.013009 |
| 1 | 0.246290 | -0.499413 | -0.827996 | -2.490847 | 0.018145 | 0.568648 | 0.733629 | -0.820719 | -0.544721 | -0.293321 | 0.406051 | 1.113449 | 0.965242 |
| 2 | 0.196879 | 0.021231 | 1.109334 | -0.268738 | 0.088358 | 0.808997 | 1.215533 | -0.498407 | 2.135968 | 0.269020 | 0.318304 | 0.788587 | 1.395148 |
| 3 | 1.691550 | -0.346811 | 0.487926 | -0.809251 | 0.930918 | 2.491446 | 1.466525 | -0.981875 | 1.032155 | 1.186068 | -0.427544 | 1.184071 | 2.334574 |
| 4 | 0.295700 | 0.227694 | 1.840403 | 0.451946 | 1.281985 | 0.808997 | 0.663351 | 0.226796 | 0.401404 | -0.319276 | 0.362177 | 0.449601 | -0.037874 |
| 5 | 1.481555 | -0.517367 | 0.305159 | -1.289707 | 0.860705 | 1.562093 | 1.366128 | -0.176095 | 0.664217 | 0.731870 | 0.406051 | 0.336606 | 2.239039 |
| 6 | 1.716255 | -0.418624 | 0.305159 | -1.469878 | -0.262708 | 0.328298 | 0.492677 | -0.498407 | 0.681738 | 0.083015 | 0.274431 | 1.367689 | 1.729520 |
| 7 | 1.308617 | -0.167278 | 0.890014 | -0.569023 | 1.492625 | 0.488531 | 0.482637 | -0.417829 | -0.597284 | -0.003499 | 0.449924 | 1.367689 | 1.745442 |
| 8 | 2.259772 | -0.625086 | -0.718336 | -1.650049 | -0.192495 | 0.808997 | 0.954502 | -0.578985 | 0.681738 | 0.061386 | 0.537671 | 0.336606 | 0.949319 |
| 9 | 1.061565 | -0.885409 | -0.352802 | -1.049479 | -0.122282 | 1.097417 | 1.125176 | -1.143031 | 0.453967 | 0.935177 | 0.230557 | 1.325316 | 0.949319 |
dfx.describe().dataframe thead th {
text-align: left;
}
.dataframe tbody tr th {
vertical-align: top;
}
| Alcohol | Malic acid | Ash | Alcalinity of ash | Magnesium | Total phenols | Flavanoids | Nonflavanoid phenols | Proanthocyanins | Color intensity | Hue | OD280/OD315 of diluted wines | Proline | |
|---|---|---|---|---|---|---|---|---|---|---|---|---|---|
| count | 1.780000e+02 | 1.780000e+02 | 1.780000e+02 | 1.780000e+02 | 1.780000e+02 | 1.780000e+02 | 1.780000e+02 | 1.780000e+02 | 1.780000e+02 | 1.780000e+02 | 1.780000e+02 | 1.780000e+02 | 1.780000e+02 |
| mean | -8.619821e-16 | -8.357859e-17 | -8.657245e-16 | -1.160121e-16 | -1.995907e-17 | -2.972030e-16 | -4.016762e-16 | 4.079134e-16 | -1.699639e-16 | -1.247442e-18 | 3.717376e-16 | 2.919013e-16 | -7.484650e-18 |
| std | 1.002821e+00 | 1.002821e+00 | 1.002821e+00 | 1.002821e+00 | 1.002821e+00 | 1.002821e+00 | 1.002821e+00 | 1.002821e+00 | 1.002821e+00 | 1.002821e+00 | 1.002821e+00 | 1.002821e+00 | 1.002821e+00 |
| min | -2.434235e+00 | -1.432983e+00 | -3.679162e+00 | -2.671018e+00 | -2.088255e+00 | -2.107246e+00 | -1.695971e+00 | -1.868234e+00 | -2.069034e+00 | -1.634288e+00 | -2.094732e+00 | -1.895054e+00 | -1.493188e+00 |
| 25% | -7.882448e-01 | -6.587486e-01 | -5.721225e-01 | -6.891372e-01 | -8.244151e-01 | -8.854682e-01 | -8.275393e-01 | -7.401412e-01 | -5.972835e-01 | -7.951025e-01 | -7.675624e-01 | -9.522483e-01 | -7.846378e-01 |
| 50% | 6.099988e-02 | -4.231120e-01 | -2.382132e-02 | 1.518295e-03 | -1.222817e-01 | 9.595986e-02 | 1.061497e-01 | -1.760948e-01 | -6.289785e-02 | -1.592246e-01 | 3.312687e-02 | 2.377348e-01 | -2.337204e-01 |
| 75% | 8.361286e-01 | 6.697929e-01 | 6.981085e-01 | 6.020883e-01 | 5.096384e-01 | 8.089974e-01 | 8.490851e-01 | 6.095413e-01 | 6.291754e-01 | 4.939560e-01 | 7.131644e-01 | 7.885875e-01 | 7.582494e-01 |
| max | 2.259772e+00 | 3.109192e+00 | 3.156325e+00 | 3.154511e+00 | 4.371372e+00 | 2.539515e+00 | 3.062832e+00 | 2.402403e+00 | 3.485073e+00 | 3.435432e+00 | 3.301694e+00 | 1.960915e+00 | 2.971473e+00 |
from sklearn.decomposition import PCApca = PCA(n_components=None)dfx_pca = pca.fit(dfx)plt.figure(figsize=(10,6))
plt.scatter(x=[i+1 for i in range(len(dfx_pca.explained_variance_ratio_))],
y=dfx_pca.explained_variance_ratio_,
s=200, alpha=0.75,c='orange',edgecolor='k')
plt.grid(True)
plt.title("Explained variance ratio of the \nfitted principal component vector\n",fontsize=25)
plt.xlabel("Principal components",fontsize=15)
plt.xticks([i+1 for i in range(len(dfx_pca.explained_variance_ratio_))],fontsize=15)
plt.yticks(fontsize=15)
plt.ylabel("Explained variance ratio",fontsize=15)
plt.show()The above plot means that the
dfx_trans = pca.transform(dfx)dfx_trans = pd.DataFrame(data=dfx_trans)
dfx_trans.head(10).dataframe thead th {
text-align: left;
}
.dataframe tbody tr th {
vertical-align: top;
}
| 0 | 1 | 2 | 3 | 4 | 5 | 6 | 7 | 8 | 9 | 10 | 11 | 12 | |
|---|---|---|---|---|---|---|---|---|---|---|---|---|---|
| 0 | 3.316751 | -1.443463 | -0.165739 | -0.215631 | 0.693043 | -0.223880 | 0.596427 | 0.065139 | 0.641443 | 1.020956 | -0.451563 | 0.540810 | -0.066239 |
| 1 | 2.209465 | 0.333393 | -2.026457 | -0.291358 | -0.257655 | -0.927120 | 0.053776 | 1.024416 | -0.308847 | 0.159701 | -0.142657 | 0.388238 | 0.003637 |
| 2 | 2.516740 | -1.031151 | 0.982819 | 0.724902 | -0.251033 | 0.549276 | 0.424205 | -0.344216 | -1.177834 | 0.113361 | -0.286673 | 0.000584 | 0.021717 |
| 3 | 3.757066 | -2.756372 | -0.176192 | 0.567983 | -0.311842 | 0.114431 | -0.383337 | 0.643593 | 0.052544 | 0.239413 | 0.759584 | -0.242020 | -0.369484 |
| 4 | 1.008908 | -0.869831 | 2.026688 | -0.409766 | 0.298458 | -0.406520 | 0.444074 | 0.416700 | 0.326819 | -0.078366 | -0.525945 | -0.216664 | -0.079364 |
| 5 | 3.050254 | -2.122401 | -0.629396 | -0.515637 | -0.632019 | 0.123431 | 0.401654 | 0.394893 | -0.152146 | -0.101996 | 0.405585 | -0.379433 | 0.145155 |
| 6 | 2.449090 | -1.174850 | -0.977095 | -0.065831 | -1.027762 | -0.620121 | 0.052891 | -0.371934 | -0.457016 | 1.016563 | -0.442433 | 0.141230 | -0.271778 |
| 7 | 2.059437 | -1.608963 | 0.146282 | -1.192608 | 0.076903 | -1.439806 | 0.032376 | 0.232979 | 0.123370 | 0.735600 | 0.293555 | 0.379663 | -0.110164 |
| 8 | 2.510874 | -0.918071 | -1.770969 | 0.056270 | -0.892257 | -0.129181 | 0.125285 | -0.499578 | 0.606589 | 0.174107 | -0.508933 | -0.635249 | 0.142084 |
| 9 | 2.753628 | -0.789438 | -0.984247 | 0.349382 | -0.468553 | 0.163392 | -0.874352 | 0.150580 | 0.230489 | 0.179420 | 0.012478 | 0.550327 | -0.042455 |
Plot the first two columns of this transformed data set with the color set to original ground truth class label
plt.figure(figsize=(10,6))
plt.scatter(dfx_trans[0],dfx_trans[1],c=df['Class'],edgecolors='k',alpha=0.75,s=150)
plt.grid(True)
plt.title("Class separation using first two principal components\n",fontsize=20)
plt.xlabel("Principal component-1",fontsize=15)
plt.ylabel("Principal component-2",fontsize=15)
plt.show()

