Originally forked from the amazing tty.js.
The goal is to extend this project to support the creation of rich media windows, on top of the terminal windows.
The idea is simple: the server watches a directory, and monitors the creation & modification of HTML files; upong modification / creation, it creates a new window on the client side (browser), which simply render the HTML.
Clients are easy to develop: one simply needs to dump HTML into the watched directory to have it rendered by the browser.
For now, I'm focusing on one client, written in Lua, for Torch7.

Check out tty.js for reference on the original project. Note: I'm simply extending their project, not modifying any of the core structure, so it should remain compatible.
You have to have Node.js (important, Version >= 0.10.0), NPM, and Torch7 installed. With older versions of Node.js, things won't be stable. You also need libgraphicsmagick-dev to be installed:
# OS X
brew install graphicsmagick

# Ubuntu
apt-get install libgraphicsmagick1-dev
apt-get install graphicsmagick
Then simply run:
luarocks install https://raw.github.com/clementfarabet/gfx.js/master/gfx.js-scm-0.rockspecOr, if you cloned the repo locally:
luarocks makeOnce installed, you can start/stop the server like this (I'm assuming a LuaJIT-based install):
luajit -lgfx.start
luajit -lgfx.stop
And then open up a tab in your browser, at http://localhost:8000.
The browser acts as a passive graphics backend. The server monitors the creation of new resources (charts, plots, videos, ...), and lets the browser know it should render them.
The framework is very flexible: resources can be rendered by a client (luajit) with no browser open, and even no server listening/running. The resources generated will still be saved, and can be visualized later (very useful to generate resources/charts on a server with no X session).
You can optionally specify a different port as an env variable, if the default (8000) is not available:
PORT=4321 luajit -lgfx.start
PORT=4321 luajit -lgfx.stop
Also, we provide a useful PS script, which lists running servers:
luajit -lgfx.ps
On Mac OS, we also provide a shortcut to start the server in the background and automatically open the browser at the right location:
luajit -lgfx.go
Alternatively, you can do things step by step:
luajit -lgfx.start
# starts a server...
luajit
# starts a Torch session
At the prompt, you can load the gfx.js client, and render things:
gfx = require 'gfx.js'
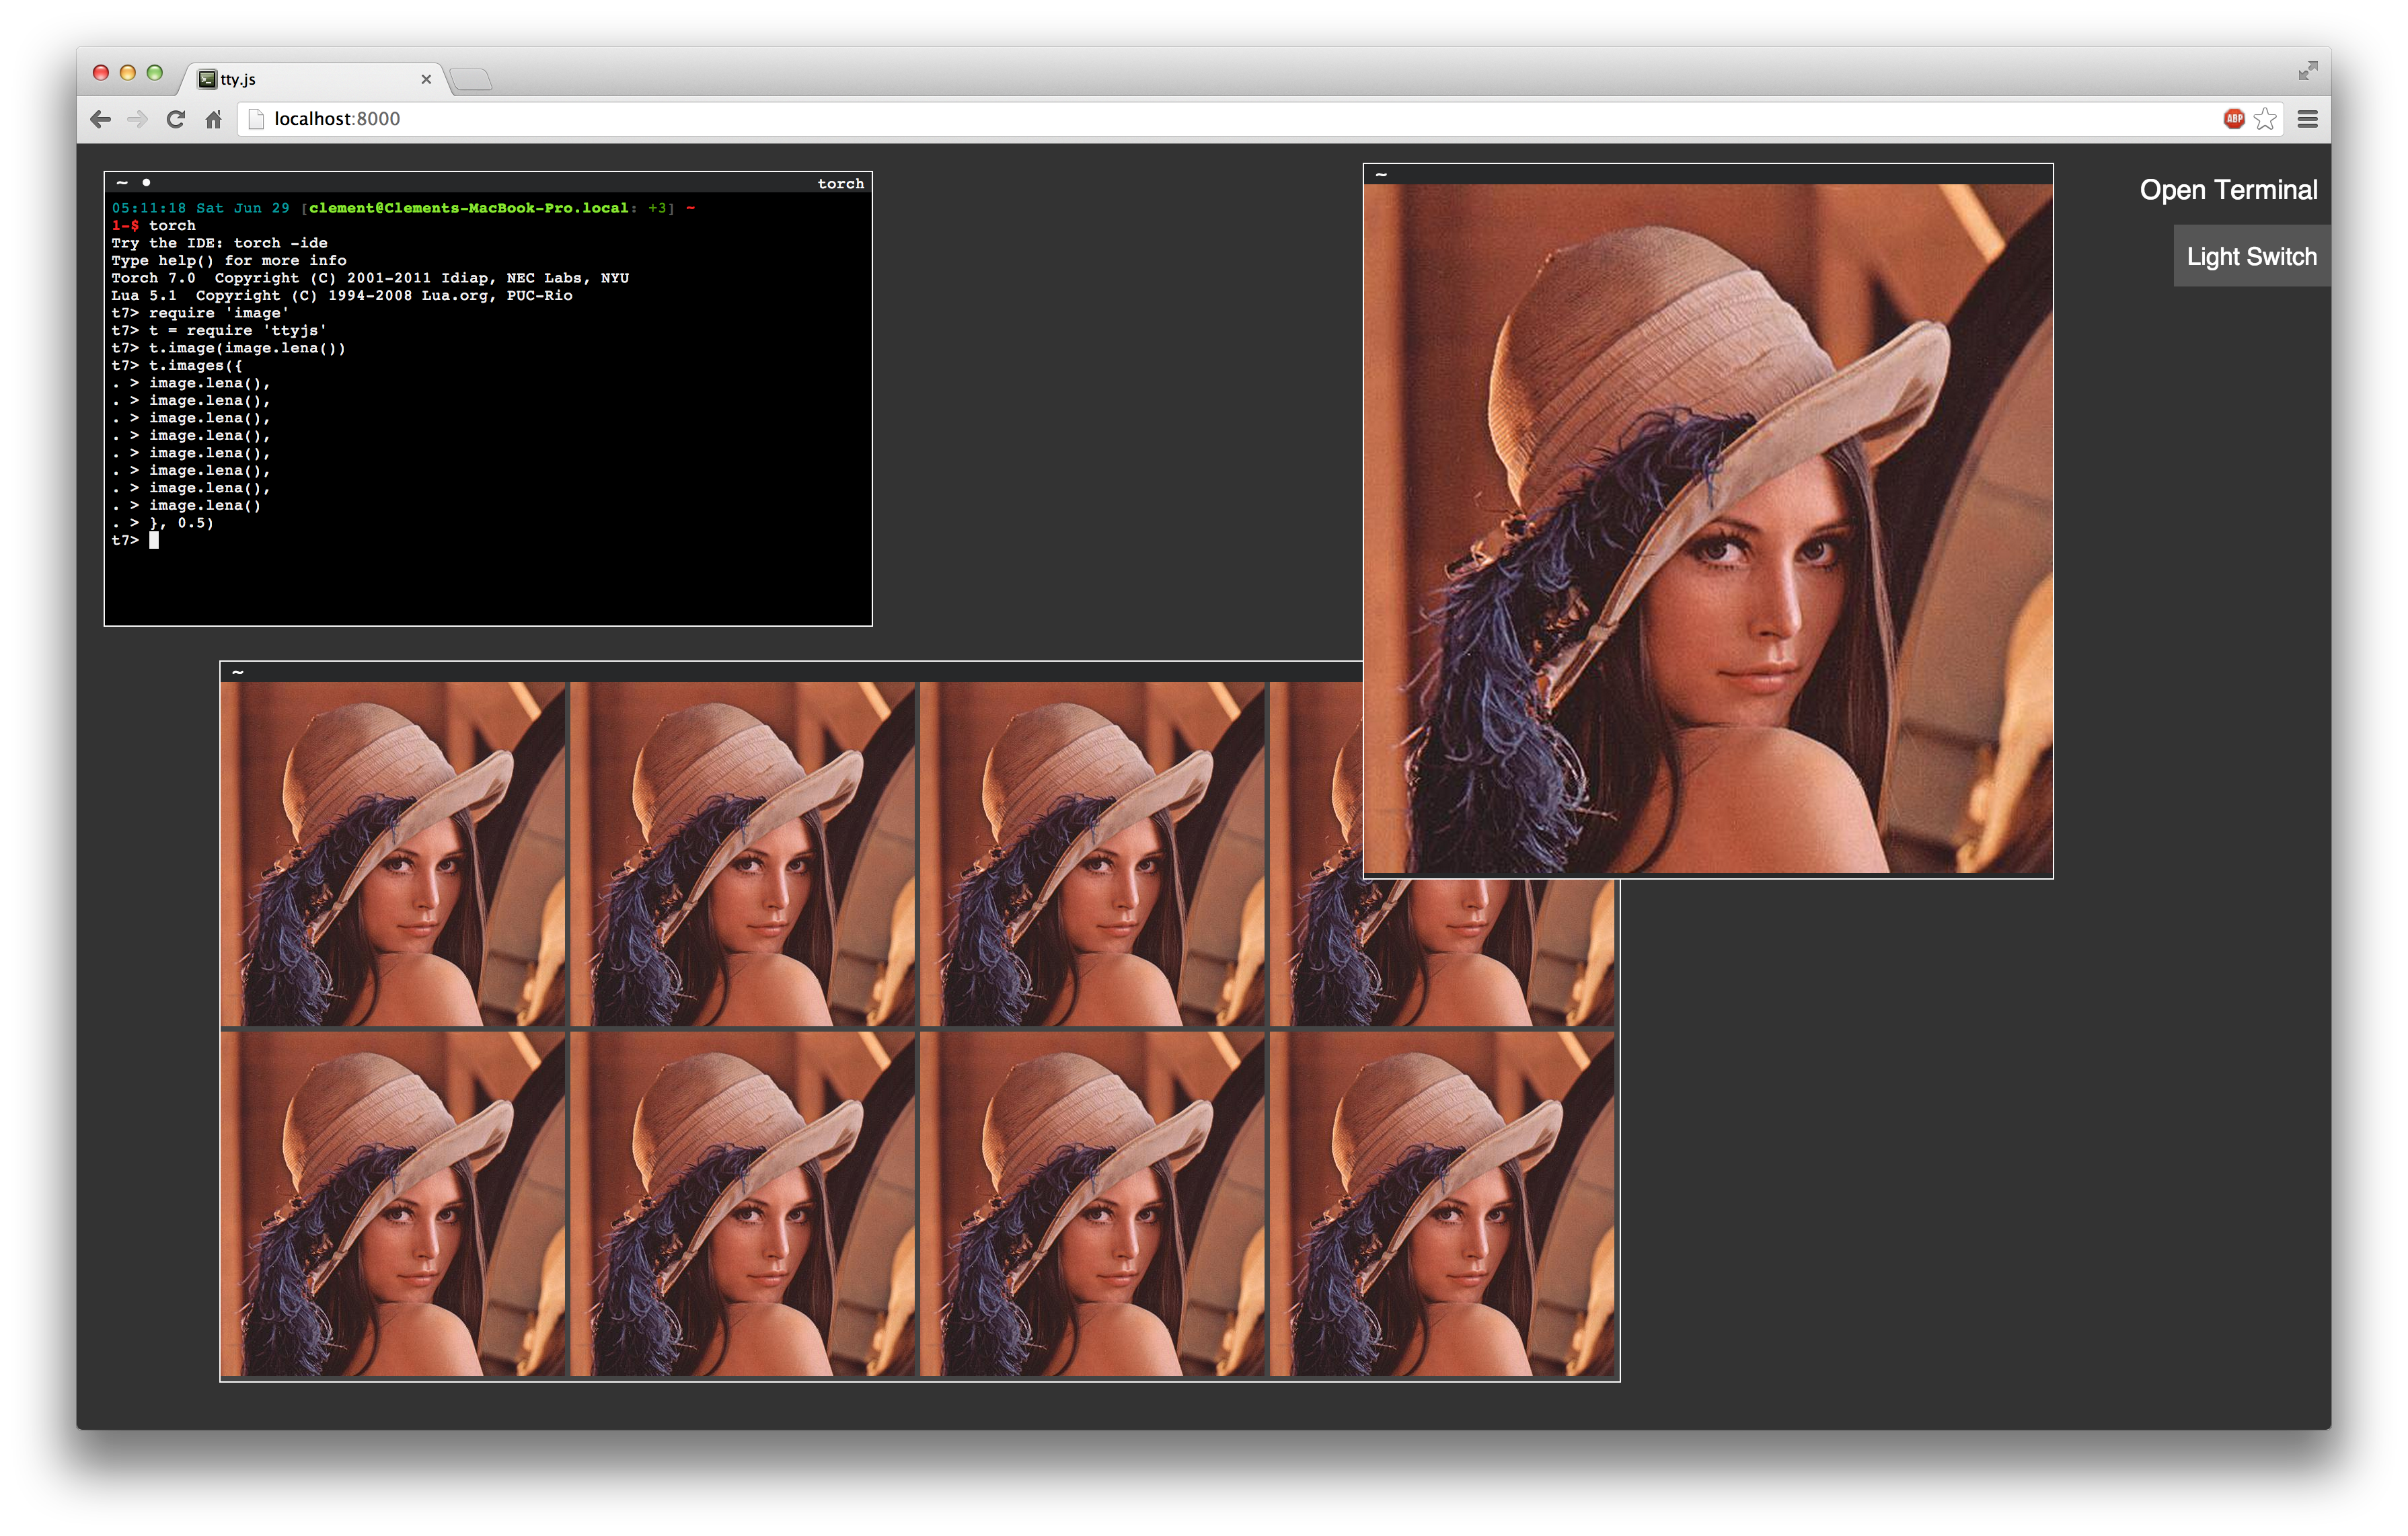
gfx.image(image.lena())
gfx.image({
image.lena()
image.lena()
image.lena()
image.lena()
image.lena()
image.lena()
image.lena()
image.lena()
}, {zoom=0.5, legends={'Image 1', 'Image 2'}})This will produce this output:
I've also slowly started to integrate plots from NVD3, and bind them to Torch, so that they can seamlessly be called from the Torch repl:
gfx.chart(data, {
   chart = 'line', -- or: bar, stacked, multibar, scatter
   width = 600,
   height = 450,
})

-- where data has the form:
data = {
    {
        key = 'Legend 1',
        color = '#0f0',
        values = { {x=0,y=0}, {x=1,y=1}, ... },
    },
    {
        key = 'Legend 2',
        color = '#00f',
        values = { {x=0,y=0}, {x=1,y=1}, ... },
    },
}

-- or, for a single dataset:
data = {
    key = 'Legend',
    values = { {x=0,y=0} , ... }
}

-- values can be provided in convenient ways:
values = { {x=0,y=0[,size=0]}, ... }
values = { {0,0,0}, ... }
values = torch.randn(100,2)
values = torch.randn(100,3)  -- the 3rd dimension is the optional size, only used by certain charts
values = torch.randn(100) -- in this case, y is provided, x defaults to range(0,N-1)

-- shortcuts are also provided for quick plots:
gfx.chart(torch.randn(100,2), {chart='scatter'})
gfx.chart(torch.randn(100), {chart='line'})  -- y is provided, x will be a range(1,N)
gfx.chart({ torch.randn(100), torch.randn(100) })  -- multiple datasets
gfx.chart({ {1,2,3,4,5,6,7,8,7,6,5,4,3,2,1}, torch.randn(100) })  -- multiple datasets, table format
As explained above, one can generate resources/charts/figures with no server listening. One can connect a server later on, and redraw the last resources generated. Here are a few useful commands for that:
gfx = require 'gfx.js'
ids = gfx.list(10) -- will list the last 10 figures generated (each figure has a unique ID)
print(ids[1])
-- will print something like: dom_1212817597132847893127489
gfx.redraw(ids[1]) -- will redraw this resource
gfx.redraw(10) -- will redraw the last 10 resources available (sorted by descending time)
Finally, the server gets slower as the number of resources/charts/images grows in the watched directory. It's useful to sometimes clear this cache manually:
gfx.clear()