Ansible playbook for https://metrics.shields.io
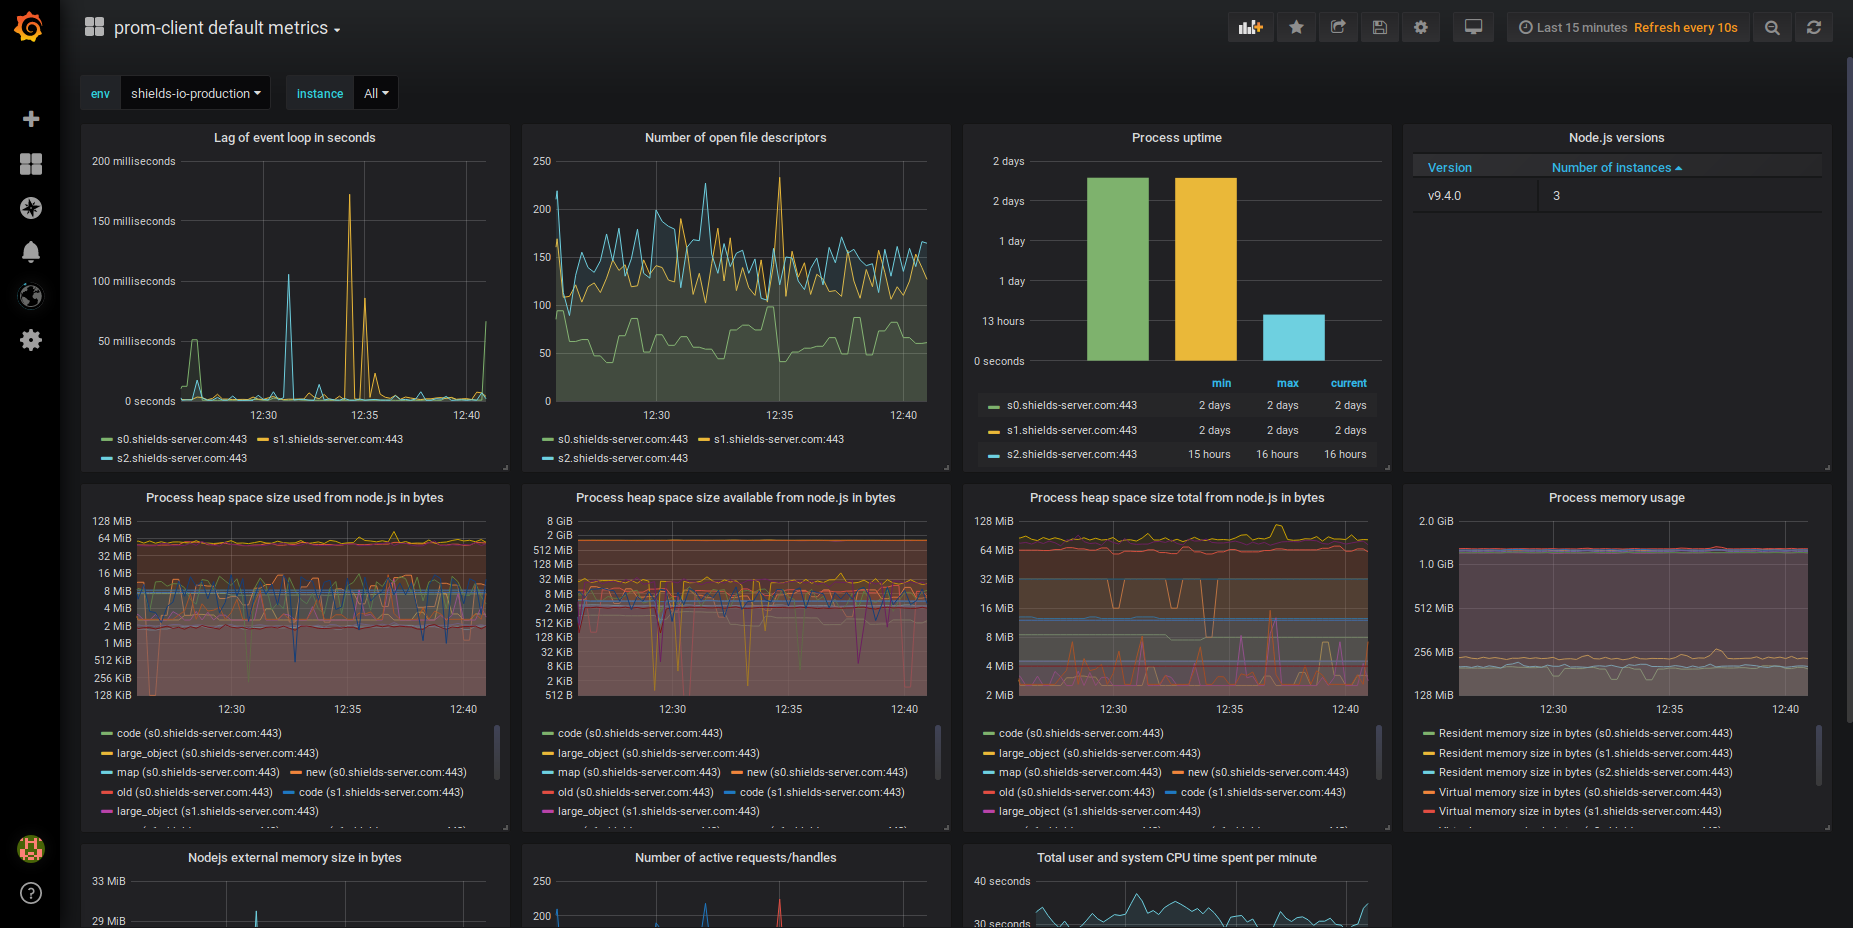
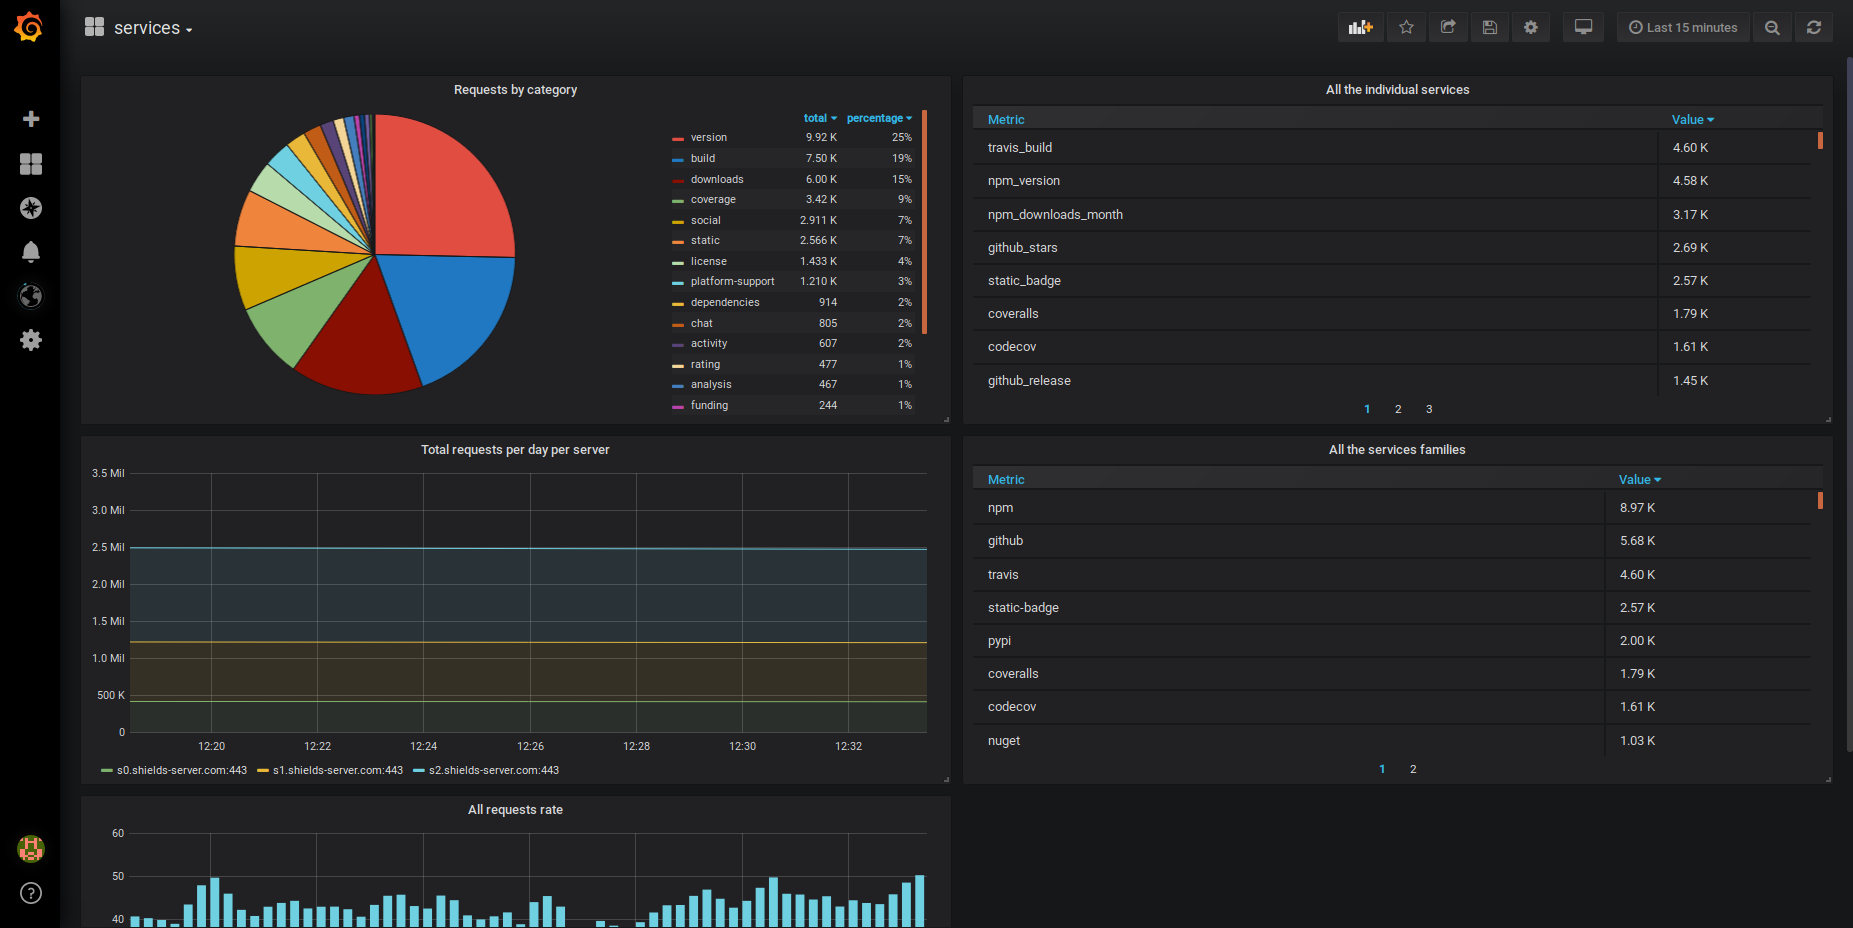
This Ansible playbook can be used to setup monitoring (https://metrics.shields.io) for Shields.io. It installs Prometheus, Telegraf, Grafana, NGINX and Let's Encrypt certificates (using Certbot).
Prometheus configuration contains all instances (servers) of shields.io. Grafana contains dashboards and worldPing plugin.
If you want to make changes in existing Grafana dashboards you have to update these files (explanation + instruction) and run this role. You can always save changes as a new dashboard: Dashboard settings > Save As ...
worldPing has to be enabled manually. It also requires Grafana.com API Key.
- Install Ansible (doc)
- Prepare an inventory file
inventory.ini:
metrics ansible_host=metrics.example.com ansible_port=22 ansible_user=ubuntu ansible_python_interpreter=/usr/bin/python3- Copy a SSH key to remote server
- Install required Ansible roles:
ansible-galaxy install -r requirements.yml- Define properties in
variables.yml:
metrics_domain: metrics.example.com
mertics_grafana_admin_password: !vault |
          $ANSIBLE_VAULT;1.1;AES256
          ...
metrics_grafana_github_client_id: github_client_id
metrics_grafana_github_client_secret: !vault |
          $ANSIBLE_VAULT;1.1;AES256
          ...
mertics_prometheus_password: !vault |
          $ANSIBLE_VAULT;1.1;AES256
          ...
metrics_certbot_email: metrics@example.com
E-mail address (metrics_certbot_email) is used by Certbot for notification about certificates that are about to expire (doc).
You can encrypt passwords/secrets using Ansible Vault:
ansible-vault encrypt_string --ask-vault-pass --stdin-name 'my_key'- Run a playbook:
ansible-playbook shields-io-metrics.yml -i inventory.ini -e @variables.yml --ask-vault-pass --ask-become-pass- update
grafana_versioninshields-io-metrics.ymlfile - run the playbook with
grafanatag:ansible-playbook shields-io-metrics.yml -i inventory.ini -e @variables.yml --ask-vault-pass --ask-become-pass --tags grafana
- update
prometheus_versioninshields-io-metrics.ymlfile - run the playbook with
prometheustag:ansible-playbook shields-io-metrics.yml -i inventory.ini -e @variables.yml --ask-vault-pass --ask-become-pass --tags prometheus
| Resource | Path | Access restrictions |
|---|---|---|
| Grafana | / |
public access for all dashboards; administration using username admin and password from mertics_grafana_admin_password variable or using GitHub authentication |
| Prometheus | /prometheus |
requires username prometheus and password from mertics_prometheus_password variable |
| Telegraf | /telegraf |
requires username telegraf and password from mertics_telegraf_password variable or username telegraf-staging and password from mertics_telegraf_staging_password variable or username telegraf-production and password from mertics_telegraf_production_password variable |
https://metrics.shields.io/ uses one single-core virtual host with 2 GB RAM VPS SSD 1 with Ubuntu 18.04.
Grafana allows to authenticate with GitHub. At https://metrics.shields.io maintainers from core team can log into Grafana using GitHub with 'Editor' role. Currently GitHub OAuth application used for Grafana at metrics.shields.io is owned by @platan.
Vagrant can be used to test the configuration or run monitoring locally (documentation).
- Start a virtual server and run the playbook:
# go to repo directory
cd repo-dir
vagrant up- Now you can visit:
- Grafana: http://localhost:8081
- Prometheus: http://localhost:8081/prometheus
Credentials are defined in variables-local.yml.
It is possible to run Ansible manually against local machine:
ansible-playbook shields-io-metrics.yml --private-key .vagrant/machines/metrics/virtualbox/private_key -i .vagrant/provisioners/ansible/inventory/vagrant_ansible_inventory -e @variables-local.yml --tags grafanaFinally you can stop (vagrant halt) or remove (vagrant destroy) the virtual server.

