Here I made a pitch deck to present my insights based on the historical data of two products. The data for both products are on the csv files.
Based on the data, I made an interactive visualization using Tableau, which you could take a look here.
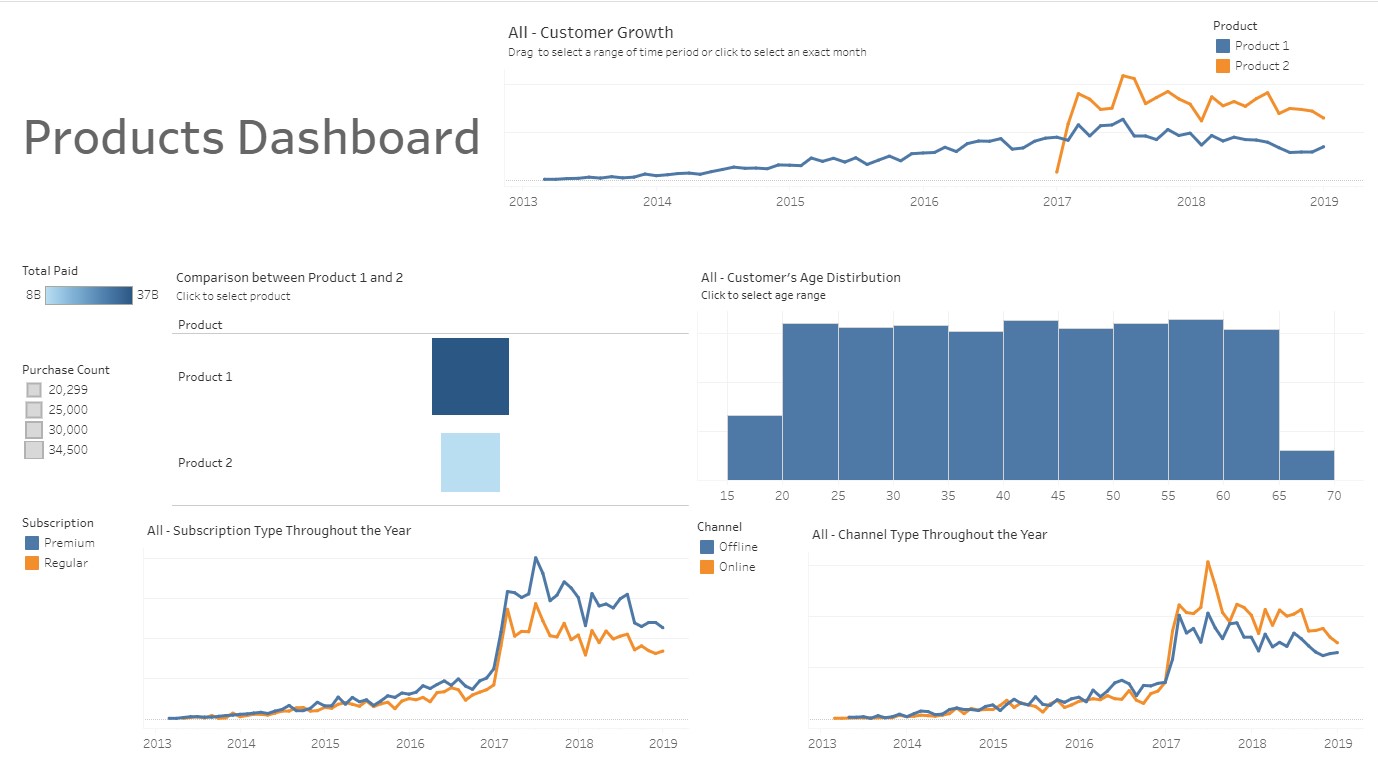
Here is the snapshot of the dashboard:

In the Tableau Public Gallery, you can interact with the dashboard by clicking according to the instruction, i.e. selecting the product, time period, or age range.
I also made some other visualization using seaborn and matplotlib on Python, which results can be found on the slide deck, along with the insights.