This program relies on a number of libraries specified in requirements.txt.
The best way to use it is to create a Python virtual environment and then install these packages in it.
Additionally, having fzf installed on the system is required for the QTL trait selection menu.
Please note that the data.txt file mentioned in the examples is too large for github, hence it can be found at this link.
For the most basic usage, just pass the file to the program like such:
./plot.py data.csv
# or in the case of rQTL files
./plot.py data.txt --line
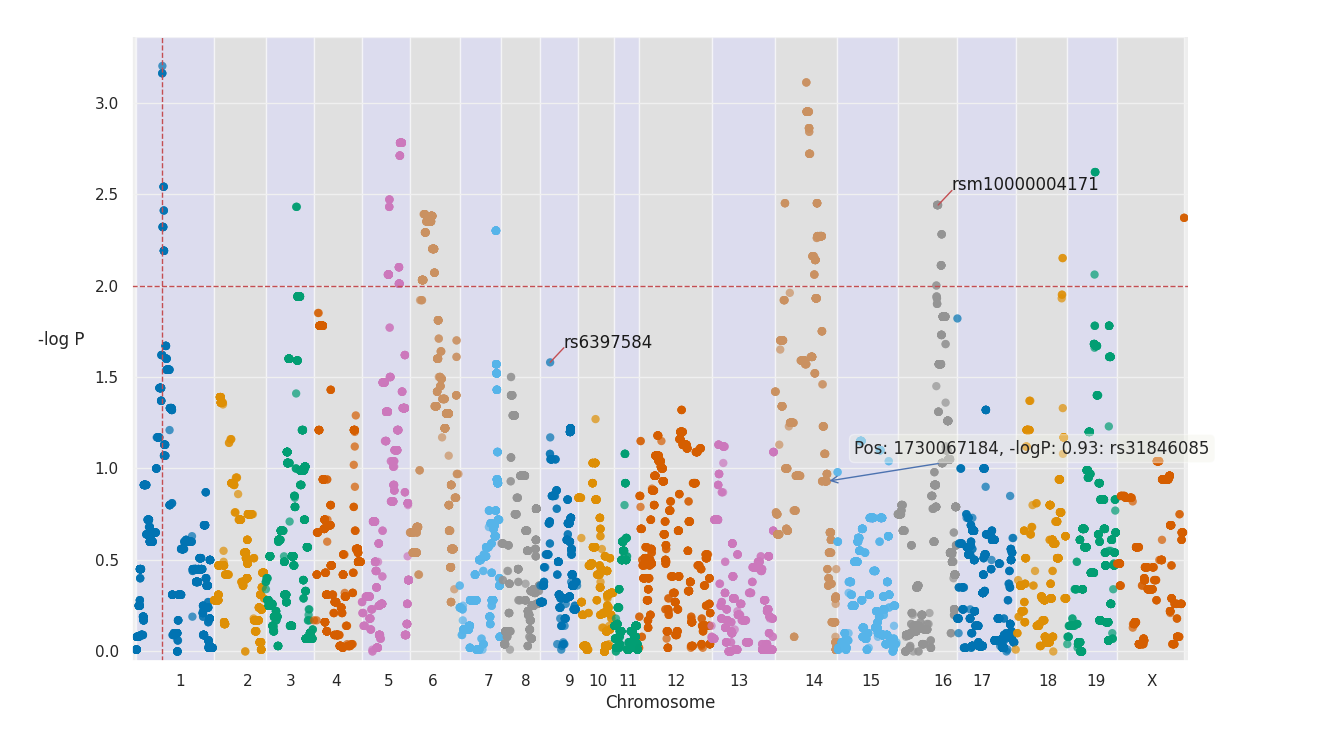
After this, resize the plot and click on markers of interest to select them. The plotter comes with 13 optional command-line arguments that can be used to control various parameters
This option shows the details of the marker the mouse pointer is currently hovering over in a tooltip. Users can right-click to toggle hover on and off.
./plot.py data.csv --hoverThis option makes the plotter use two colors instead of multiple colors.
./plot.py data.csv --two-colorThis option draws a vertical line through the peak value.
./plot.py data.csv --two-colorThis option draws a threshold line at a given -logP value.
./plot.py data.csv --threshold 2.0This option prints debugging-related messages.
./plot.py data.csv -dThis option makes the program draw a QTL plot instead of a Manhattan plot.
./plot.py data.txt --lineWhen passed a file containing names of markers to this option, the program automatically selects (marks) them.
./plot.py data.csv --markers markers.txtPath to the marker file for QTL plots
./plot.py data.txt --line --marker-file qtl_markers.txtTrait name to be selected in the QTL plot. If this is not selected, a fzf-based selection menu is shown.
./plot.py data.txt --line --trait "AT1G01160" --marker-file qtl_markers.txtWhen passed a character, only the chromosome with a matching name is shown.
./plot.py data.csv --chromosome 2This option makes the program draw the SNP density when used in conjunction with --chromosome
./plot.py data.csv --chromosome 2 --snp-densityThis option sets the bin size for SNP density.
./plot.py data.csv --chromosome 2 --snp-density --bin-size 15000When passed the path to a centromere file, it draws vertical lines at the centromere positions.
./plot.py data.csv --centromeres p-arm-length.txtTo draw a Manhattan plot with hovering, peak line, threshold line and centromere lines
./plot.py data.csv --peak --threshold 2.0 --hover --centromeres p-arm-length.txtTo draw a QTL plot with a marker file, hovering, peak line, threshold line and with menu selection for the desired trait
./plot.py data.txt --line --marker-file marker.txt --peak --threshold 1.0 --hoverTo draw the single chromosome ‘2’ with SNP density, hover, peak line and threshold line
./plot.py data.csv --peak --threshold 2.0 --hover --chromosome 2 --snp-density