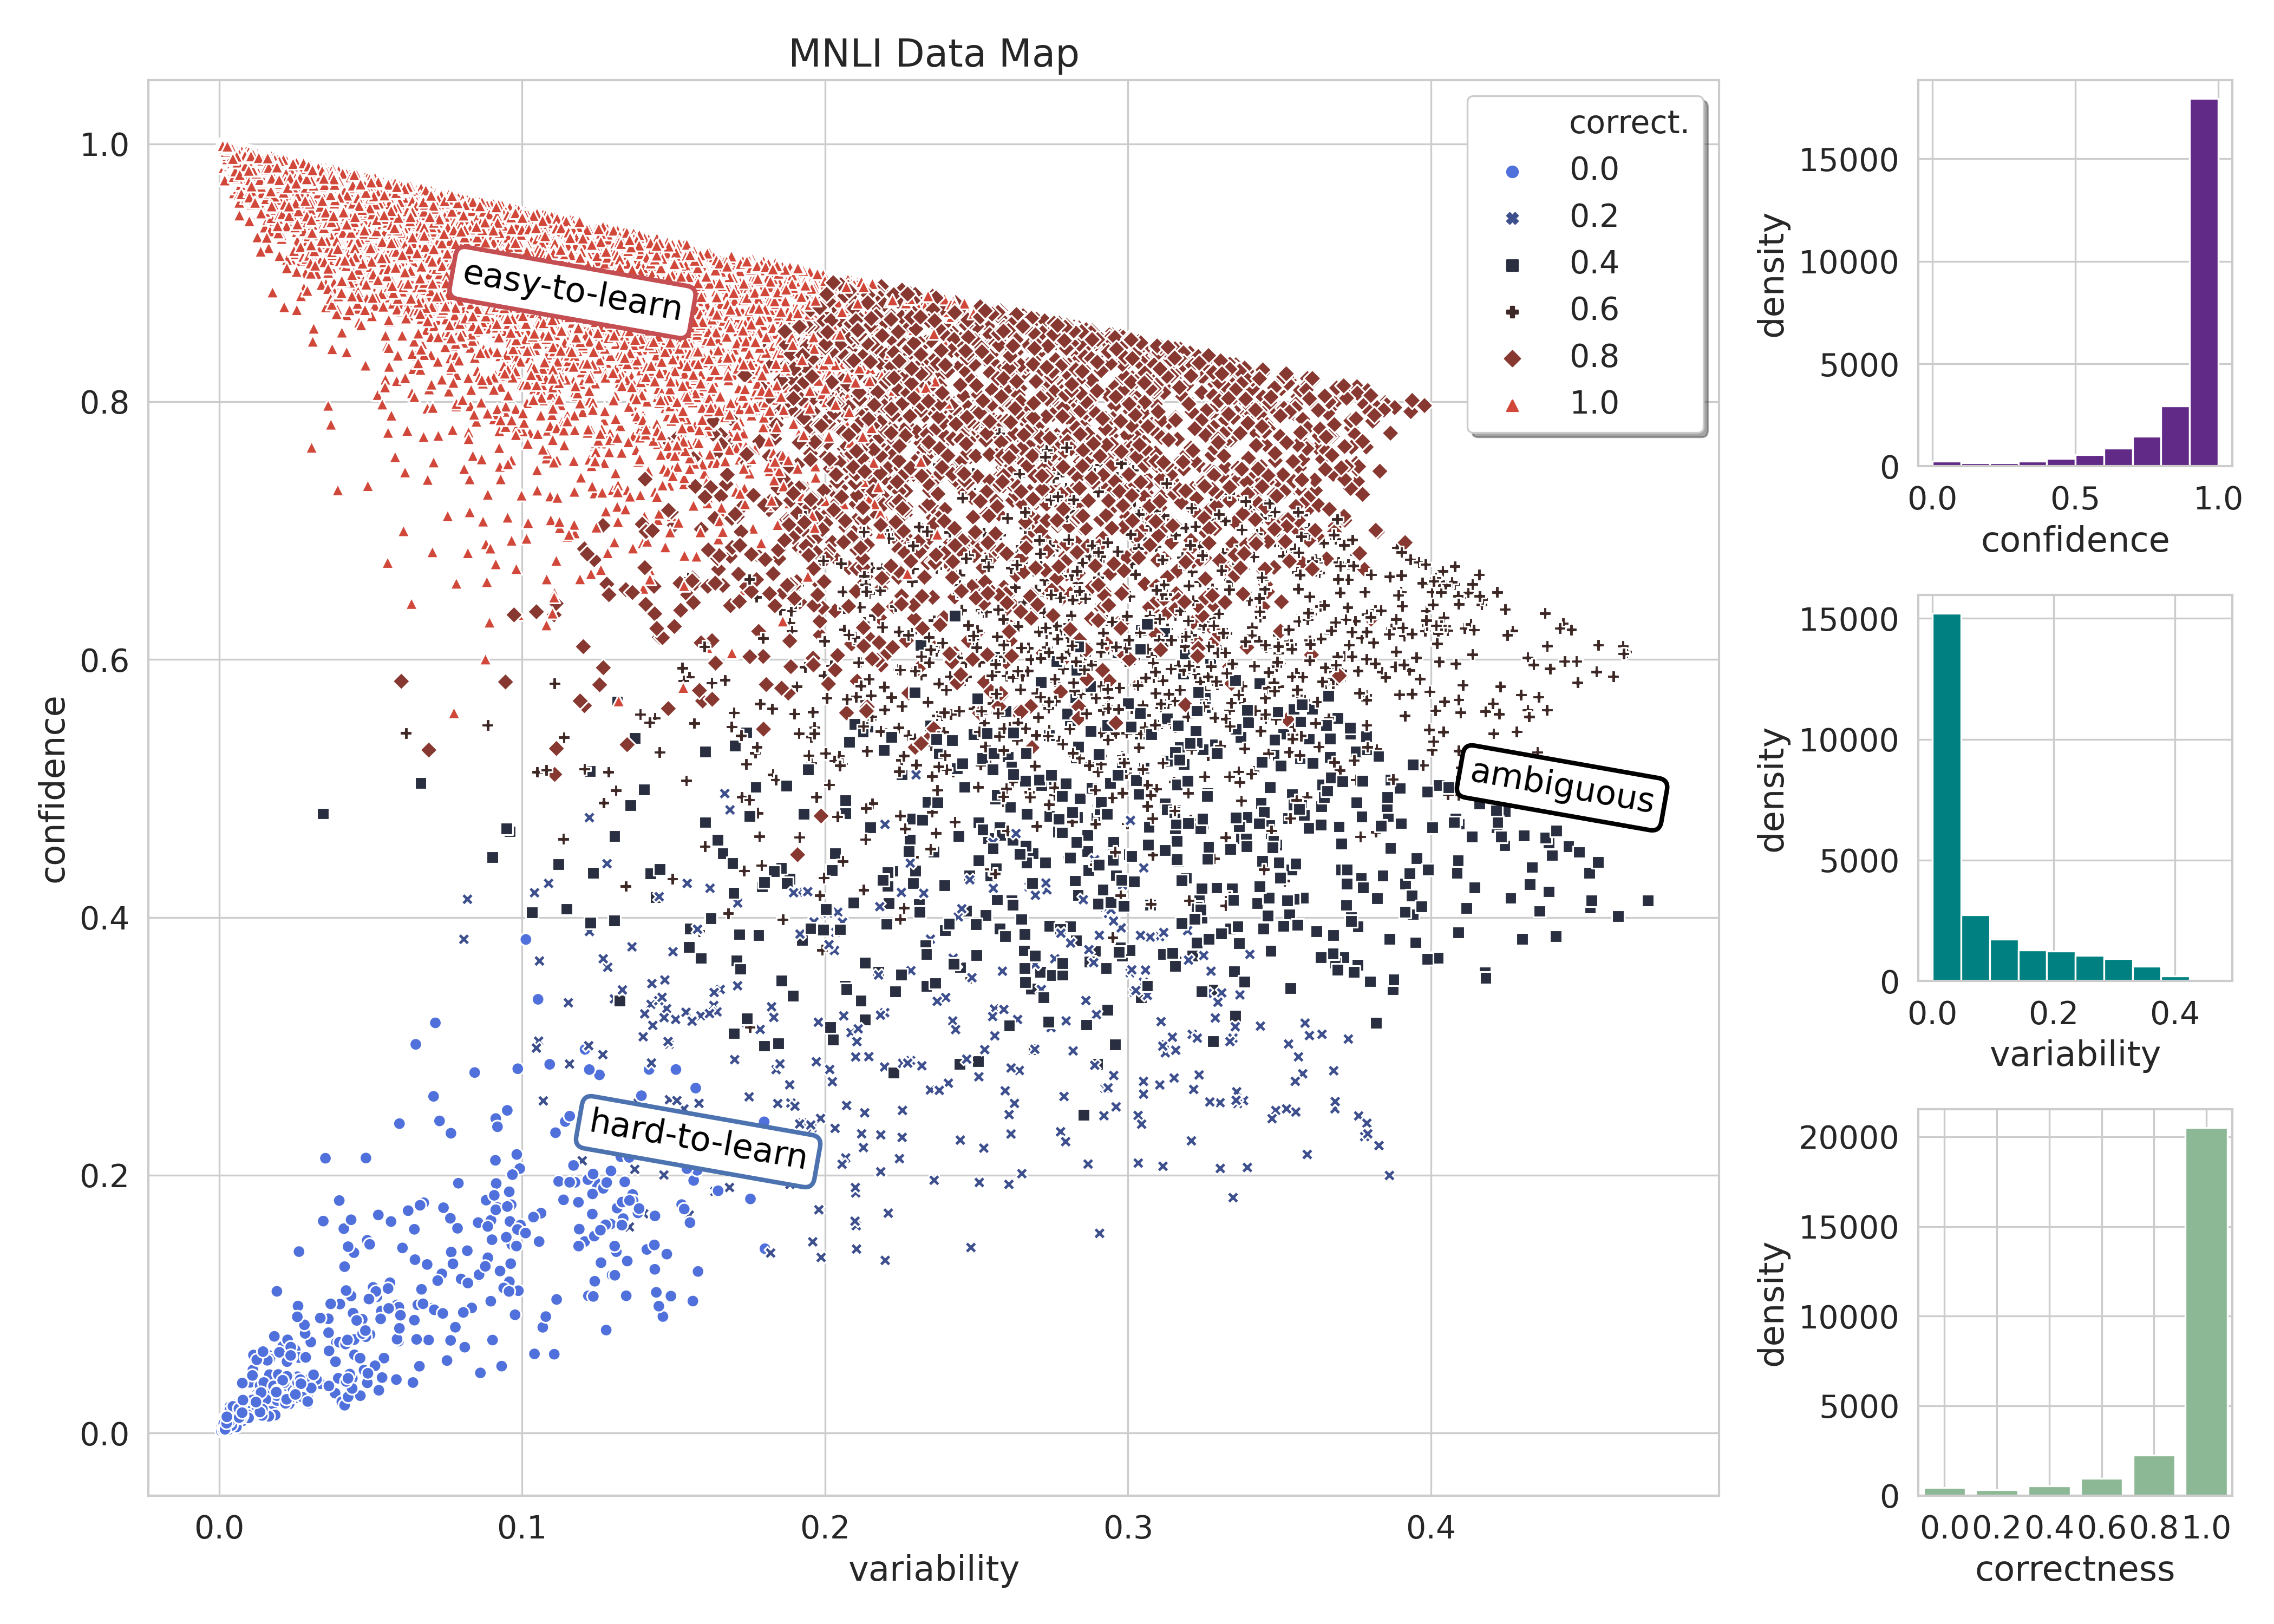
bash scripts/plot.sh
Create the conda environment with
conda env create -f environment.yml
and activate with
conda activate cartography
Download MNLI from https://github.com/nyu-mll/GLUE-baselines and NLI Diagnostics from https://super.gluebenchmark.com/diagnostics.
The first step to reproducing the paper is to finetune RoBERTa-large on the full MNLI dataset and obtain the corresponding data map.
MODEL_OUTPUT_DIR=output/mnli

python -m cartography.classification.run_glue \
    -c configs/mnli.jsonnet \
    --do_train \
    --do_test \
    --train train.tsv \
    -o $MODEL_OUTPUT_DIR
Then we plot the data map!
python -m cartography.selection.train_dy_filtering \
    --plot \
    --task_name MNLI \
    --model_dir $MODEL_OUTPUT_DIR \
    --plot_title "MNLI Data Map"
We compare the result of training on the full data with training on a random 33%, the most hard-to-learn 33%, and the most ambiguous 33% of training data. First, we select each subset of training data by running the following code with METRIC set to each of random, confidence, and variability.
TASK=MNLI
MODEL_OUTPUT_DIR=output/mnli/
DATA_DIR=data/glue/MNLI/
DATA_OUTPUT_DIR=data/glue/MNLI/filtered/$METRIC/

python -m cartography.selection.train_dy_filtering \
    --filter \
    --task_name $TASK \
    --model_dir $MODEL_OUTPUT_DIR \
    --metric $METRIC \
    --output_dir $DATA_OUTPUT_DIR \
    --data_dir $DATA_DIR
Then we train a new model on each of these subsets.
FRACTION=0.33
MODEL_OUTPUT_DIR=output/mnli_ambiguous/ambiguous_$FRACTION

python -m cartography.classification.run_glue \
    -c configs/mnli.jsonnet \
    --do_train \
    --do_test \
    --train filtered/ambiguous/cartography_variability_$FRACTION/train.tsv \
    -o $MODEL_OUTPUT_DIR
We investigate how performance is affected as we vary the size of ambiguous and random subsets. To do this, we run the same scripts as in the previous section but with different values of FRACTION in 0.01, 0.05, 0.1, 0.17, 0.25, 0.33, 0.5, and 0.75.
Then, we select the mixed data.
TASK=MNLI
MODEL_OUTPUT_DIR=output/mnli/
DATA_DIR=data/glue/MNLI/
DATA_OUTPUT_DIR=data/glue/MNLI/filtered/mixed/
METRIC=mixed

python -m cartography.selection.train_dy_filtering \
    --filter \
    --task_name $TASK \
    --model_dir $MODEL_OUTPUT_DIR \
    --metric $METRIC \
    --output_dir $DATA_OUTPUT_DIR \
    --data_dir $DATA_DIR
And train models on the different ratios of mixed data in the same way as before.
First, we initialize our training set train.tsv to randomly selected 10% of the full MNLI training data. Then we train a model on the training set while calculating training dynamics on unlabeled.tsv.
MODEL_OUTPUT_DIR=output/mnli_al_0.1/0/

python -m cartography.classification.run_glue \
    -c configs/mnli.jsonnet \
    --do_train \
    --train al_0.1/train.tsv \
    --dev al_0.1/unlabeled.tsv \
    -o $MODEL_OUTPUT_DIR
We consider setting METRIC to mean_variance, final_confidence, and random, which defines our selection strategy for choosing examples from unlabeled.tsv. Then, for each iteration, we run the following commands:
- Select the data according to the selection strategy. Since we set n to be 5% of the full MNLI training data, this is equivalent to
n=19635.
TASK=MNLI
MODEL_OUTPUT_DIR=output/mnli_al_0.1/$METRIC/$(($ITERATION-1))/
DATA_DIR=data/glue/MNLI/al_0.1/
DATA_OUTPUT_DIR=data/glue/MNLI/al_0.1/$METRIC/$ITERATION/

python -m cartography.selection.train_dy_filtering \
    --filter \
    --n 19635 \
    --task_name $TASK \
    --model_dir $MODEL_OUTPUT_DIR \
    --metric $METRIC \
    --output_dir $DATA_OUTPUT_DIR \
    --data_dir $DATA_DIR \
    --data_file unlabeled.tsv \
    --split 'dev'
- Concatenate the selected data with the training data from the previous iteration.
python -m cartography.selection.append_selected \
    --metric $METRIC \
    --it $ITERATION
- Retrain a model on the augmented training data.
MODEL_OUTPUT_DIR=output/mnli_al_0.1/$METRIC/$ITERATION/

python -m cartography.classification.run_glue \
    -c configs/mnli.jsonnet \
    --do_train \
    --train al_0.1/$METRIC/$ITERATION/cartography_${METRIC}_19635/train.tsv \
    --dev al_0.1/unlabeled.tsv \
    -o $MODEL_OUTPUT_DIR
These commands can be chained together with a job scheduler like the slurm workload manager on hyak. You can run the entire experiment at once with
id=$(sbatch --parsable scripts/train.sh)

for metric in random mean_variability final_confidence
do
    for iteration in 1 2 3 4
    do
        id=$(sbatch --parsable --dependency=afterany:$id --export=METRIC=$metric,ITERATION=$iteration scripts/select_unlabeled_data.sh)
        id=$(sbatch --parsable --dependency=afterany:$id --export=METRIC=$metric,ITERATION=$iteration scripts/combine_train_selected.sh)
        id=$(sbatch --parsable --dependency=afterany:$id --export=METRIC=$metric,ITERATION=$iteration scripts/train_al.sh)
    done
done
where scripts/select_unlabeled_data.sh, scripts/combine_train_selected.sh and scripts/train_al.sh each contain the commands described above.

