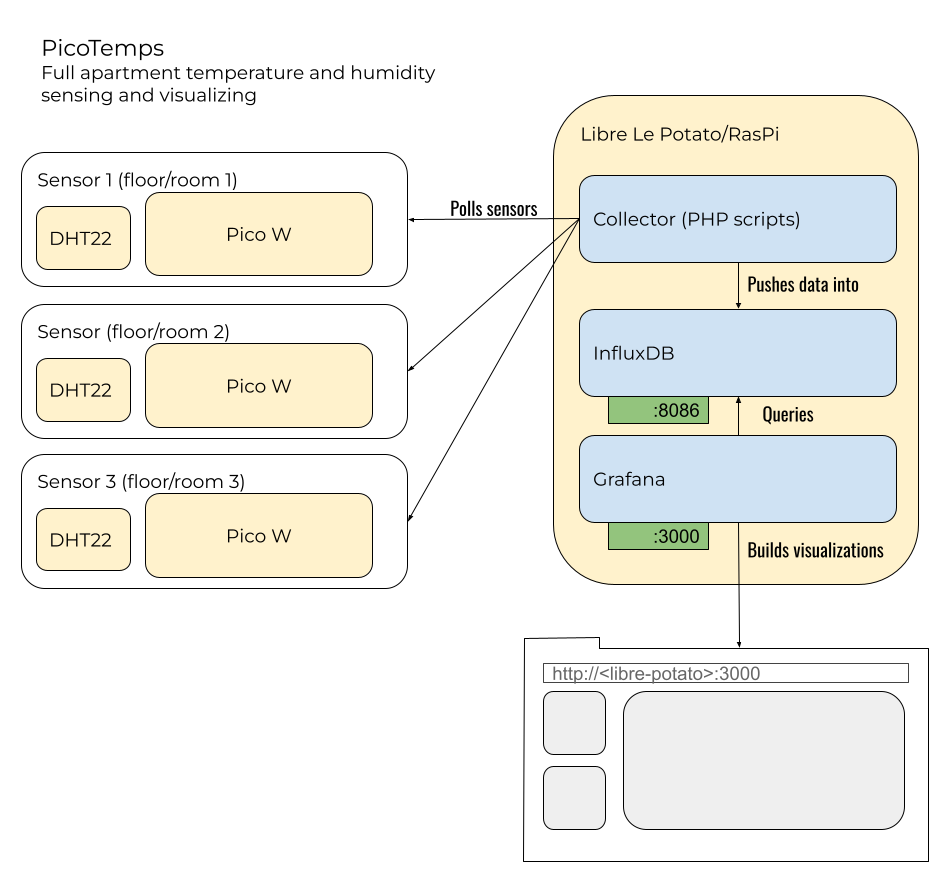
- A network of Raspberry Pi Pico Ws with DHT22 sensors from which temperature and humidity data is served via http requests.
- A centralized client which:
- Pulls data from the Picos
- Pushes that data into a local InfluxData instance
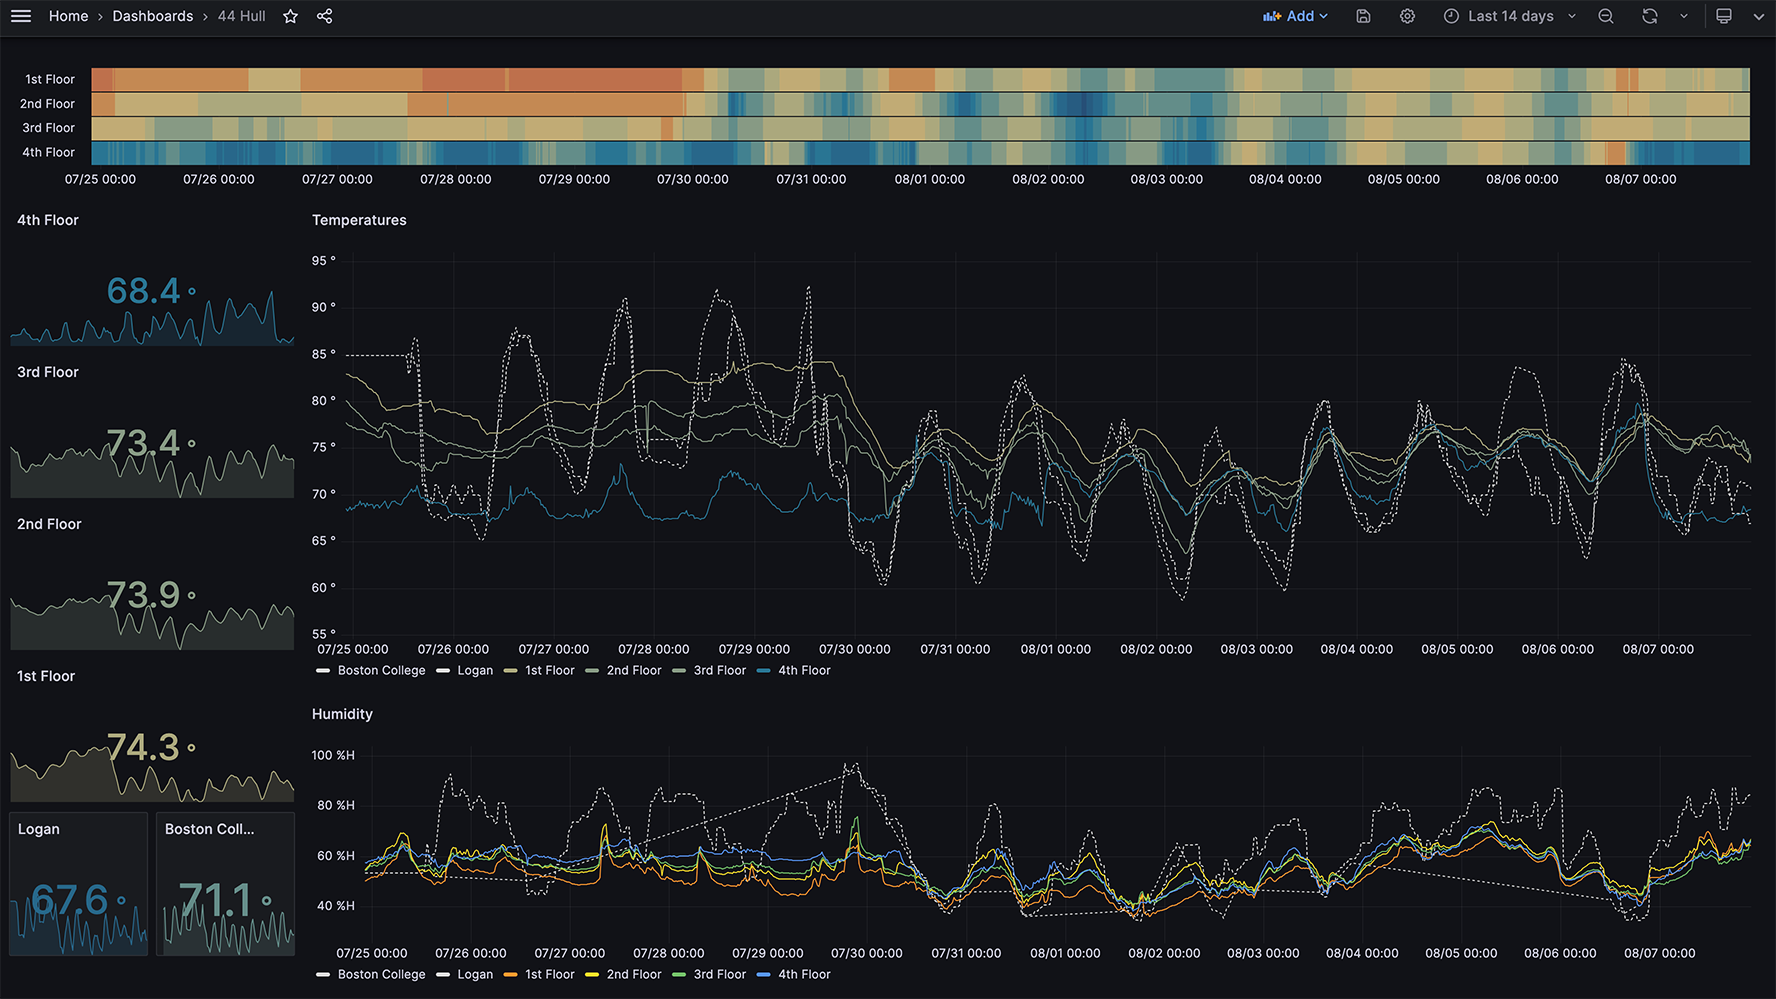
- Builds vizualizations for a web browser with Grafana
Anyone who needs granular data on temperature and humidity throughout their home. This is especially useful for homes that span multiple floors or have multiple HVAC zones.
- Sensors -> hardware
- Raspberry Pi Pico W
- DHT22
- Centralized client -> software
Level 1 C4 model diagram of PicoTemps:

Each sensor consists of two pieces of hardware:
This assumes that your DHT22s came with a board that includes a resistor on GPIO pin.
| DHT22 Pin | Pico Pin |
|---|---|
| + | 3V |
| GPIO | GP2 |
| - | GND |
The /picofiles directory contains python files for the Raspberry Pi Pico Ws.
The Pico Ws must be running rp2-pico firmware > 1.19.1. Anything with network and socket precompiled will do. See
this guide for instructions on installing the firmware.
Once the firmware is in place:
- Place a copy of
./picofiles/tempbotconfig.pyon the Pico with customized values for the WiFi SSID and password and unique identifier for the Pico. - Place a copy of
./picofiles/tempBot.pyon the Pico and rename it tomain.py.
You need a centralized client on the same network as the Pico Ws with PHP >= 8.1. In this case, we used a Libre Computer Le Potato; but any computer will do.
The client needs the following software:
- This repo and its dependencies (including platform dependencies like PHP >= 8.1)
$ git clone git@github.com:balsama/picotemps.git $ cd picotemps $ composer install - InfluxDB | See https://portal.influxdata.com/downloads/ for detailed instructions. Below is an example for ARM64 Ubuntu.
$ wget -q https://repos.influxdata.com/influxdata-archive_compat.key $ echo '393e8779c89ac8d958f81f942f9ad7fb82a25e133faddaf92e15b16e6ac9ce4c influxdata-archive_compat.key' | sha256sum -c && cat influxdata-archive_compat.key | gpg --dearmor | sudo tee /etc/apt/trusted.gpg.d/influxdata-archive_compat.gpg > /dev/null $ echo 'deb [signed-by=/etc/apt/trusted.gpg.d/influxdata-archive_compat.gpg] https://repos.influxdata.com/debian stable main' | sudo tee /etc/apt/sources.list.d/influxdata.list $ sudo apt-get update && sudo apt-get install influxdb2 - Grafana | See https://grafana.com/grafana/download/ for detailed instructions. Below is an example for ARM64 Ubuntu
$ sudo apt-get install -y adduser libfontconfig1
$ wget https://dl.grafana.com/oss/release/grafana_10.0.3_arm64.deb
$ sudo dpkg -i grafana_10.0.3_arm64.deb
Copy the config/example.config.yml file to config/config.yml and edit to match your setup. At a minimum, you will need to set values for:
- sensors (
sensor_id: ip_address) - influx (
influx_urlandinflux_token) - the InfluxDB token can be generated from the InfluxDB web interface which can be found at port :8086 of the host machine by default.
./scripts/run.php will poll each of the clients every ~20 seconds and push the data to InfluxDB. Or you can use scripts/run_once.php and call it periodically via cron.
A sample Grafana dashboard is exported in JSON at grafana/grafana_dashboard_config.json. It will need to be tweaked to match your sensor IDs/rooms, but could be used as a starting point. The threshold mappings for temperature color coding could be especially useful.
