D3 modules dependency time graphs
As of today, this script create dependency graphs of D3 modules, for d3 version 4+.
In the future it might support generic npm modules.
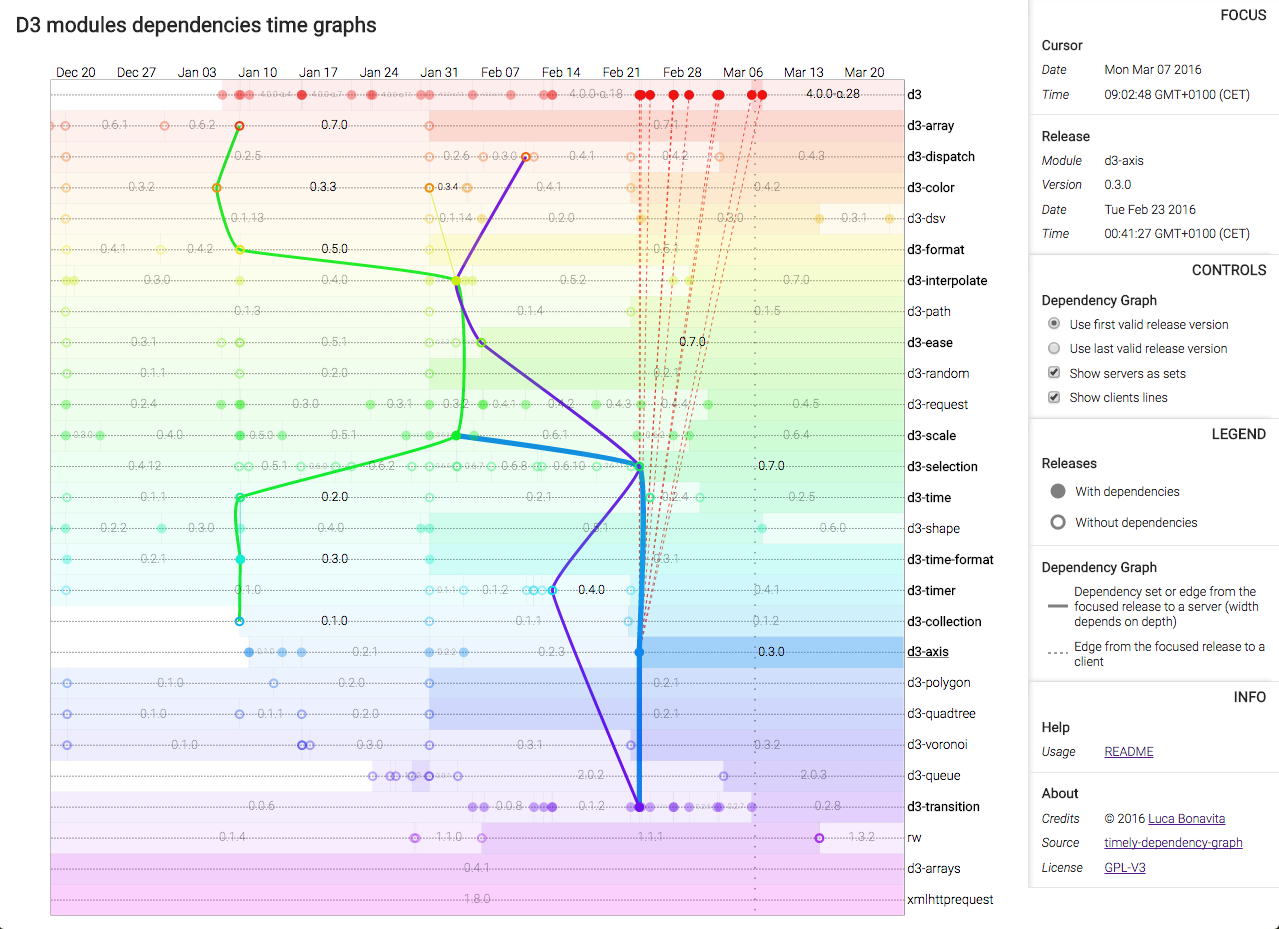
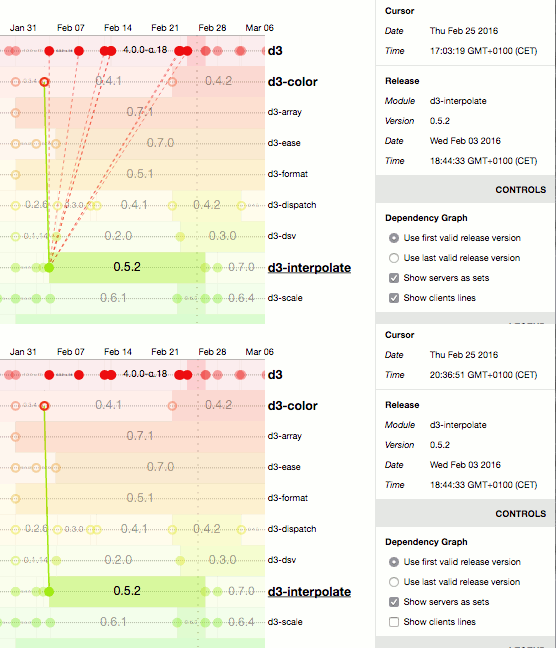
Focusing on a certain release of a d3 module, you can visualize its dependencies tree and the modules that depends on the focused release.
Usage
Interaction
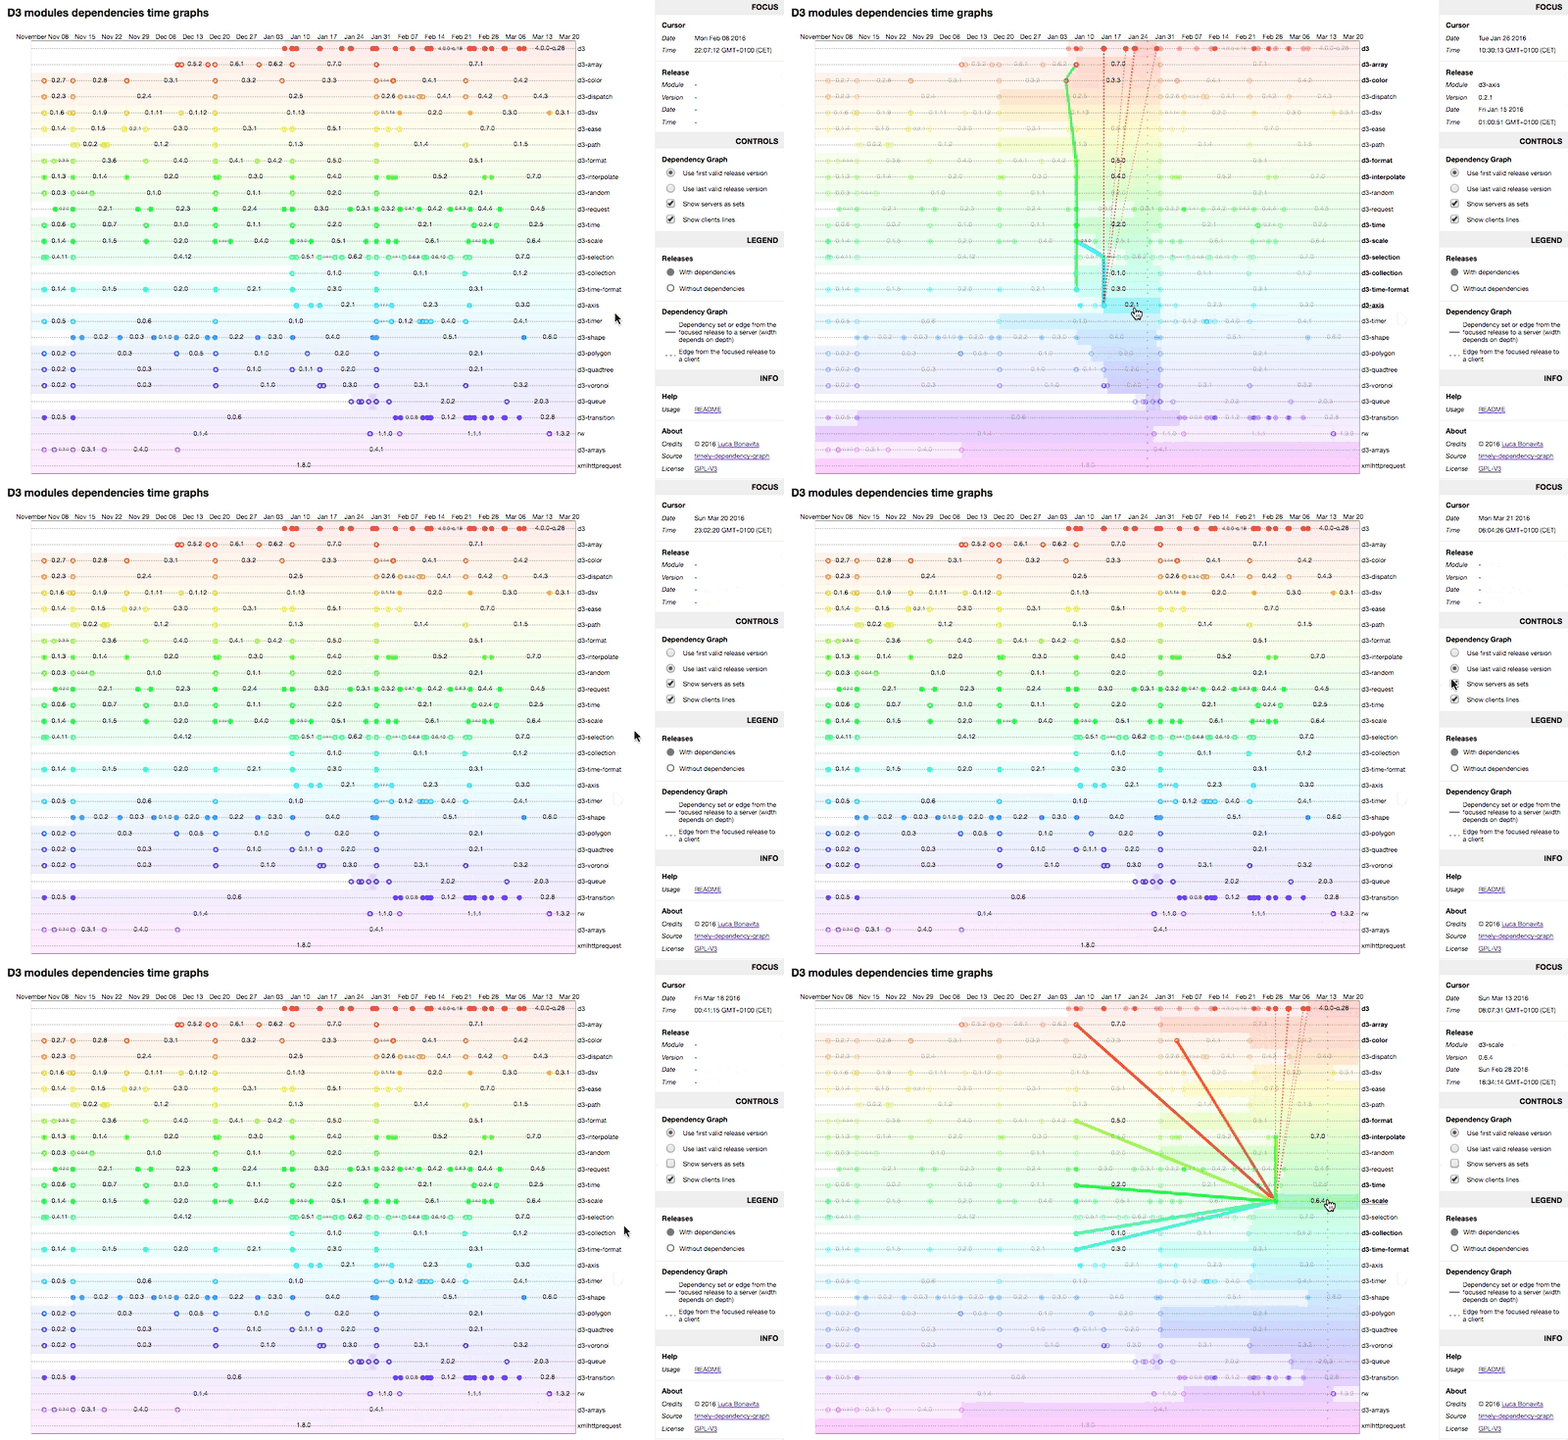
- With the mouse, hover the release rectangles to show their dependencies graph
clickon a release: pin/unpin it (then you can change how to display the dependencies graph using sidebar's controls)mouse wheel: zoom in and outmouse drag: pan left-right
UI terminology
server: a module the focused release depends onclient: a module depending on the hovered release
(this will most certainly change in the future)
Sidebar
FOCUS panel
Shows:
- the cursor date and time
- the hovered release
name,version,dateandtime
CONTROLS panel
-
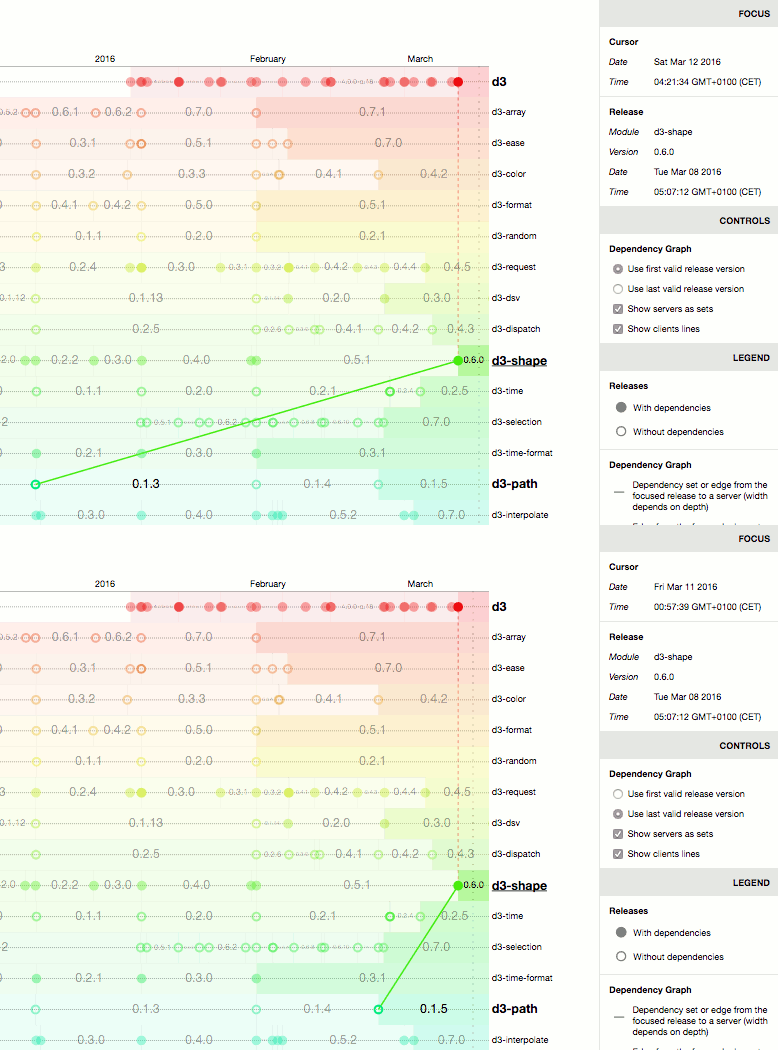
Choose how you want to inspect dependencies release date.
For example,
d3-shapeversion0.6.0depends ond3-pathversion~0.1.3. In semver lingo this is a versionrangemeaning>=0.1.3 <0.2.0, hence as of now:- the first valid version of
d3-pathas a dependency ofd3-shape0.6.0is0.1.3; - the last valid version of
d3-pathas a dependency ofd3-shape0.6.0is0.1.5.
- the first valid version of
-
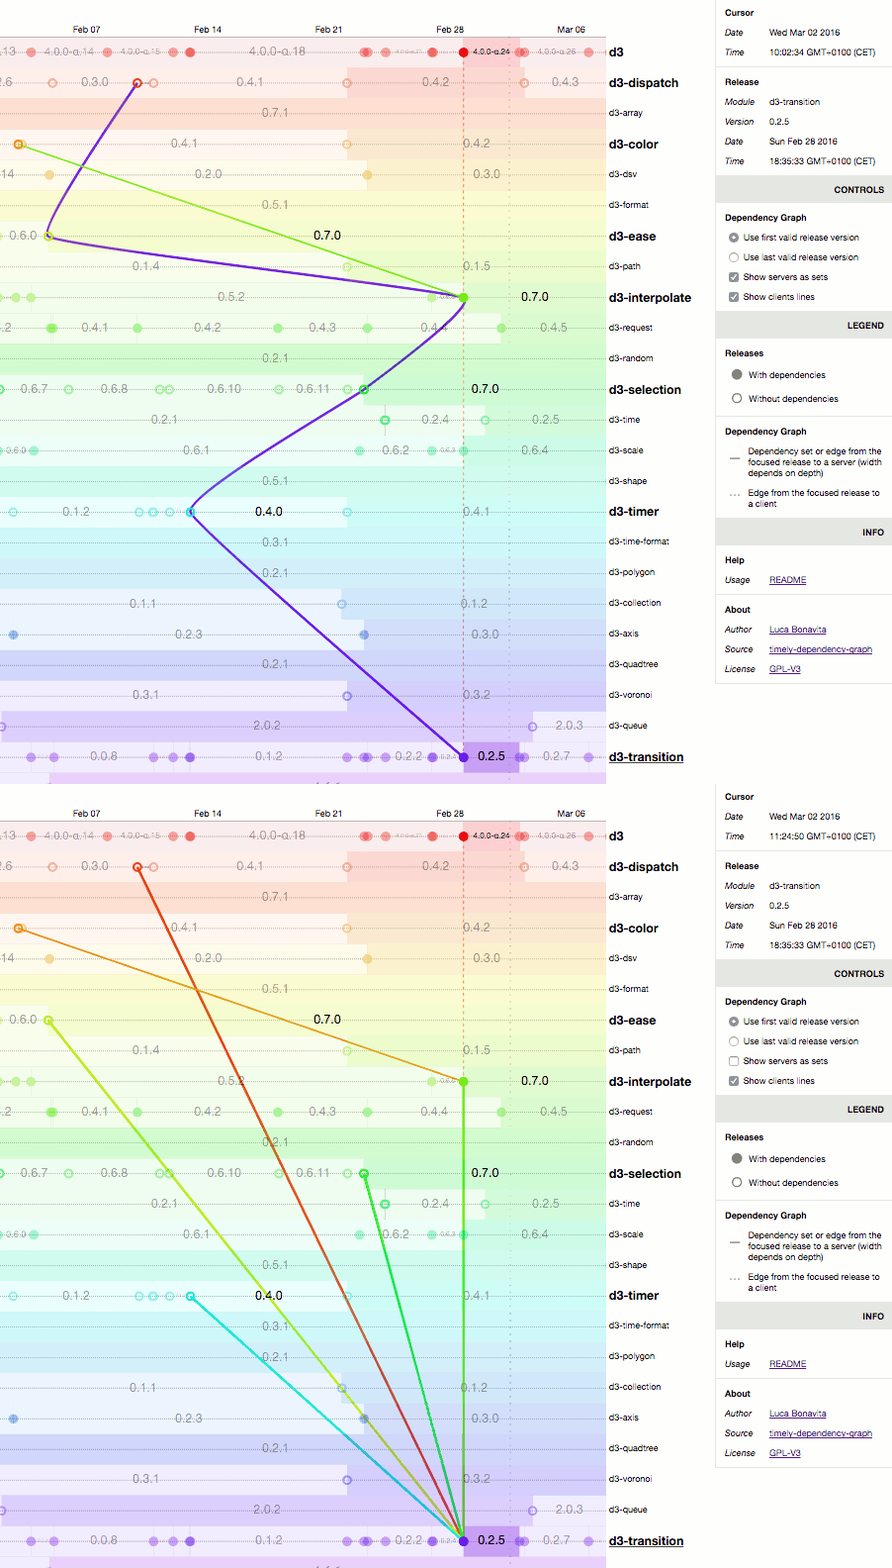
Choose how to visualize "servers" (dependencies):
- as "sets" (lines passing through the focused release and all servers);
- as links between each server and the focused release.
Note that dependencies graph is a tree (because dependencies have their own dependencies):
- since a set is basically a subtree, the color of a set is the color of the module originating that subtree;
- links, instead, gets the color of the dependency.
-
Choose if you want to see "client lines", links between the focused release and its clients.
LEGEND panel
Shows graphs elements representation associated with their meaning. Well, it's a legend :)
To run it locally
Install dependencies:
- [optional] install
nodeandnpmon your system cd <your work directory>clone git@github.com:mindrones/timely-dependency-graph.gitcd timely-dependency-graphnpm install
Run:
gulp- when prompted, navigate to http://localhost:8001
