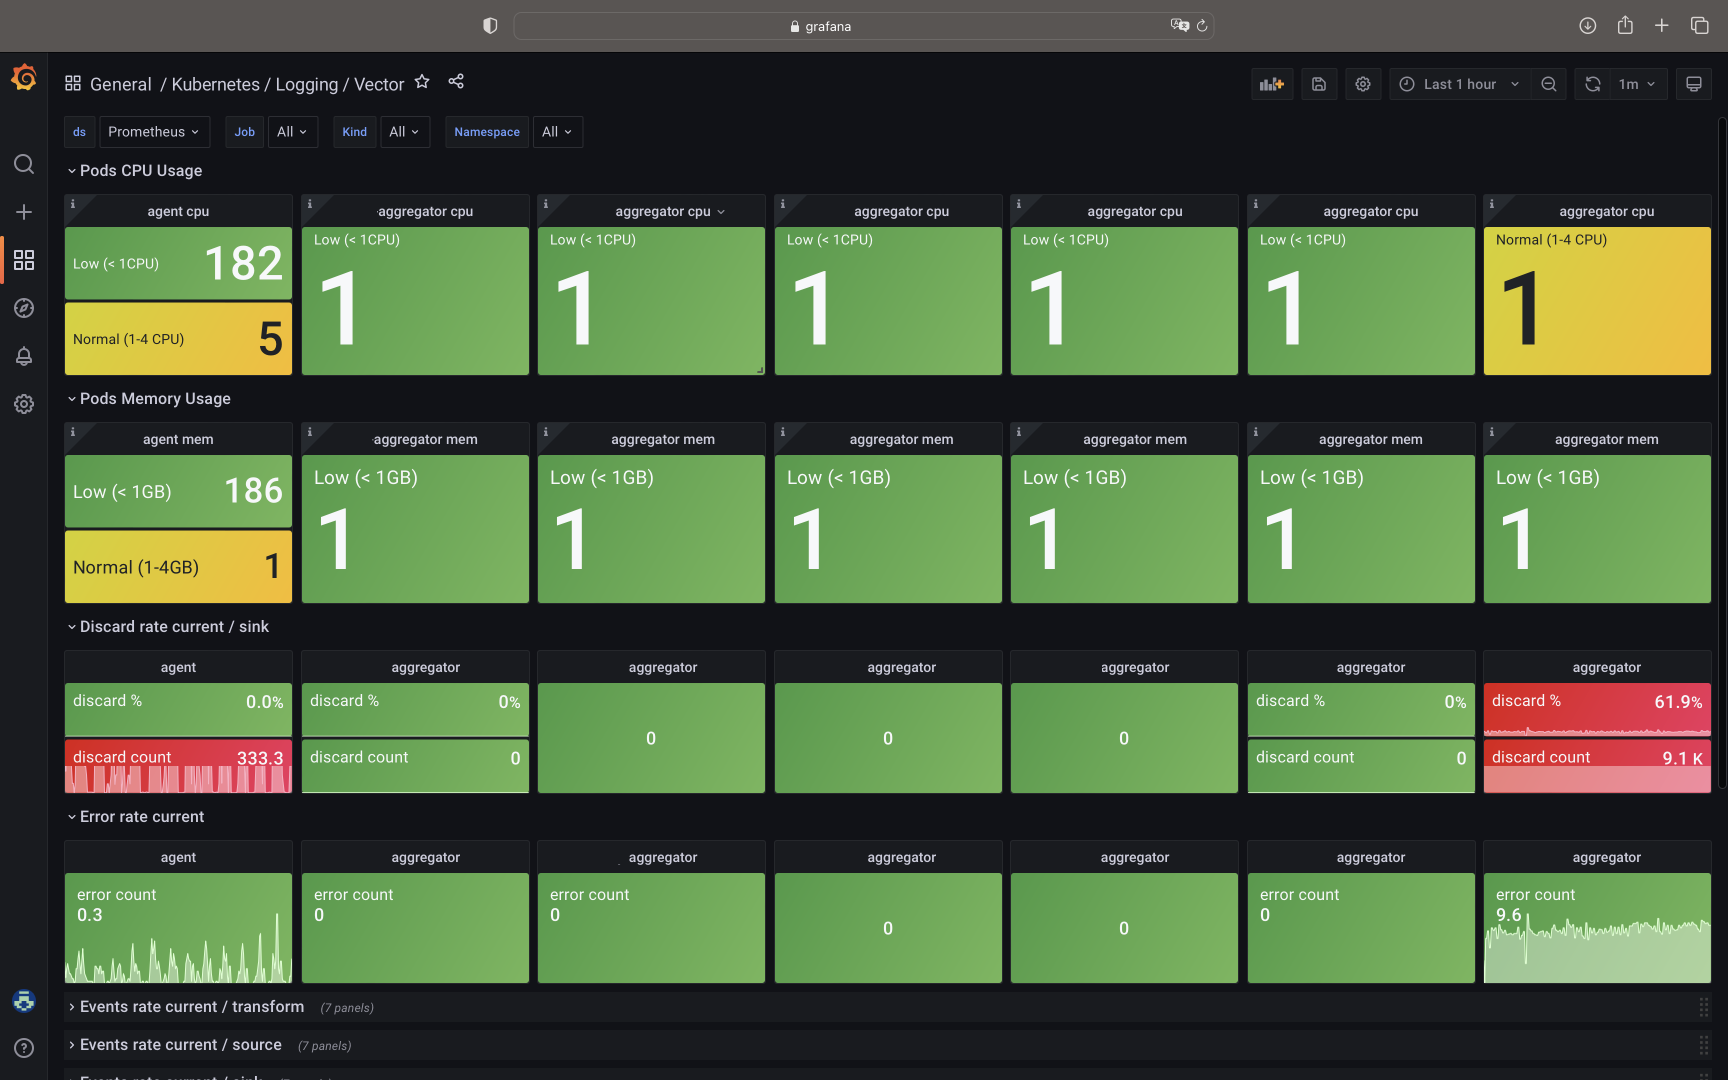
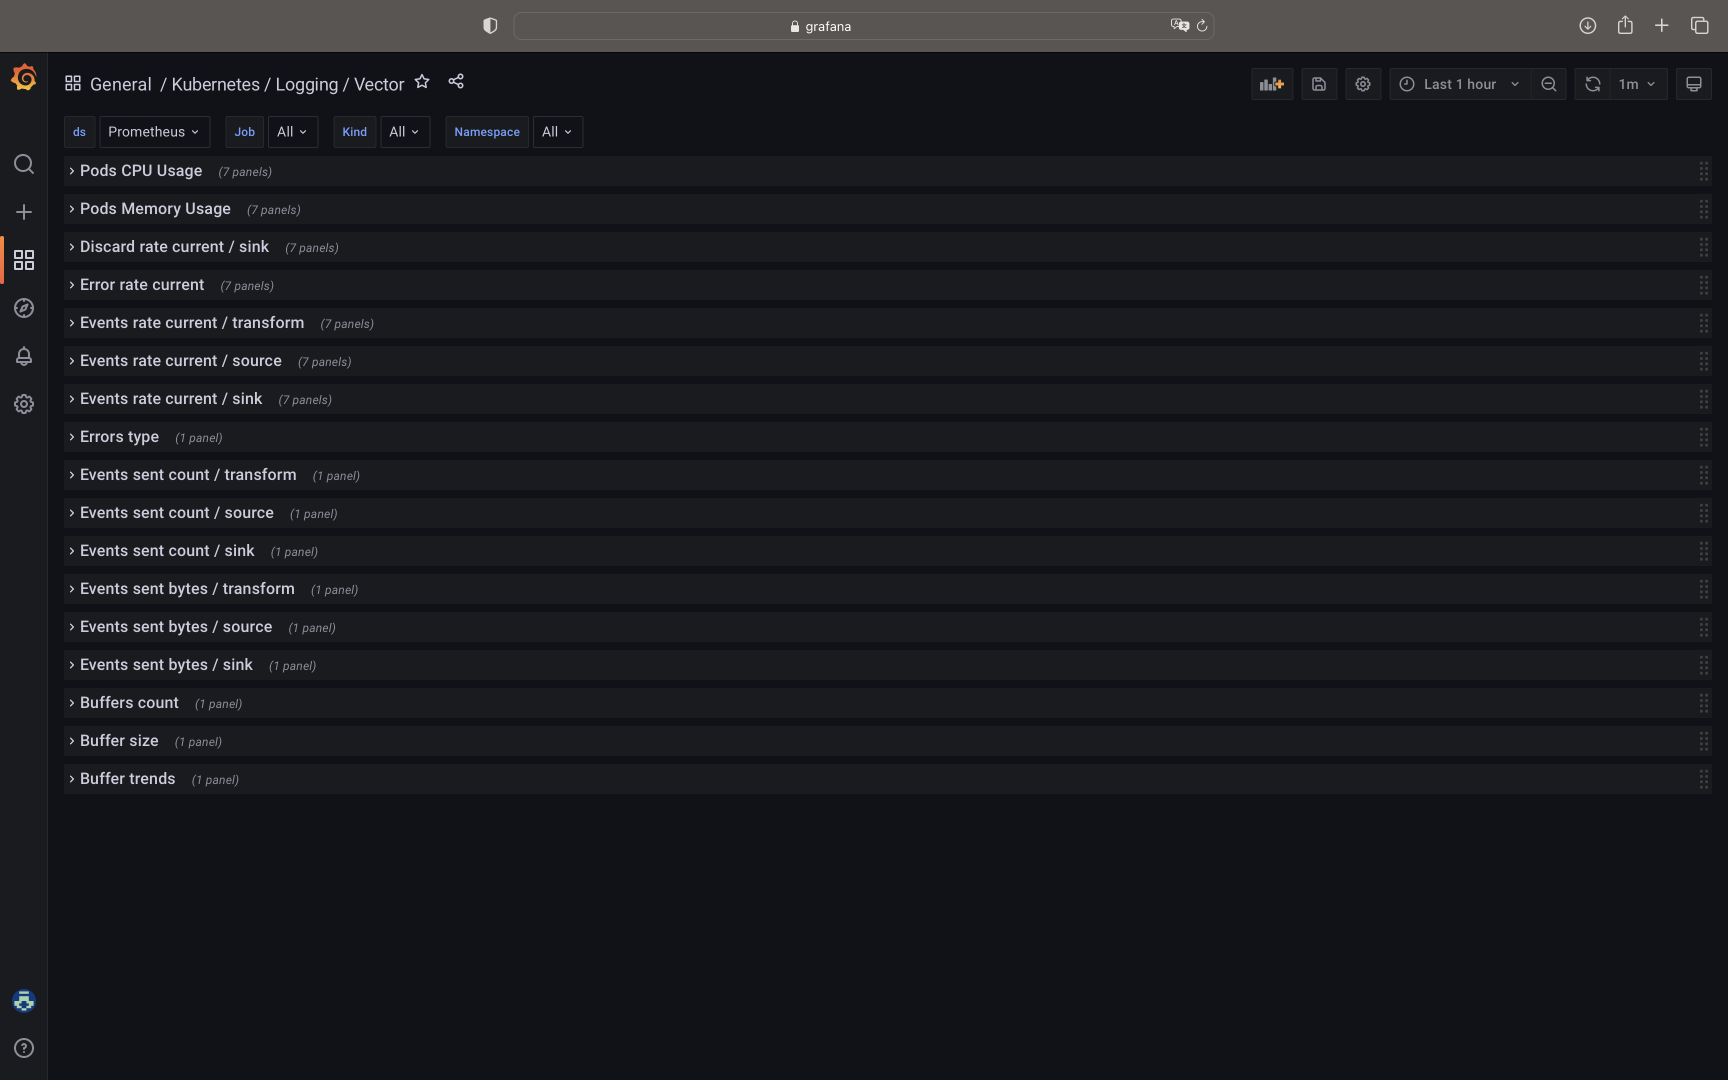
This dashboard was developed with Kubernetes logging in mind.
- Pods CPU Usage
- Pods Memory Usage
- Discard rate current / sink
- Error rate current
- Events rate current / transform
- Events rate current / source
- Events rate current / sink
- Errors type
- Events sent count / transform
- Events sent count / source
- Events sent count / sink
- Events sent bytes / transform
- Events sent bytes / source
- Events sent bytes / sink
- Buffers count
- Buffer size
- Buffer trends
- Download the dashboard from
dashboards/k8s-vector-grafana-dashboard.jsonor Grafana Dashboard Page - Follow the instructions from the official Grafana's manual
Feel free to ask for help or contribute.

