
Power BI as Tableau is a data visualization tool which provides pictorial and graphical representations of data.
Your goal in this lab is to create a Power BI dashboard that shows the insights you find useful from de given data.
In the data folder you will find the following files:
1. classicmodels.sql : the classicmodels database (you can import it directly if you are using tableau desktop)
2. ERD.png : the ERD of the classicmodels database
3. .xlsx file : This excel file contains the data displayed in several sheets inside the file. You'll have to build the relationships between tables on your own.
Open Power BI in your laptop and import the data.
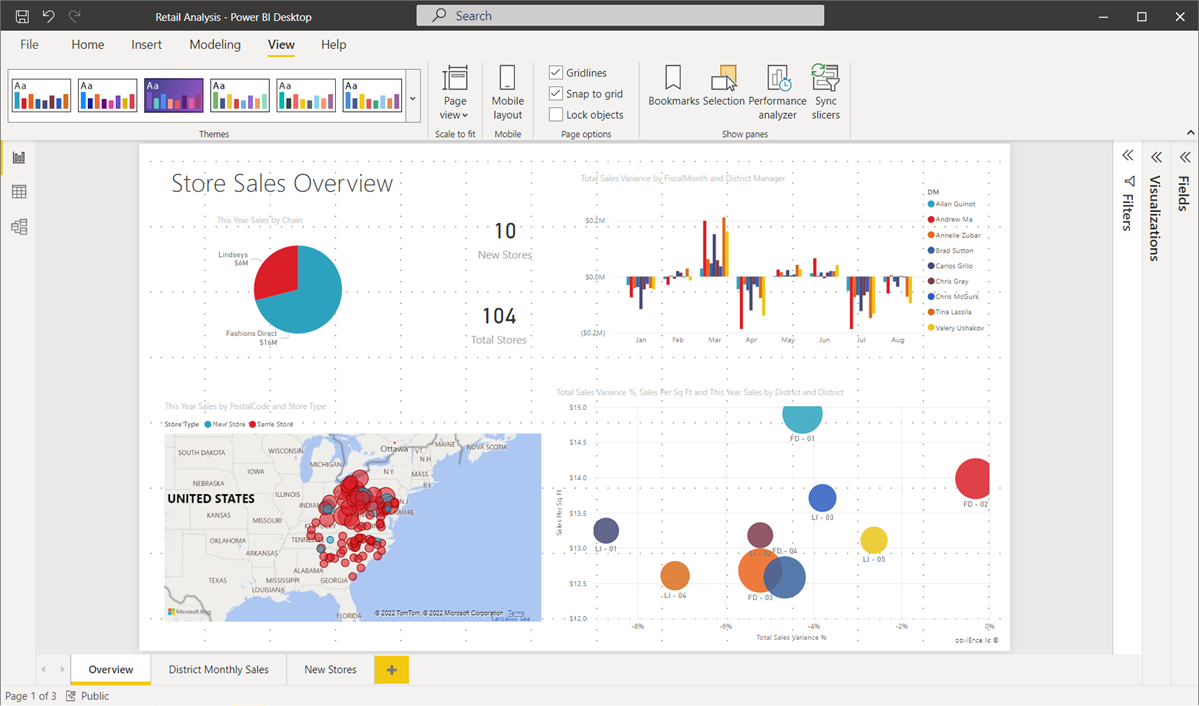
Create at least 5 different figures explaining different insights, pay attention to the details, choose the proper figures and/or tables, build the figures coherently with each other (example: if china is red in a graph it shoul be associated to red everywhere).
Create a dashboard where you structure the info in the sheets in a way that everything make sense, it's easily readable and self explanatory. It must have at least two pages.
Export the dashboard to a .pbix file and upload it to your Github repository.
🔥 In case Github can´t handle your huge dashboard... 🔥 Export your dashboard to pdf or screenshot each page and paste it in a Power Point presentation.
Add this file to your repository.
Add your deliverables to git. Then commit, add and push your branch to the remote.
Don't forget to create a pull request!
💀(In case you have doubts about the pull request click here)