afcarl / Data-Visualizations-For-Python

A collection of useful snippets for clean data visualizations in Python (with matplotlib)

Geek Repo:Geek Repo

Github PK Tool:Github PK Tool

PythonDataVizUtils

A collection of useful snippets for clean data visualizations (for reporting, publications, blog posts etc.) in Python with matplotlib

Structure

Each visualization consists of:

  • A Jupyter notebook to create the visualization with Python and matplotlib
  • A .pdf render of the visualization

Requirements

  • Python (2 or 3)
  • Matplotlib (for visualization), Numpy (to generate data)
Portfolio

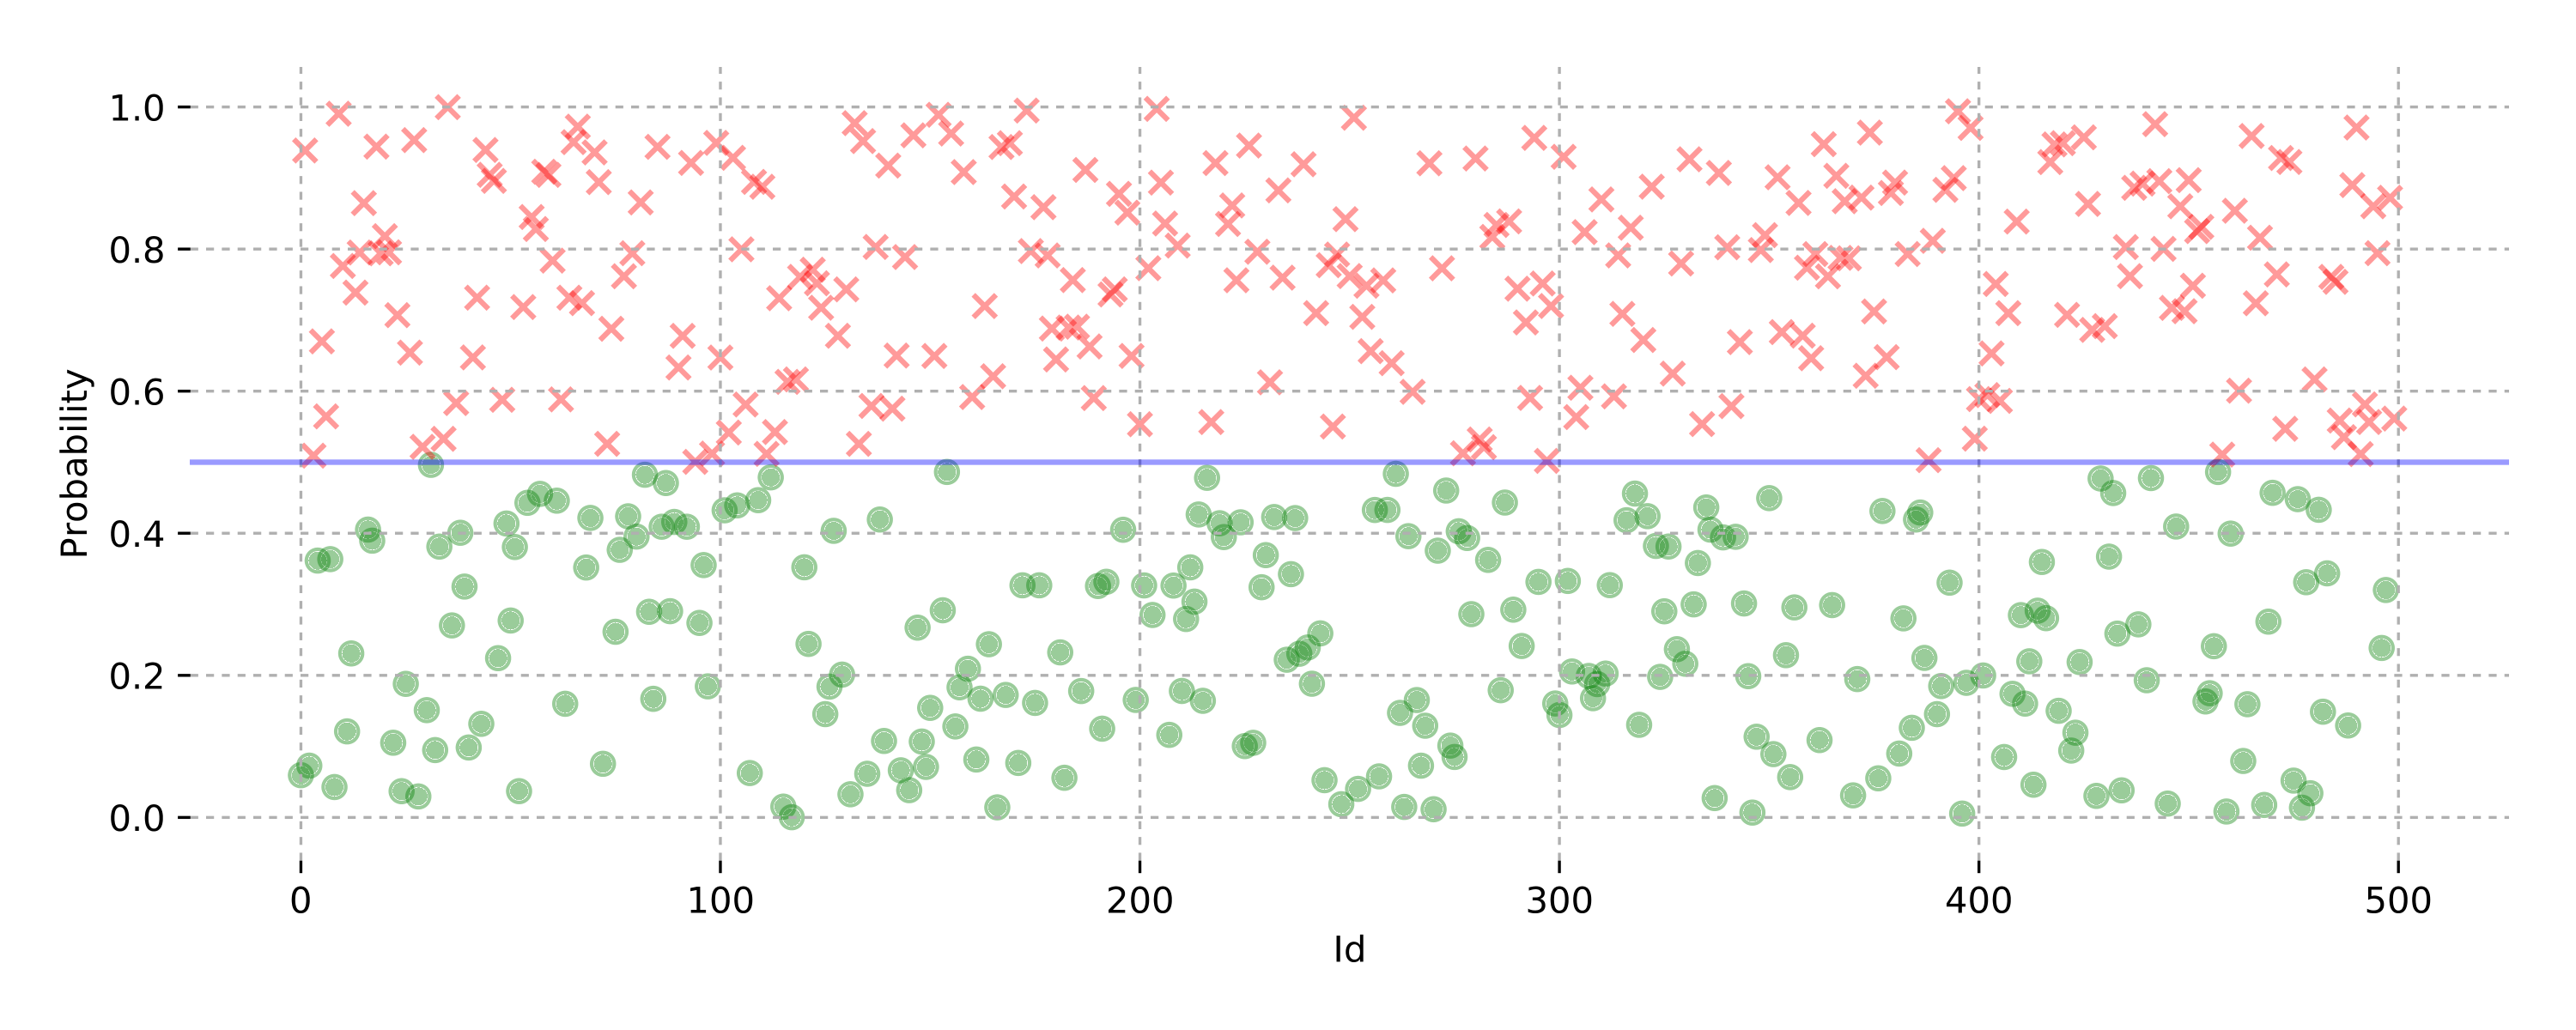
2_Categories_Scatter_Plot.png

Scatter Plot

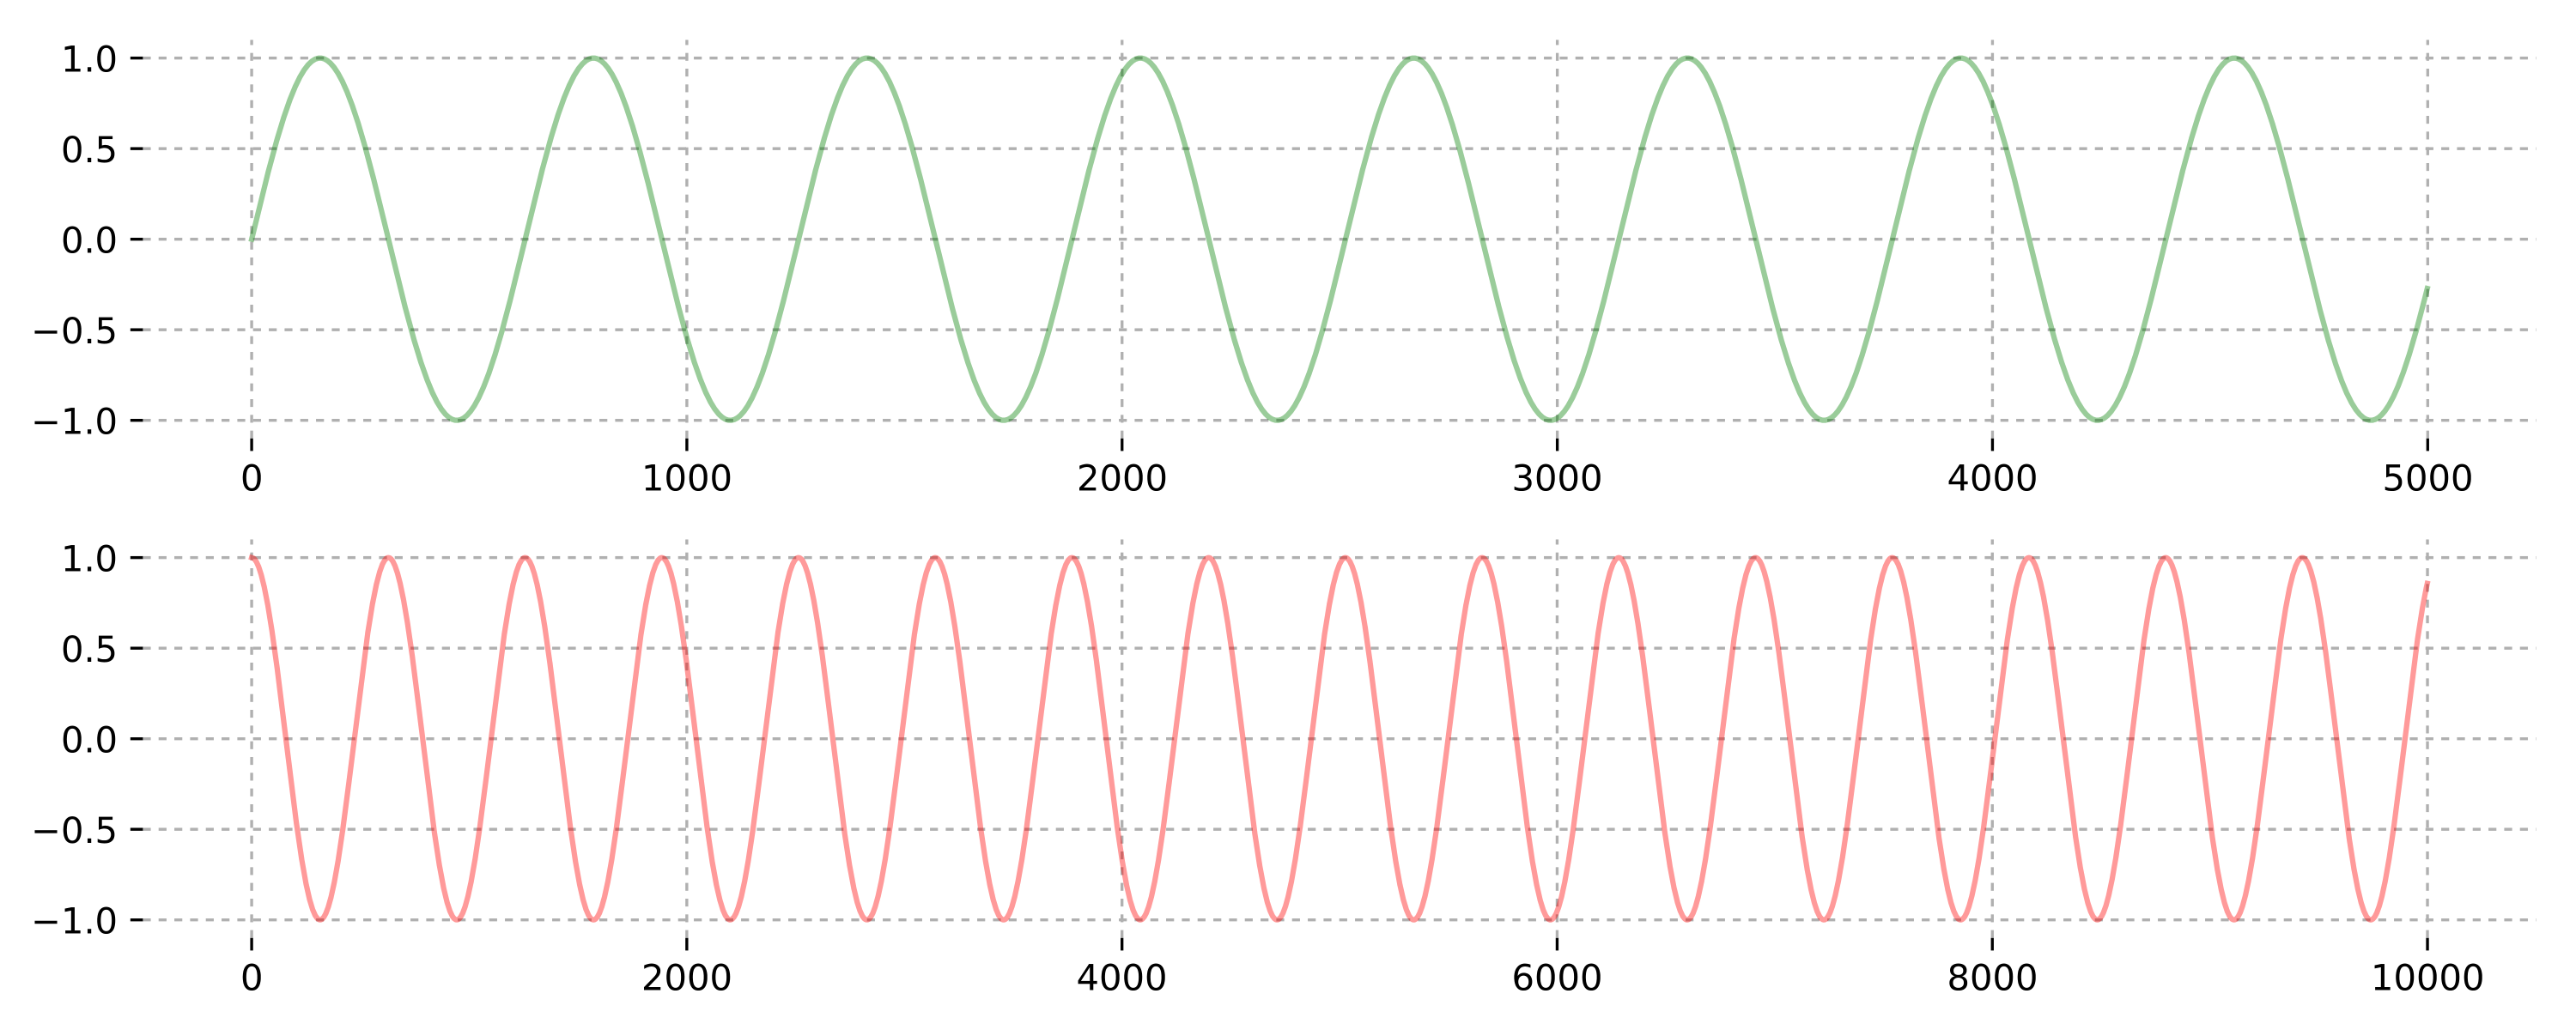
2_Subplots_Vertically_Stacked.png

Vertically Stacked Subplots

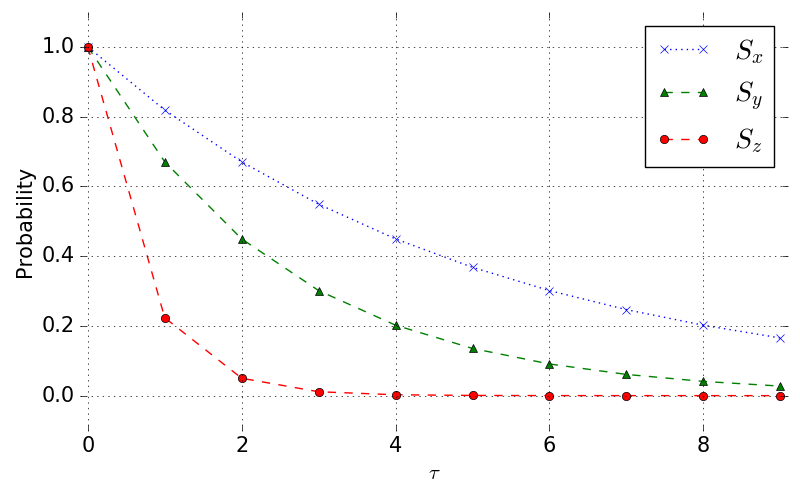
3_Lines_Multi_Marker_Legend.png

Multi Marker 3 Lines With Legend

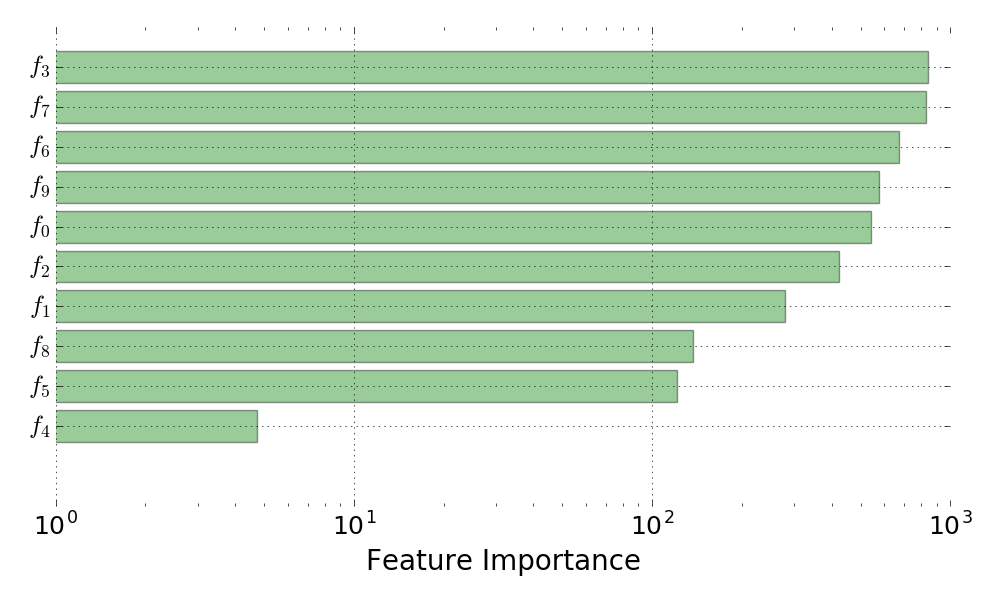
Horizontal_Bar_Chart_Log_Scale.png

Horizontal Bar Chart in Log Scale

About

A collection of useful snippets for clean data visualizations in Python (with matplotlib)


Languages

Language:Jupyter Notebook 100.0%