- Project Overview
- Project Details
- Project Submission
- Results
- Licensing, Authors, and Acknowledgements
You're a business analyst for Round Roasters, a coffee restaurant in the United States of America. The executive team conducted a market test with a new menu and needs to figure whether the new menu can drive enough sales to offset the cost of marketing the new menu. Your job is to analyze the A/B test and write up a recommendation to whether the Round Roasters chain should launch this new menu. How Do I Complete this Project?
This project uses skills learned throughout the "A/B Testing ” course. To complete this project:
- Go through the course
- Apply the skills learned in the course to solve the business problem given in the project details section.
- Use our guidelines and rubric to help build your project.
- When you're ready, submit it to us for review using the submission template found in the supporting materials section.
Skills Required
In order to complete this project, you must be able to:
- Cleanup, format, and blend a wide range of data sources
- Plan and analyze A/B tests
Round Roasters is an upscale coffee chain with locations in the western United States of America. The past few years have resulted in stagnant growth at the coffee chain, and a new management team was put in place to reignite growth at their stores.
The first major growth initiative is to introduce gourmet sandwiches to the menu, along with limited wine offerings. The new management team believes that a television advertising campaign is crucial to drive people into the stores with these new offerings.
However, the television campaign will require a significant boost in the company’s marketing budget, with an unknown return on investment (ROI). Additionally, there is concern that current customers will not buy into the new menu offerings.
To minimize risk, the management team decides to test the changes in two cities with new television advertising. Denver and Chicago cities were chosen to participate in this test because the stores in these two cities (or markets) perform similarly to all stores across the entire chain of stores; performance in these two markets would be a good proxy to predict how well the updated menu performs.
The test ran for a period of 12 weeks (2016-April-29 to 2016-July-21) where five stores in each of the test markets offered the updated menu along with television advertising.
The comparative period is the test period, but for last year (2015-April-29 to 2015-July-21).
You’ve been asked to analyze the results of the experiment to determine whether the menu changes should be applied to all stores. The predicted impact to profitability should be enough to justify the increased marketing budget: at least 18% increase in profit growth compared to the comparative period while compared to the control stores; otherwise known as incremental lift. In the data, profit is represented in the gross_margin variable.
You have been able to gather three data files to use for your analysis:
- Transaction data for all stores from 2015-January-21 to 2016-August-18
- A listing of all Round Roasters stores
- A listing of the 10 stores (5 in each market) that were used as test markets.
Step 1: Plan Your Analysis
To perform the correct analysis, you will need to prepare a data set. Prior to rolling up your sleeves and preparing the data, it’s a good idea to have a plan of what you need to do in order to prepare the correct data set. A good plan will help you with your analysis. Here are a few questions to get you started:
- What is the performance metric you’ll use to evaluate the results of your test?
- What is the test period?
- At what level (day, week, month, etc.) should the data be aggregated?
Step 2: Clean Up Your Data
In this step, you should prepare the data for steps 3 and 4. You should aggregate the transaction data to the appropriate level and filter on the appropriate data ranges. You can assume that there is no missing, incomplete, duplicate, or dirty data. You’re ready to move on to the next step when you have weekly transaction data for all stores.
Step 3: Match Treatment and Control Units
In this step, you should create the trend and seasonality variables, and use them along with you other control variable(s) to match two control units to each treatment unit. Treatment stores should be matched to control stores in the same region. Note: Calculate the number of transactions per store per week and use 12 periods to calculate trend and seasonality.
Apart from trend and seasonality...
- What control variables should be considered? Note: Only consider variables in the RoundRoastersStore file.
- What is the correlation between your each potential control variable and your performance metric? (Example of correlation matrix below)
- What control variables will you use to match treatment and control stores?
Step 4: Analysis and Writeup
Conduct your A/B analysis and create a short report outlining your results and recommendations.
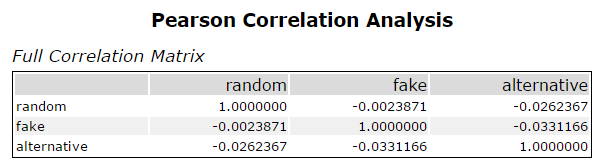
In an AB Analysis we use the correlation matrix to find the most correlated variable to the performance metric to include in the AB controls tool to help find the best matches.
To complete this project, you will be submitting a file in pdf format that contains the answers to the following questions.
All the results are in the Report.pdf File.
Must give credit to Udacity to providing this data. You can find the Licensing for the data and other descriptive information at Udacity Page.