The DanbooRegion 2020 Dataset

DanbooRegion is a project conducted by ToS2P (the Team of Style2Paints), aiming at finding a solution to extract regions from illustrations and cartoon images, so that many region-based image processing algrithoms can be applied to in-the-wild illustration and digital paintings. The main uniqueness of this project is that our dataset is created by real artists in a semi-automatic manner.
This project begins at 2019 Jan and a techinical paper, namely "DanbooRegion: An Illustration Region Dataset", is accepted to the European Conference on Computer Vision (ECCV) 2020.
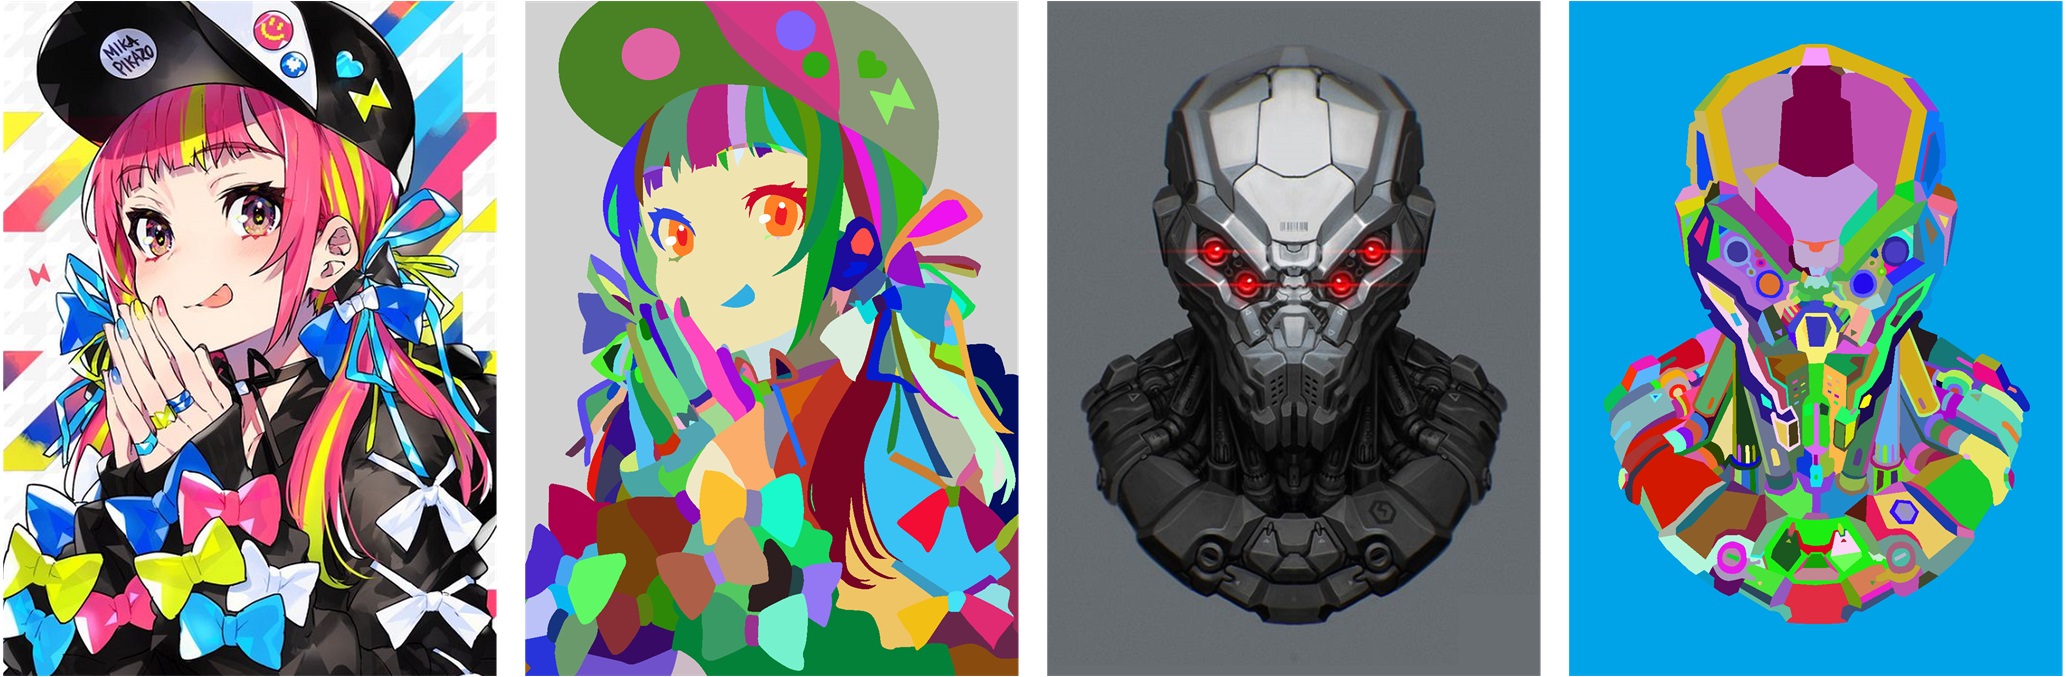
- Some example illustration and the corresponding region annotations.
[Project Page] [Paper] [Zhihu]
Table of Contents
In this page, we provide the following contents:
0. Preparation.
1. Downloding the region annotation dataset.
2. Converting regions to learnable skeleton maps.
3. Converting the entire dataset to learnable skeleton maps.
4. Training a neural network to predict the skeleton maps.
5. Converting a skeleton map to regions.
6. Developing your own framework and train it on this dataset.
7. Benchmarking the performace of your model.
However, if you are busy dating your girlfriend, or in a great hurry to write a paper, you can skip the 01234567 above and directly jump to the 89 below.
8. Downloding the pre-trained model.
9. Testing the pre-trained model with an image.
We also provide some additional playful contents.
10. Playing with some applications.
0. Preparation.
Whether you want to download the dataset or the pretrained model, you will need a Python 3.6 environment with appropriate CUDA installed, and then clone the repo:
git clone https://github.com/lllyasviel/DanbooRegion.git
and then install the pip environments via
pip install tensorflow_gpu==1.5.0
pip install keras==2.2.4
pip install opencv-python==3.4.2
pip install numpy==1.15.4
pip install numba==0.39.0
pip install scipy==1.1.0
pip install scikit-image==0.13.0
pip install scikit-learn==0.22.2
Other versions may also works but the above versions are tested by myself.
1. Downloding the region annotation dataset.
You can download this dataset from
Google Drive:
https://drive.google.com/drive/folders/1ihLt6P7UQRlaFtZUEclXkWC9grmEXEUK?usp=sharing
or if you do not have access to google
Baidu Drive (百度网盘):
https://pan.baidu.com/s/12qGzKat48n8PyMeaYJPgOA
提取码: ts2p
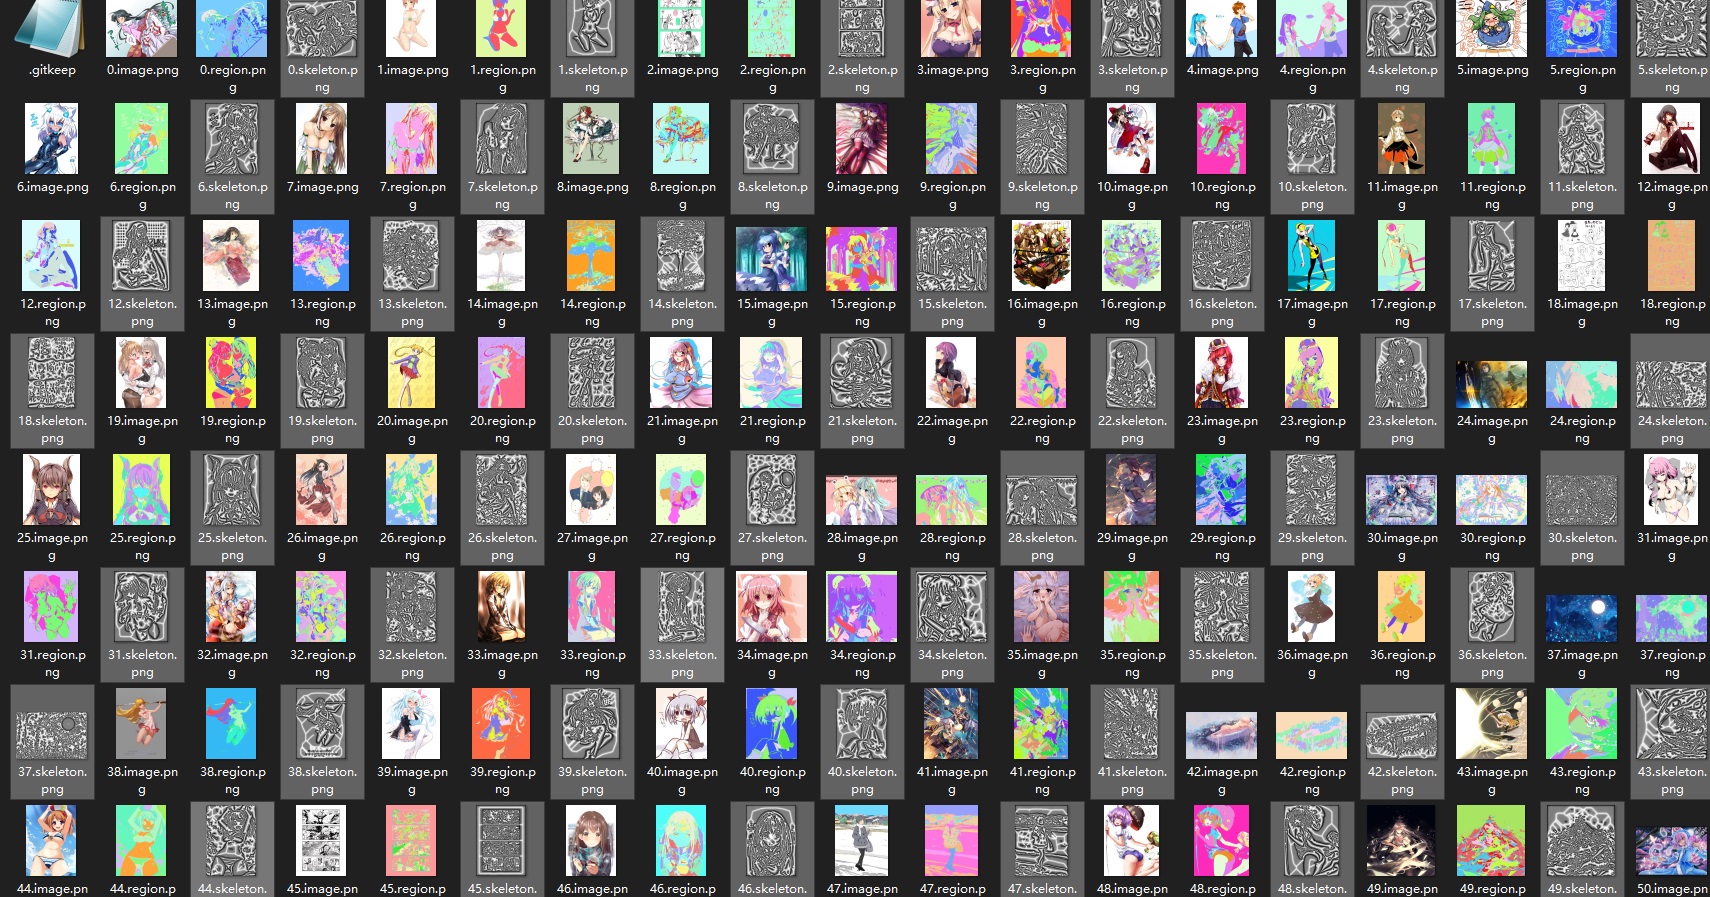
After the downloading and decompression, you may see images like this:
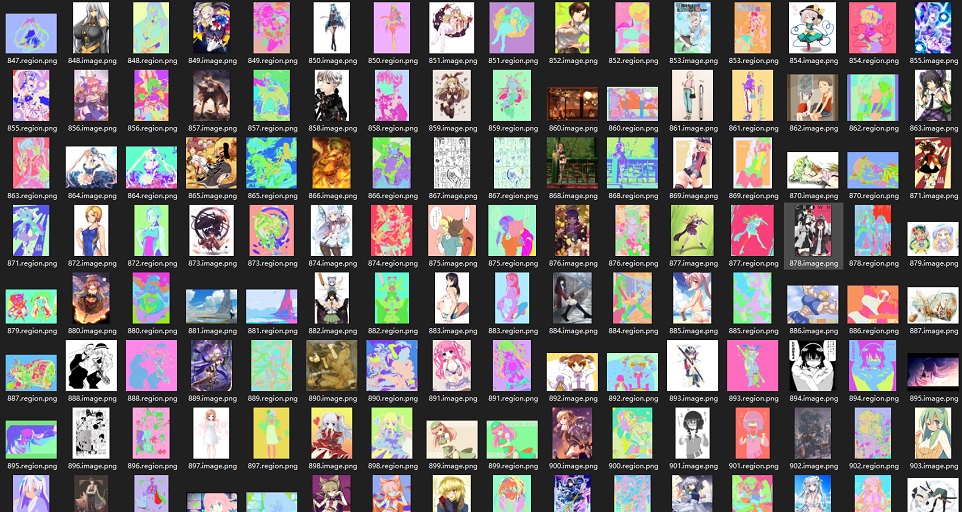
The file structure is
../code/DanbooRegion2020
../code/DanbooRegion2020/DanbooRegion2020UNet.net
../code/DanbooRegion2020/train
../code/DanbooRegion2020/train/X.image.png
../code/DanbooRegion2020/train/X.region.png
../code/DanbooRegion2020/val
../code/DanbooRegion2020/val/X.image.png
../code/DanbooRegion2020/val/X.region.png
../code/DanbooRegion2020/test
../code/DanbooRegion2020/test/X.image.png
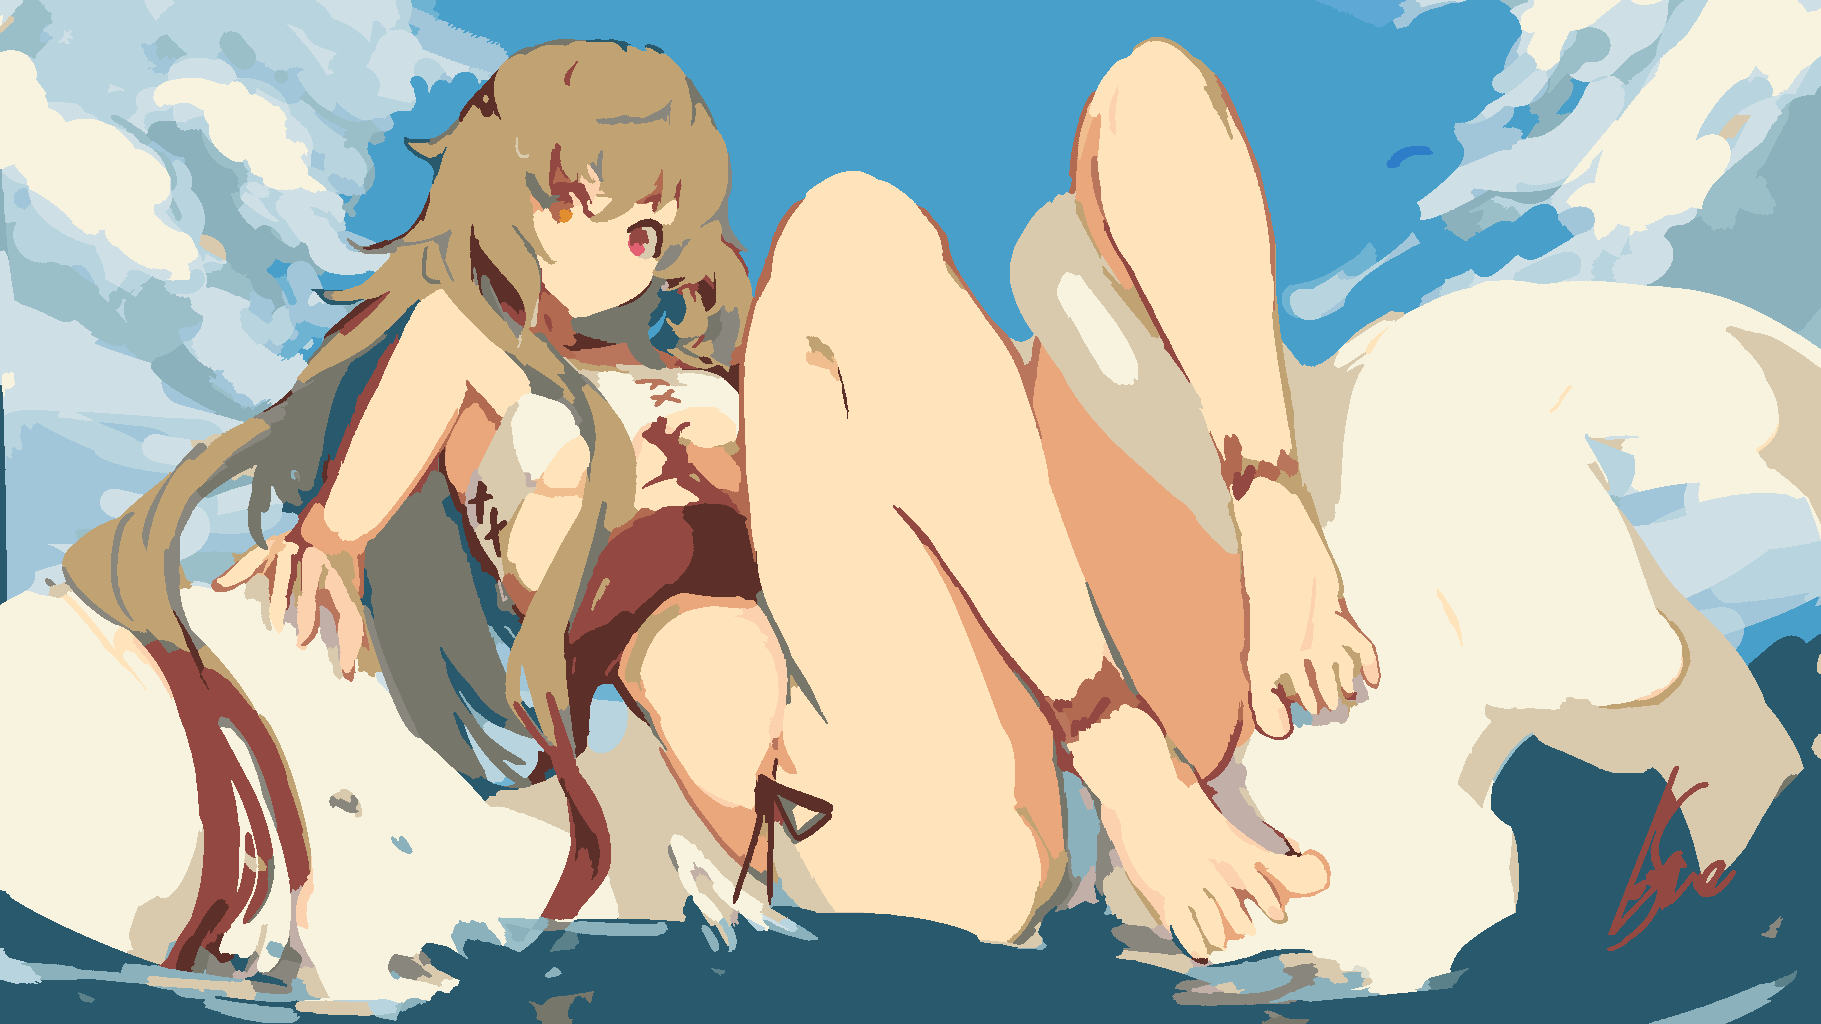
Below is an example of "X.image.png"
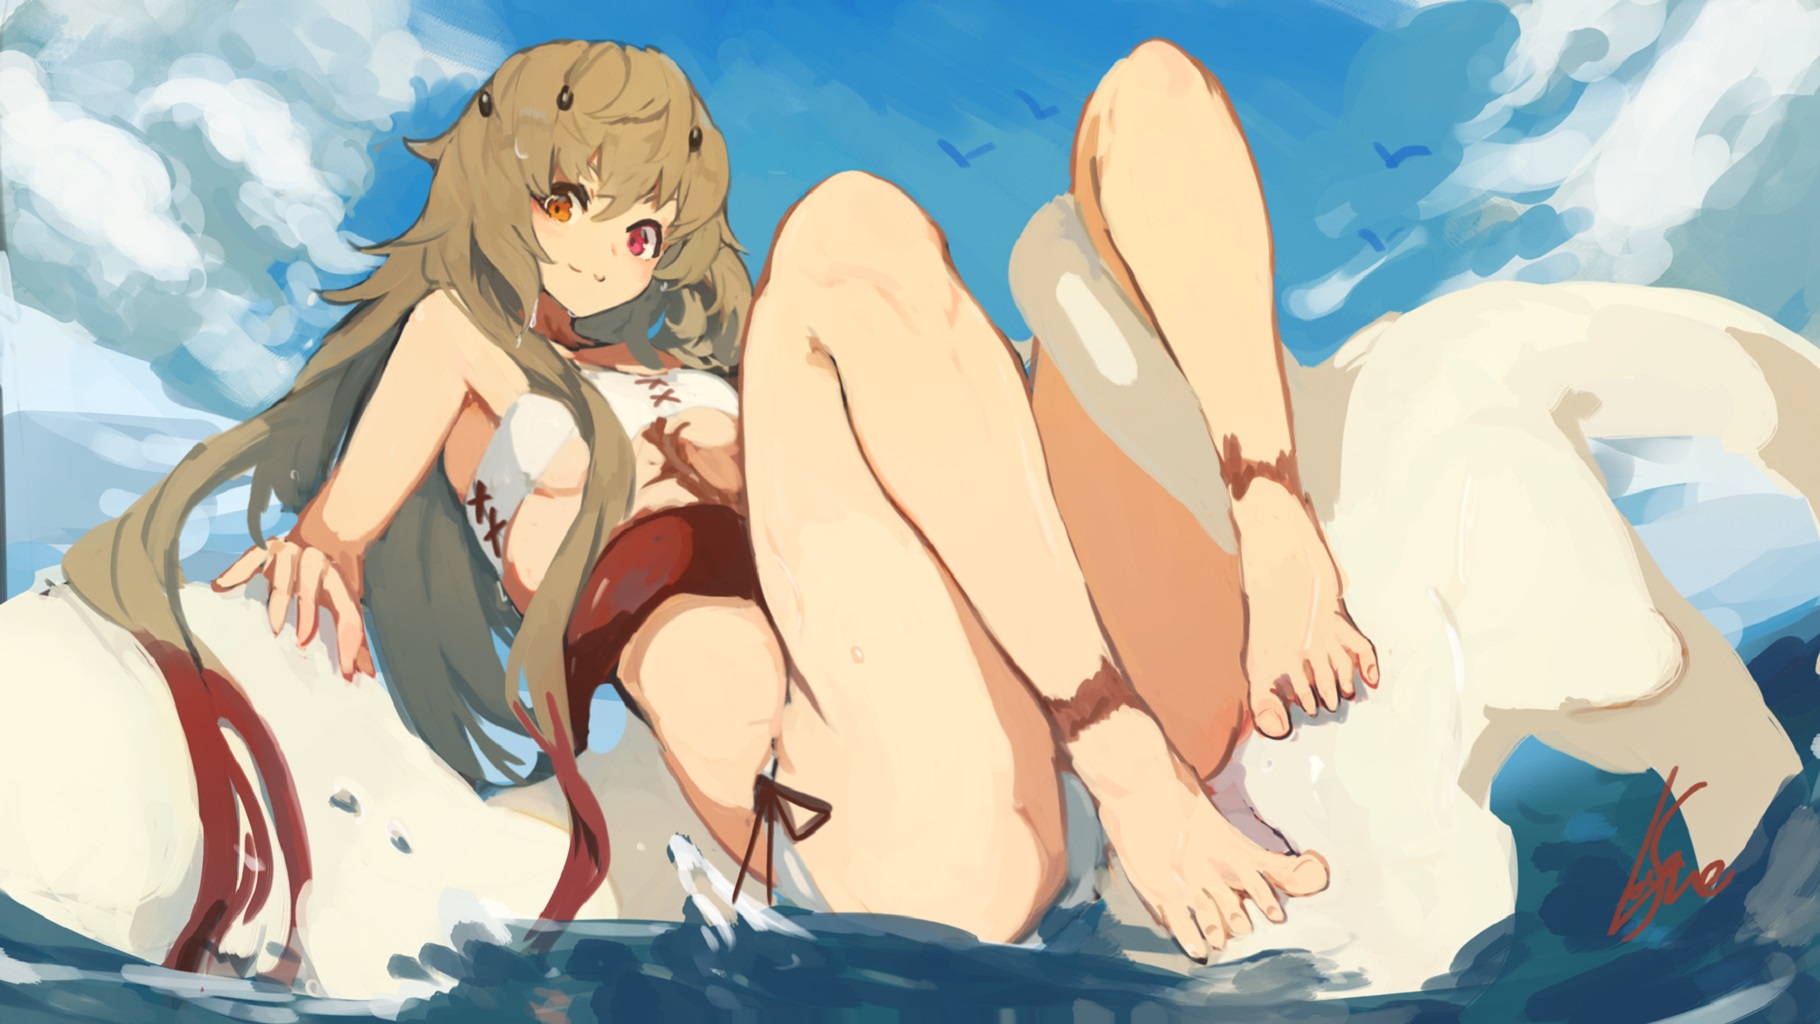
and the example of "X.region.png".
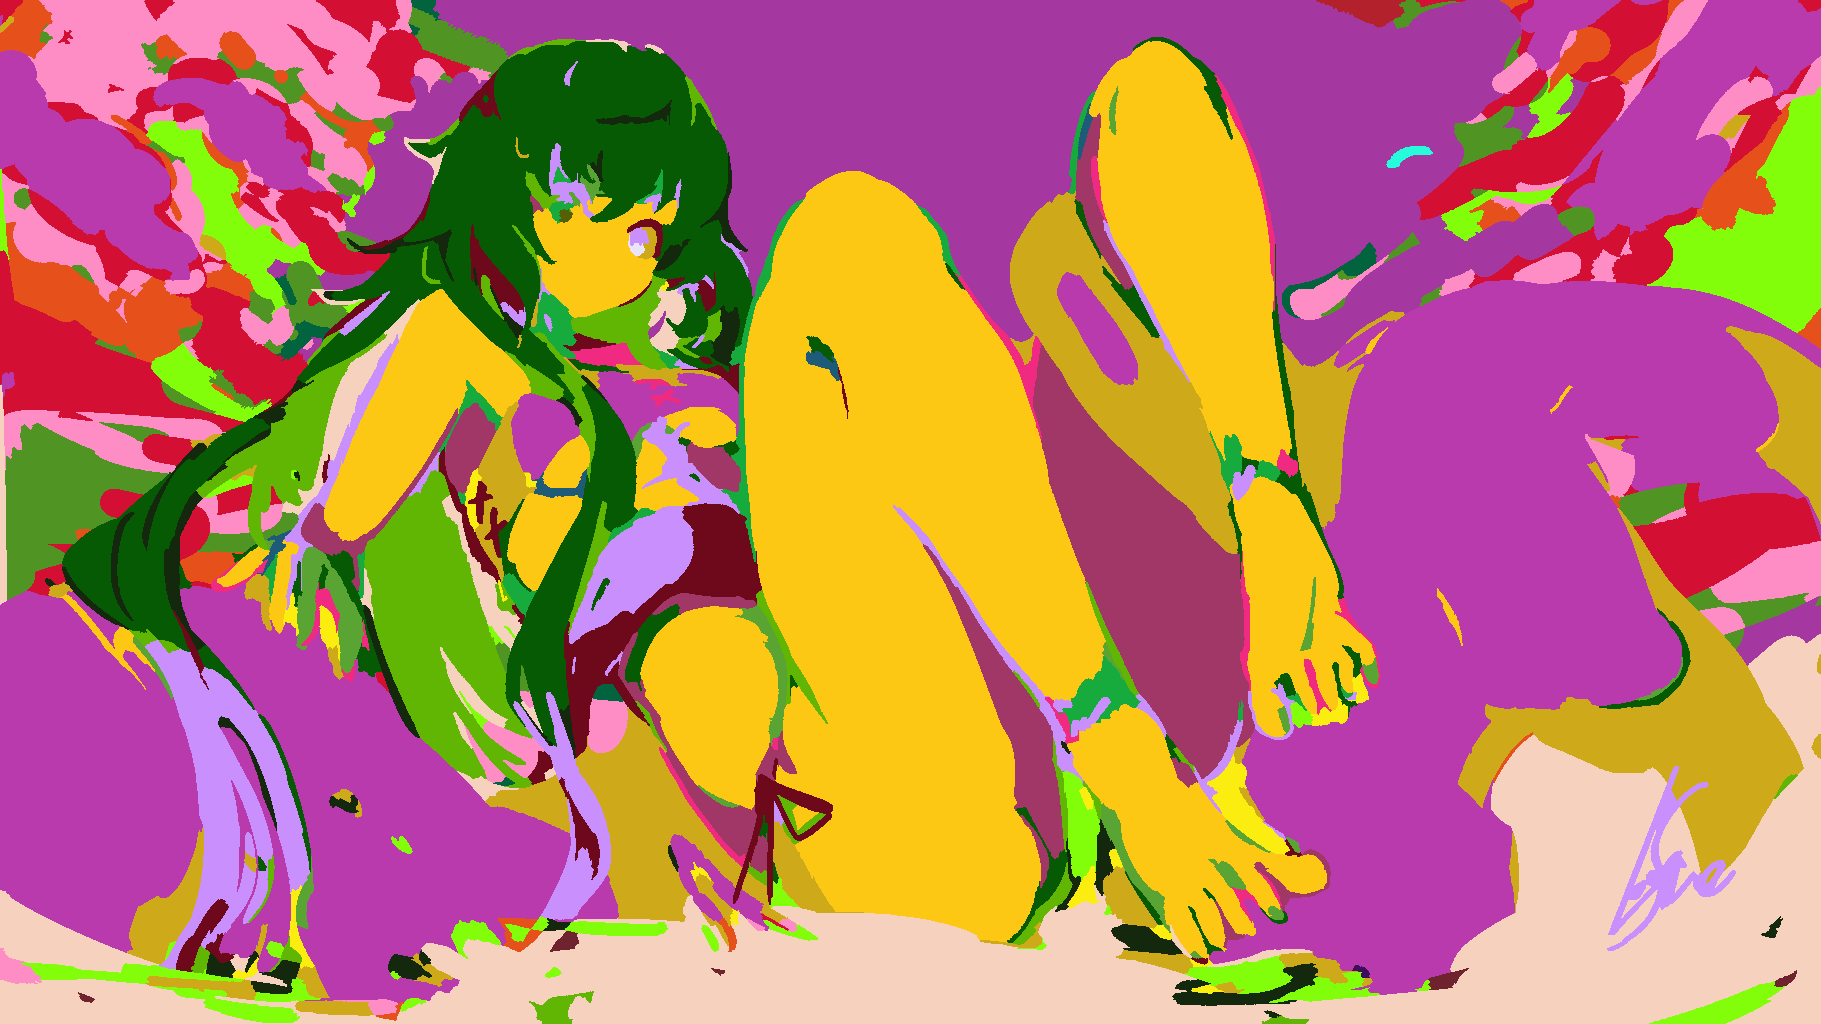
We also provide a script for you to visualize the regions by filling the original colors to all regions, you can use the script by:
cd ./code/
python visualize.py ./X.image.png ./X.region.png
and you will see the visualization like this:
Something about the dataset quality
In fact we have an user study to visualize the quality of this dataset.
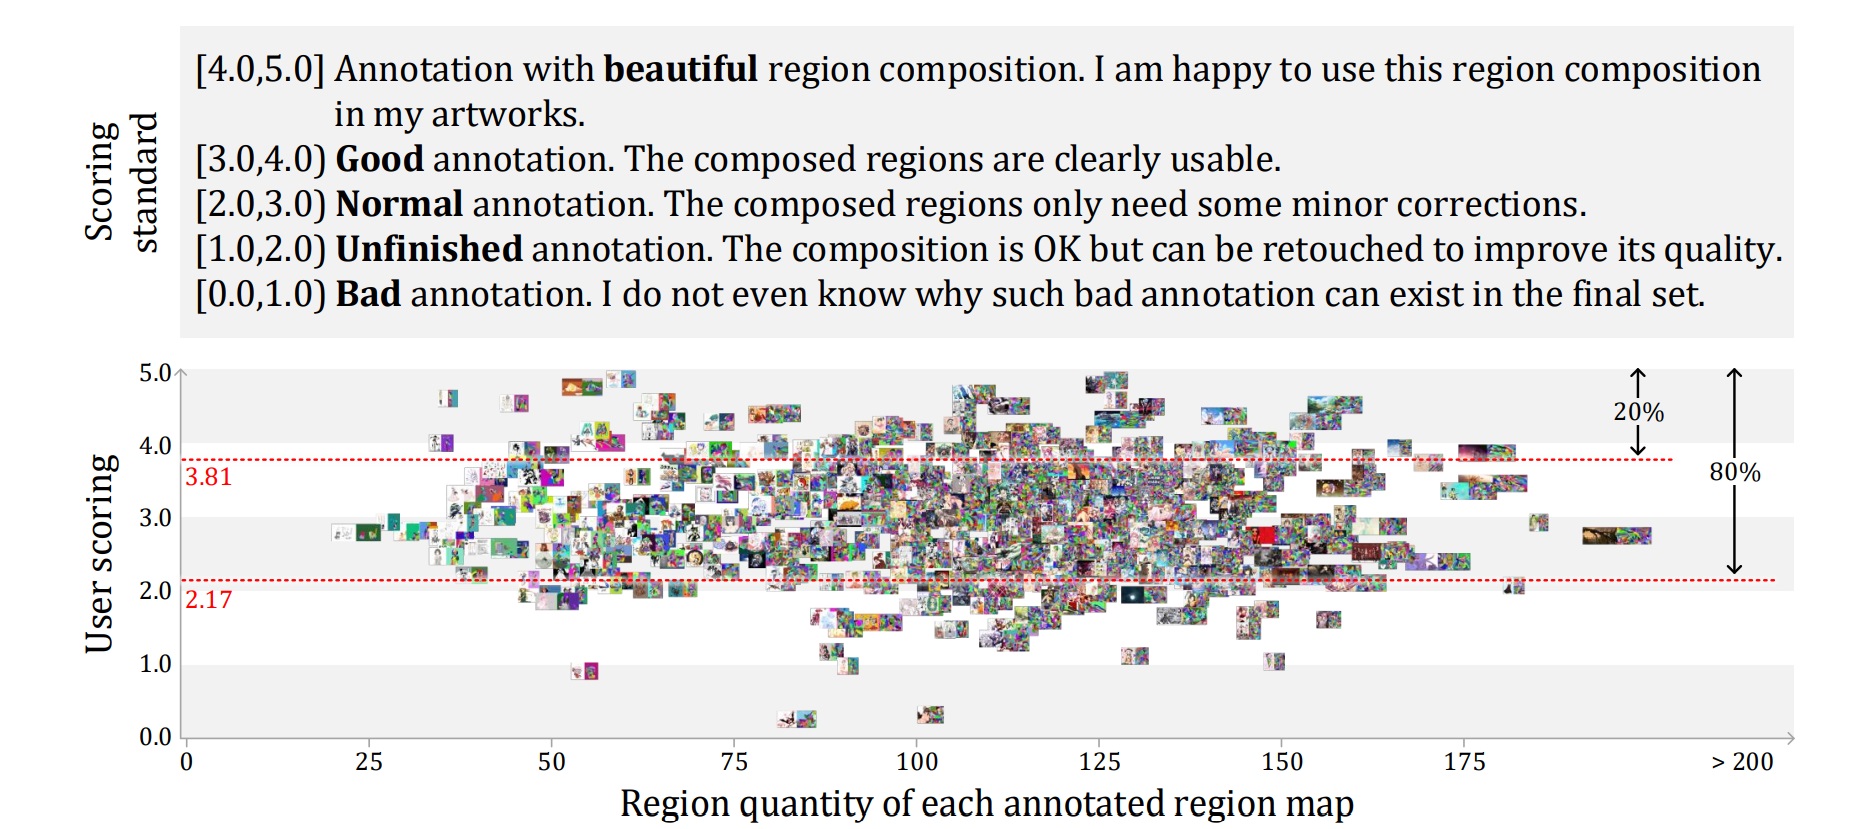
The x-axis is the quantity of regions in each region map, while the y-axis is the user scoring with the above scoring standard.
We can see that about 50% annotations only have normal (or below) quality and about 30% annotations are even unfinished. Besides, 70% annotations still need corrections. Only about 20% annotations look good or beautiful. This is because annotating these regions is very difficult and time-consuming. Thanks a lot to all 12 artists involved in this data annotating projects! The involved artists are:
Some artists do not want to be named and got mosaics.
Although the quality of this dataset is not perfect, we can still do lots of things that are very useful for cartoon image processing applications.
We are continuously improving the quality of this dataset. If you check back in a few months, the quality of the dataset may have improved many times.
2. Converting regions to learnable skeleton maps.
Firstly, let's say you have an image like this:

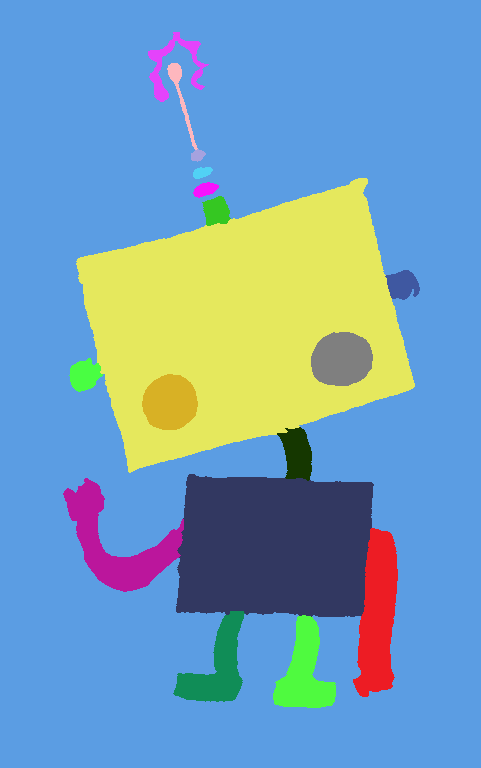
Then, you have asked some users or artists to annotate the image and get the region map like this:

The problem is that how we can train neural networks to predict the region maps? It is obvious that we cannot train a pix2pix to predict the region map because the colors in the region maps are random, and L1 loss is meaningless. Therefore, we will need some additional steps.
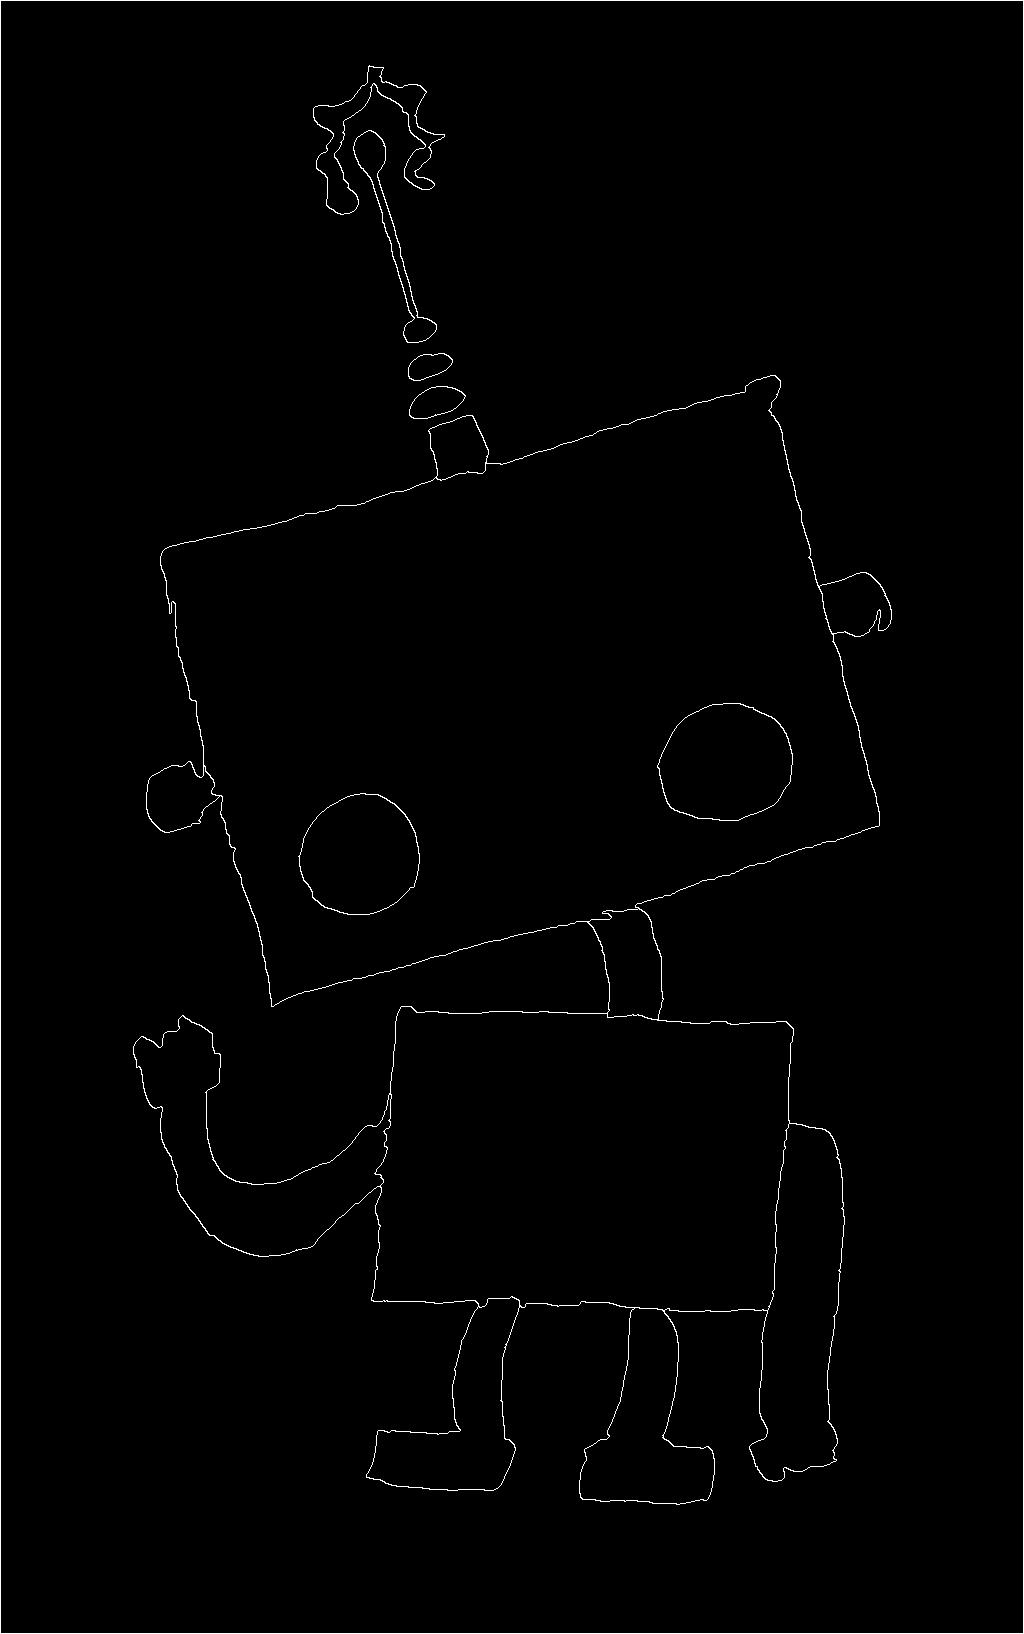
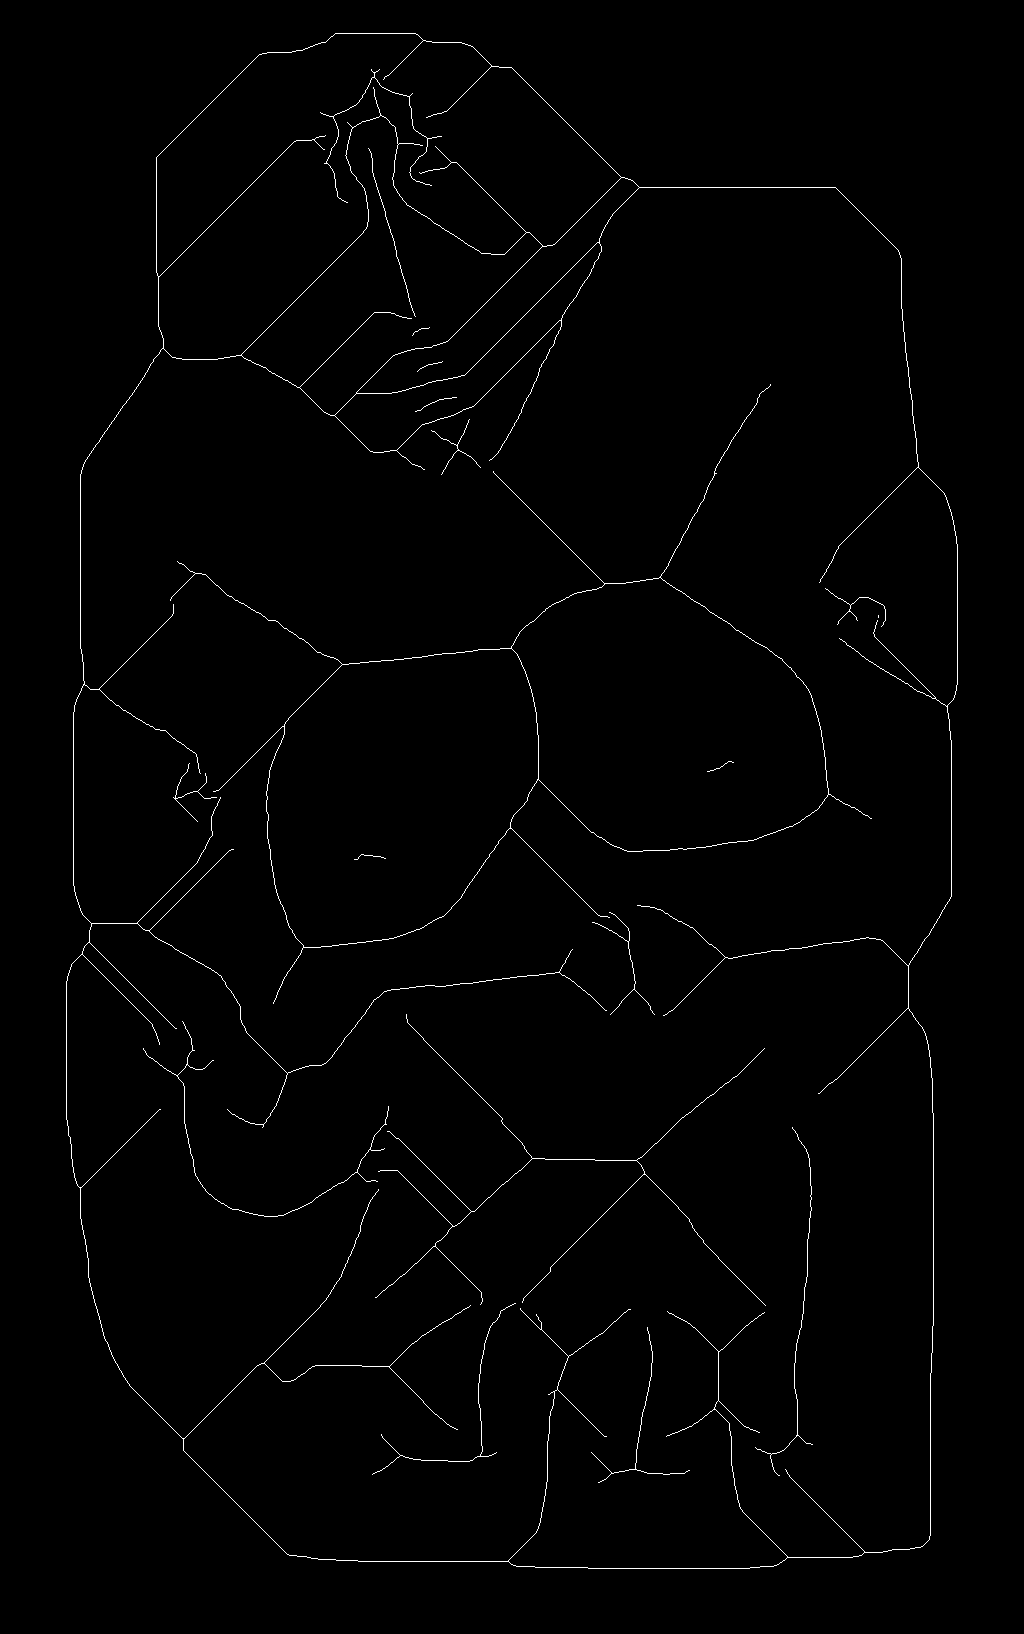
We first detect the edge of all regions using OpenCV and get this edge map:
After that, we use the skeletonize function to extract the region skeletons. The function can be found at
from skimage.morphology import thin as skeletonize
and the result is like this:
After that, we randomly initialize an image with skeletons and edges like this:
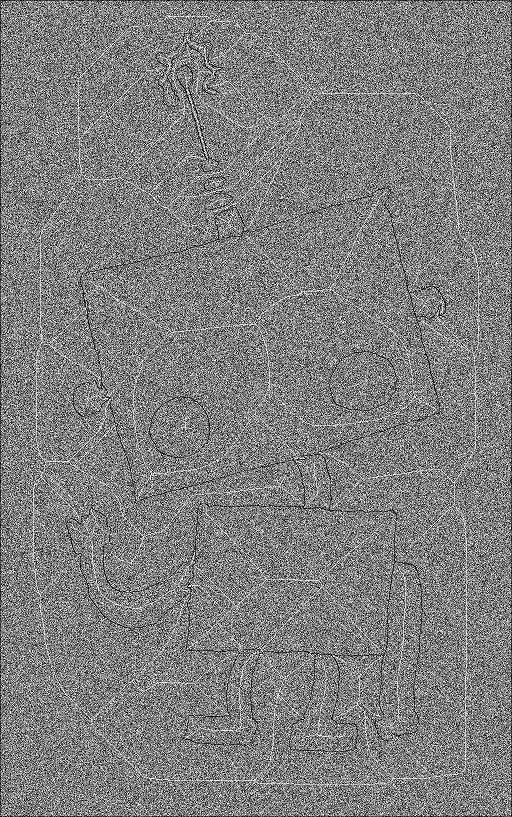
Then, we smooth the above image to get the final skeleton map like this:
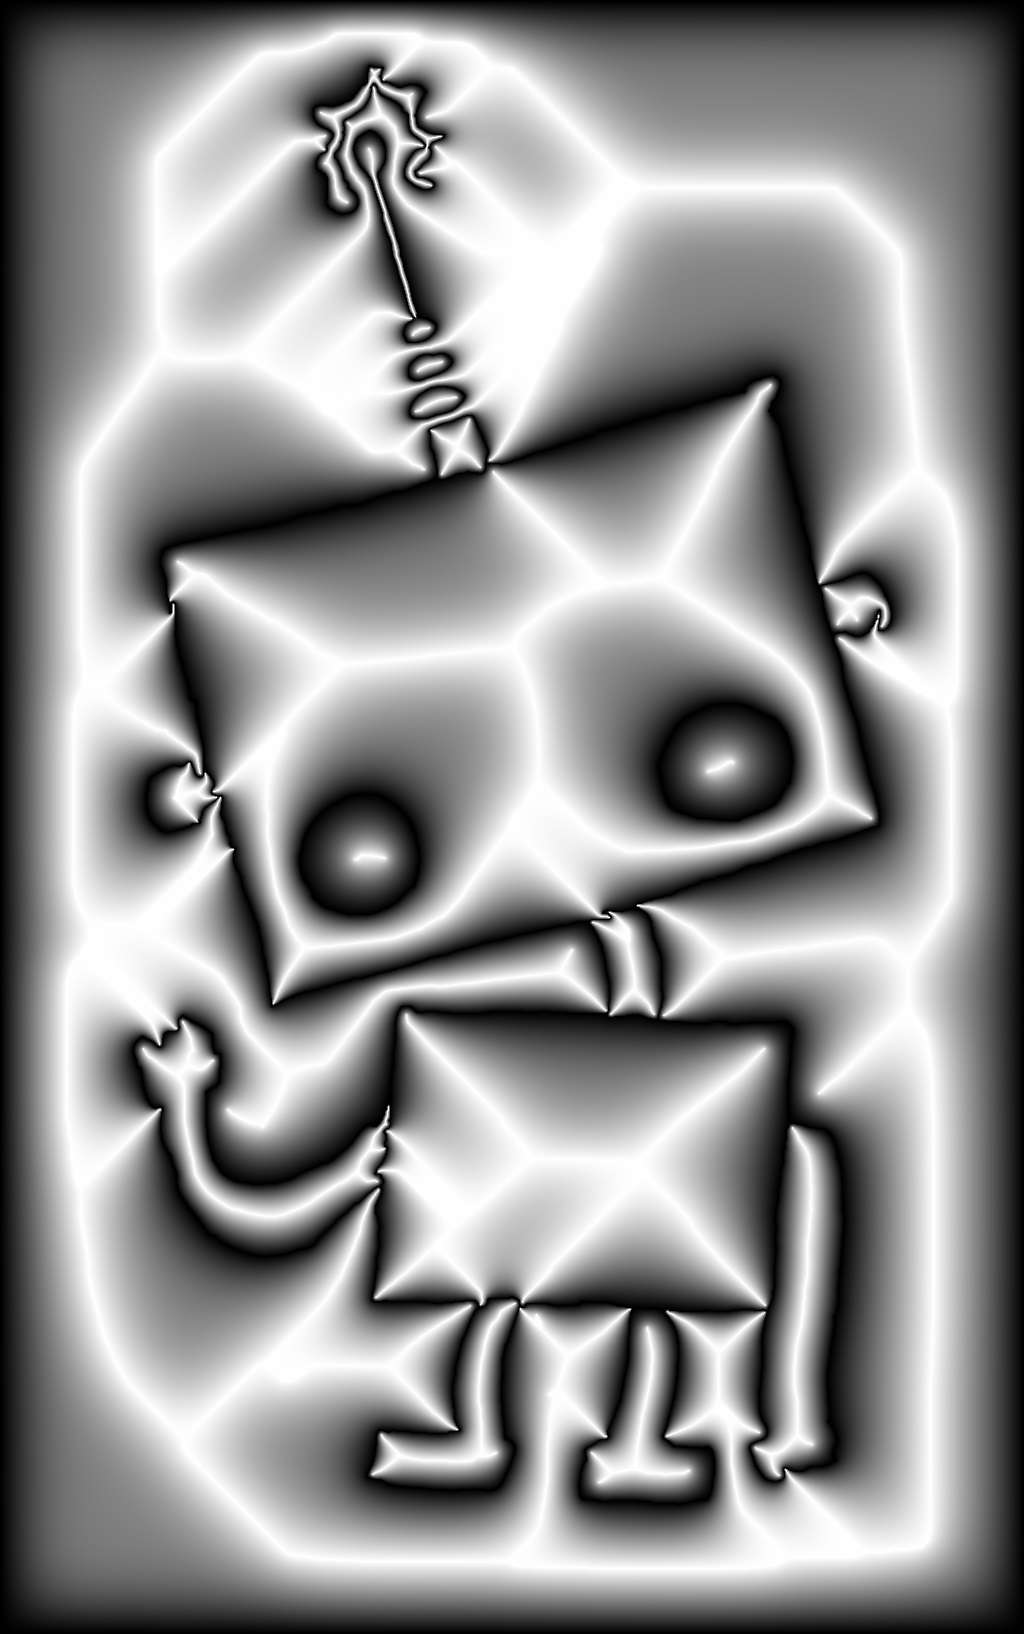
Note that this skeleton map is learnable and you can use anything to learn it. For example, you can train pix2pix or pix2pixHD to predict the skeleton map.
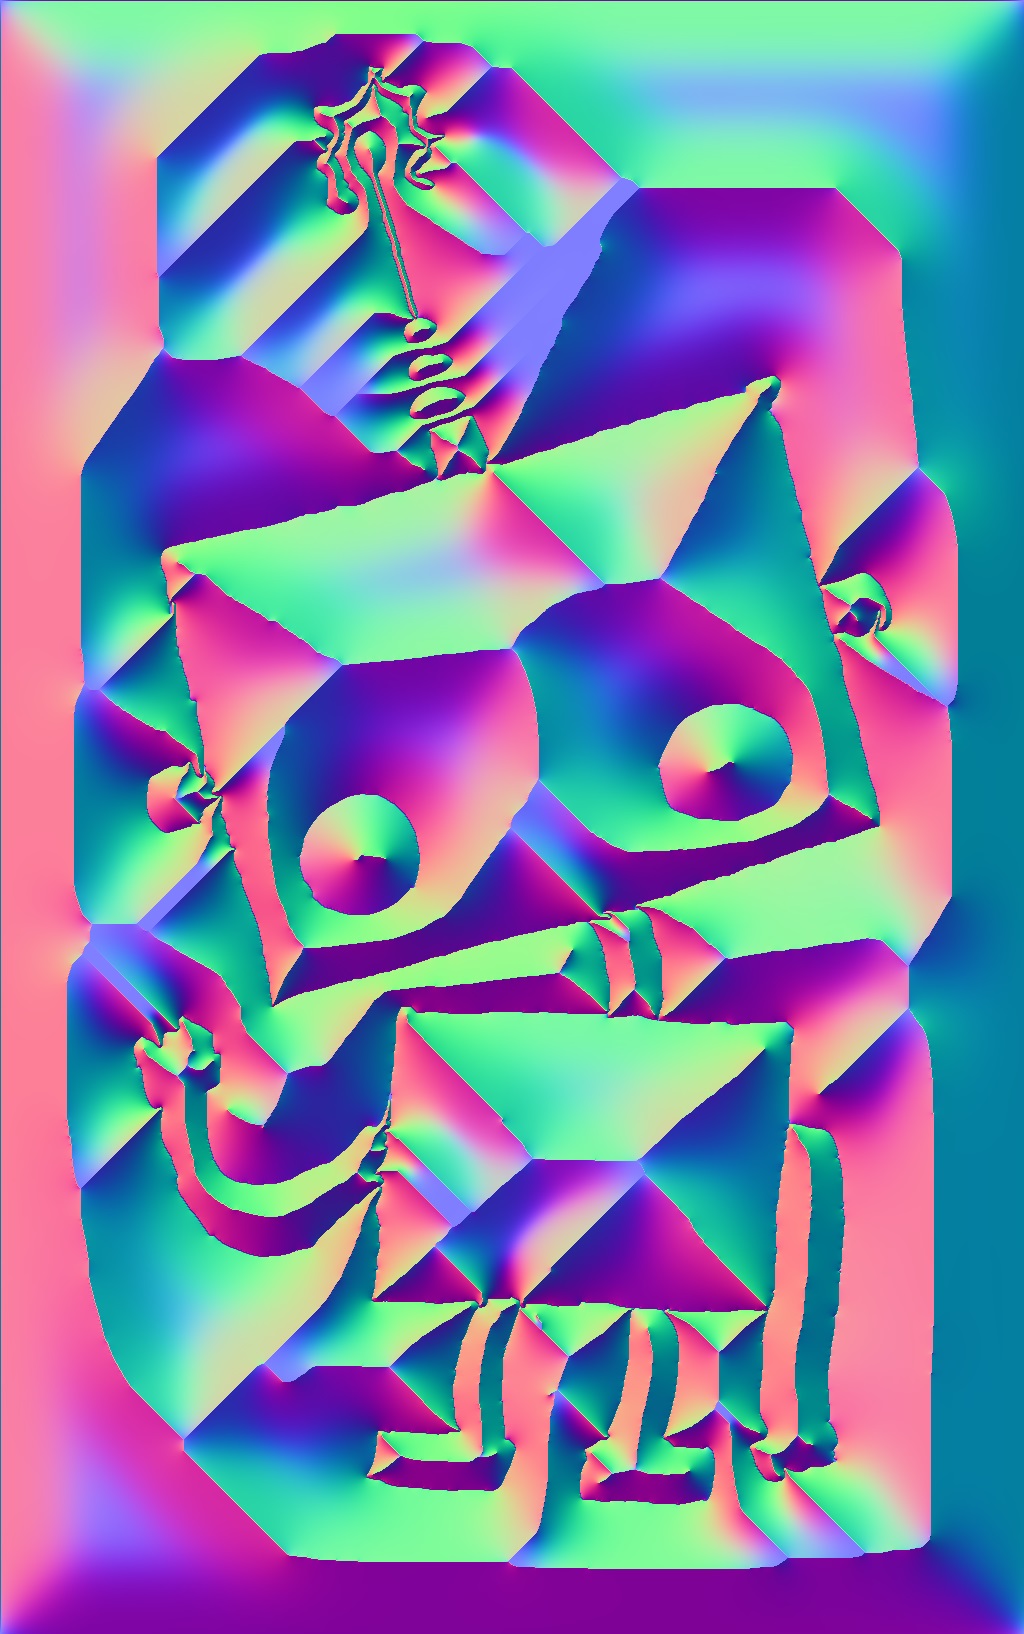
Also, the skeleton map can be translated to normal maps like this:
Or you can thresold the skeleton map to get some watershed markers like this:
Note that we provide full codes for you to do all the above things! Just run
cd ./code/
python skeletonize.py ./region_test.png
Have fun with the codes.
3. Converting the entire dataset to learnable skeleton maps.
Using the above transform, you can translate the full training data into skeleton maps. Just run
cd ./code/
python skeletonize_all.py
This will automatically generate all training region skeletons, and the logs are like this:
Writing   ./DanbooRegion2020/train/0.skeleton.png   1/3377
Writing   ./DanbooRegion2020/train/1.skeleton.png   2/3377
Writing   ./DanbooRegion2020/train/2.skeleton.png   3/3377
Writing   ./DanbooRegion2020/train/3.skeleton.png   4/3377
Writing   ./DanbooRegion2020/train/4.skeleton.png   5/3377
Writing   ./DanbooRegion2020/train/5.skeleton.png   6/3377
...
Writing   ./DanbooRegion2020/train/3376.skeleton.png   3377/3377
Before running this script, the file structures are
../code/DanbooRegion2020
../code/DanbooRegion2020/train
../code/DanbooRegion2020/train/X.image.png
../code/DanbooRegion2020/train/X.region.png
After this script, the file structures become
../code/DanbooRegion2020
../code/DanbooRegion2020/train
../code/DanbooRegion2020/train/X.image.png
../code/DanbooRegion2020/train/X.region.png
../code/DanbooRegion2020/train/X.skeleton.png
And this is a screenshot after all skeletons are generated:
Note that the selected files in the above screenshot are the generated skeleton maps. Now you have prepared everything.
4. Training a neural network to predict the skeleton maps.
Before training the model, make sure that you have followed the instructions in 3. Converting the entire dataset to learnable skeleton maps.
We provide full codes for you to train a model on this dataset:
cd ./code/
python train.py
We note that:
- If you run this script in the first time, it will generate a new model and train it directly.
- During training, the model will be saved in each 200 iterations.
- If you run this script when a saved model is avaliable, it will read the previous model and continue training.
- If you do not want to continue the training, please delete the "saved_model.net" and "saved_discriminator.net" file.
- This code will train a U-net with adversarial and perceptural L1 loss, which has similar performance with pix2pixHD.
- The script uses many data augmentation methods. Please see the code for details.
- The training is not very expensive. You may even train it on a laptop with GTX980M.
During the training, the script will save the neural network estimated skeleton maps for each 10 iterations. The saved estimations are in the path:
../code/results
../code/results/0.jpg
../code/results/1.jpg
../code/results/2.jpg
...
The entire training will take 50000 iterations.
On my very old laptop (GTX980M+I7CPU), the successful logs are
Using TensorFlow backend.
2020-07-19 20:44:39.820506: I C:\tf_jenkins\home\workspace\rel-win\M\windows-gpu\PY\36\tensorflow\core\platform\cpu_feature_guard.cc:137] Your CPU supports instructions that this TensorFlow binary was not compiled to use: AVX AVX2
2020-07-19 20:44:40.423216: I C:\tf_jenkins\home\workspace\rel-win\M\windows-gpu\PY\36\tensorflow\core\common_runtime\gpu\gpu_device.cc:1030] Found device 0 with properties:
name: GeForce GTX 980M major: 5 minor: 2 memoryClockRate(GHz): 1.1265
pciBusID: 0000:01:00.0
totalMemory: 8.00GiB freeMemory: 6.71GiB
2020-07-19 20:44:40.423930: I C:\tf_jenkins\home\workspace\rel-win\M\windows-gpu\PY\36\tensorflow\core\common_runtime\gpu\gpu_device.cc:1120] Creating TensorFlow device (/device:GPU:0) -> (device: 0, name: GeForce GTX 980M, pci bus id: 0000:01:00.0, compute capability: 5.2)
saved_model.net--created
saved_discriminator.net--created
0/50000 Currently 13.778525352478027 second for each iteration.
1/50000 Currently 2.0006484985351562 second for each iteration.
2/50000 Currently 1.6455974578857422 second for each iteration.
3/50000 Currently 1.8700015544891357 second for each iteration.
4/50000 Currently 1.8167574405670166 second for each iteration.
5/50000 Currently 1.5877196788787842 second for each iteration.
6/50000 Currently 1.6236474514007568 second for each iteration.
7/50000 Currently 1.7862193584442139 second for each iteration.
If you have better GPU than me, your speed should be much faster.
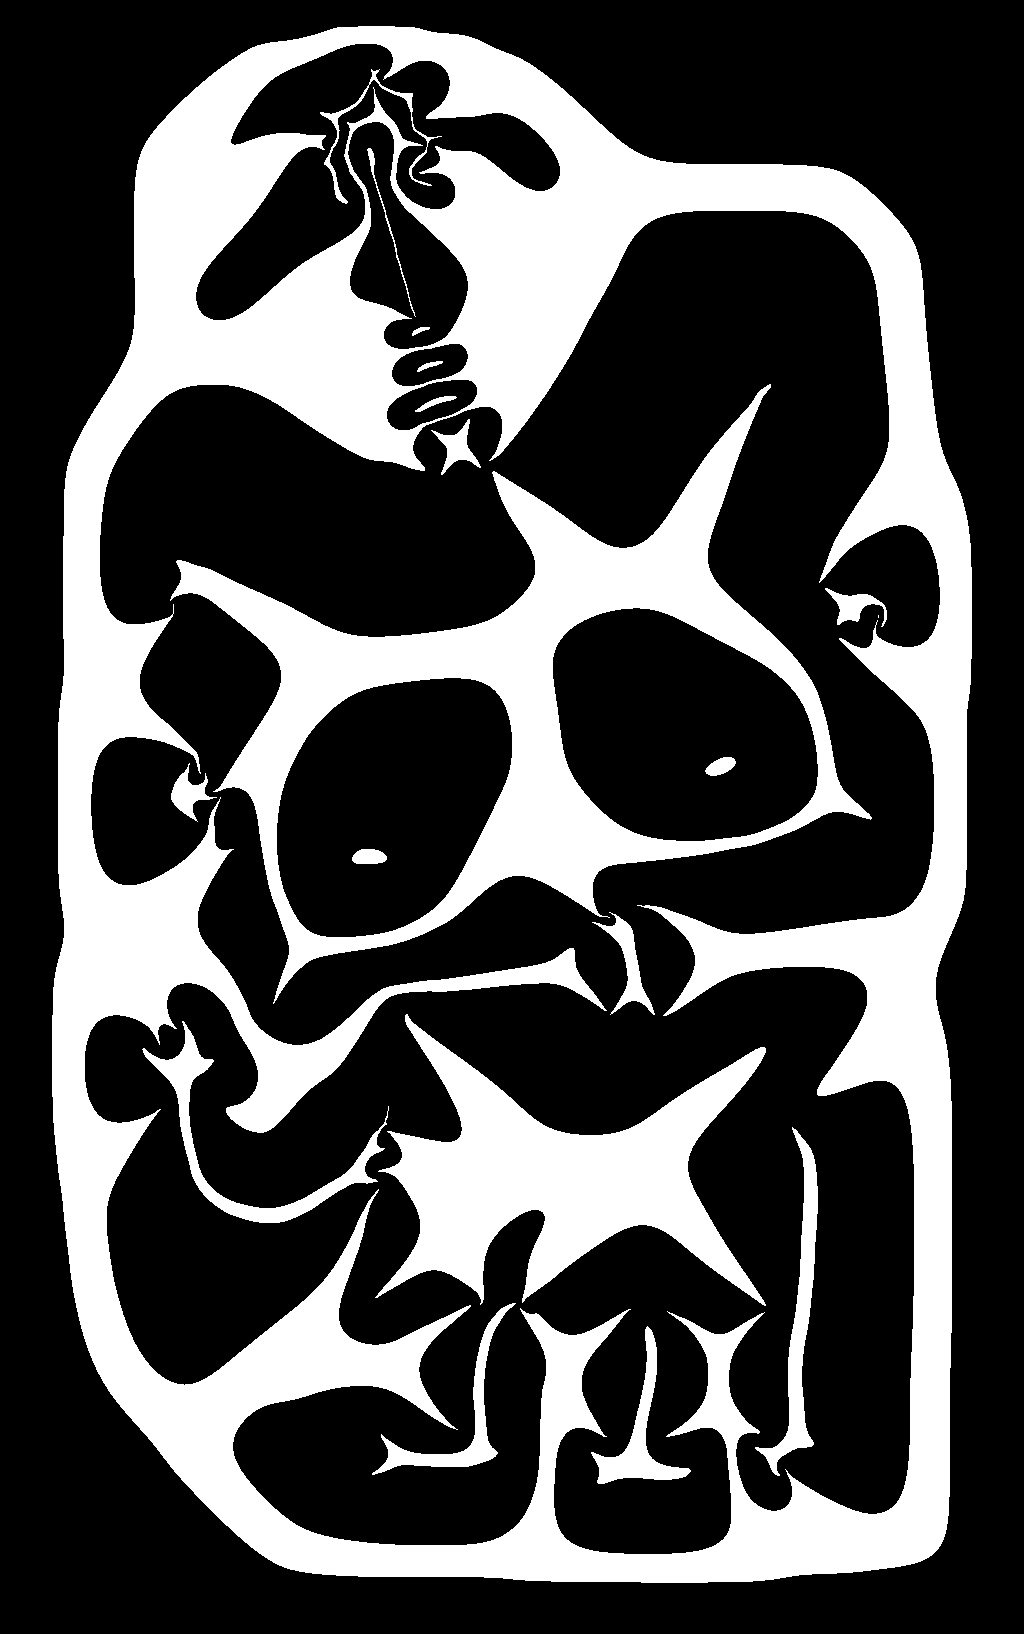
5. Converting a skeleton map to regions.
Given the skeleton map like this:
We can translate them to regions using the function of cv2.watershed as
watershed(image, markers) -> markers
.   @brief Performs a marker-based image segmentation using the watershed algorithm.
.
.   The function implements one of the variants of watershed, non-parametric marker-based segmentation
.   algorithm, described in @cite Meyer92 .
.
.   Before passing the image to the function, you have to roughly outline the desired regions in the
.   image markers with positive (\>0) indices. So, every region is represented as one or more connected
.   components with the pixel values 1, 2, 3, and so on. Such markers can be retrieved from a binary
.   mask using #findContours and #drawContours (see the watershed.cpp demo). The markers are "seeds" of
.   the future image regions. All the other pixels in markers , whose relation to the outlined regions
.   is not known and should be defined by the algorithm, should be set to 0's. In the function output,
.   each pixel in markers is set to a value of the "seed" components or to -1 at boundaries between the
.   regions.
.
.   @note Any two neighbor connected components are not necessarily separated by a watershed boundary
.   (-1's pixels); for example, they can touch each other in the initial marker image passed to the
.   function.
.
.   @param image Input 8-bit 3-channel image.
.   @param markers Input/output 32-bit single-channel image (map) of markers. It should have the same
.   size as image .
.
.   @sa findContours
.
.   @ingroup imgproc_misc
We provide the code to the skeleton map to regions:
cd ./code/
python skeleton2regions.py ./skeleton_test.png
And you may have an output like this:
(The colors are random but your regions should be same.)
6. Developing your own framework and train it on this dataset.
You can use this dataset to train any kind of neural networks.
We highly recommend you to use our dataset.py to load the dataset as it is very flexiable and easy to use. It will automatically sample training images randomly, crop them to 512×512 randomly, and then augment them randomly with many advanced data augmentation methods. A very simple example is
from datasets import *

while True:
    training_output, training_input = handle_next()
    cv2.imshow('training_input', training_input)
    cv2.imshow('training_output', training_output)
    cv2.waitKey(0)
and you will see results like this
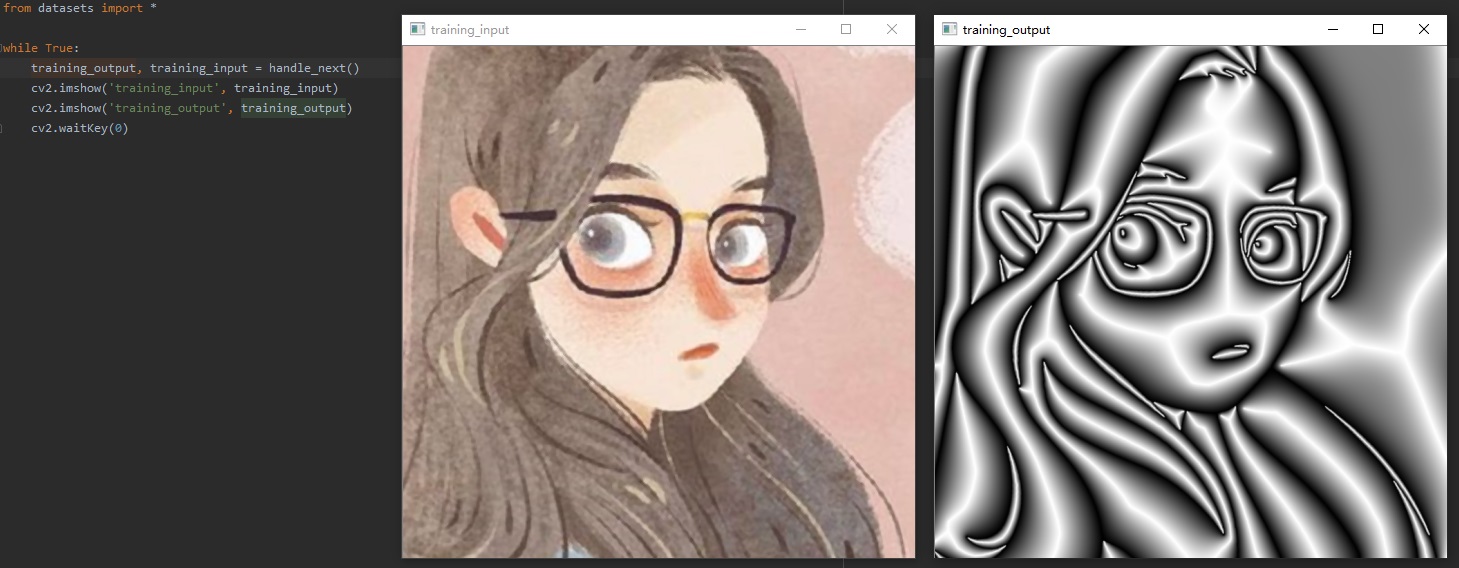
Isnt it very convenient? Use it now!
7. Benchmarking the performace of your model.
Whatever method you use, you may create a folder called "DanbooRegion2020/my_prediction" and put your estimated regions in it.
The file structure before your testing is:
../code/DanbooRegion2020
../code/DanbooRegion2020/train
../code/DanbooRegion2020/train/X.image.png
../code/DanbooRegion2020/train/X.region.png
../code/DanbooRegion2020/val
../code/DanbooRegion2020/val/X.image.png
../code/DanbooRegion2020/val/X.region.png
../code/DanbooRegion2020/test
../code/DanbooRegion2020/test/X.image.png
The file structure after your testing should be:
../code/DanbooRegion2020
../code/DanbooRegion2020/train
../code/DanbooRegion2020/train/X.image.png
../code/DanbooRegion2020/train/X.region.png
../code/DanbooRegion2020/val
../code/DanbooRegion2020/val/X.image.png
../code/DanbooRegion2020/val/X.region.png
../code/DanbooRegion2020/test
../code/DanbooRegion2020/test/X.image.png
../code/DanbooRegion2020/my_prediction
../code/DanbooRegion2020/my_prediction/X.region.png
The folder "test" and "my_prediction" should contain associated files. The "my_prediction/X.region.png" and the "test/X.image.png" should have same image shapes.
Then, zip your "DanbooRegion2020/my_prediction" folder and send your "my_prediction.zip" to lvminzhang@acm.org or lvminzhang@siggraph.org. I will test the performance of your method and add your score in the official benchmark. The title of your email should be "DanbooRegion2020 Test". Please give me the name of your method in your email. You are allowed to submit once a week. You can ask me to remove any of your score.
The current benchmark is:
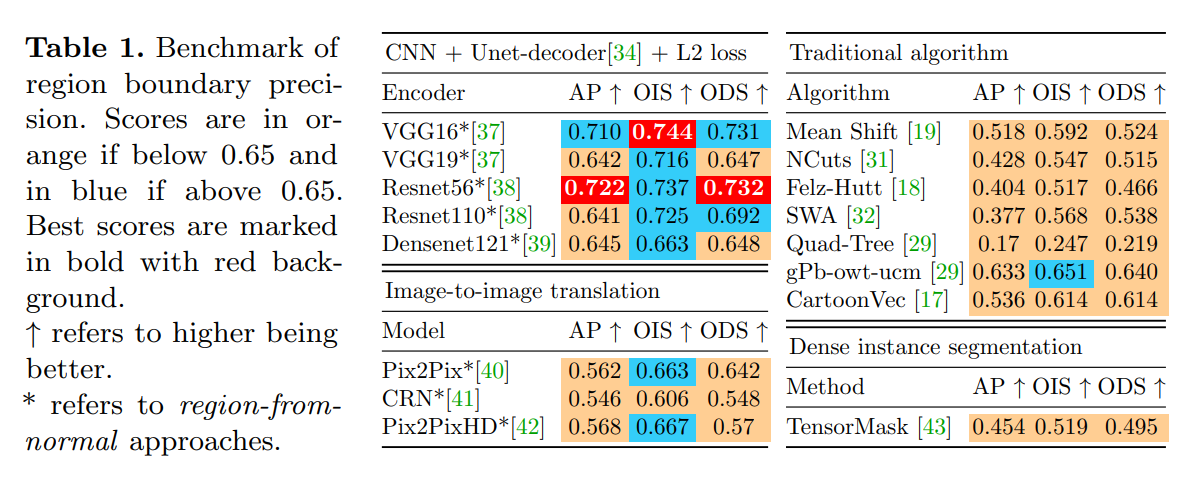
We use the metric of Average Precision (AP), Optimal Image Scale (OIS), and Optimal Dataset Scale (ODS). If you are not familiar with these standard region quality metrics, you may refer to
Berkeley Segmentation Data Set and Benchmarks 500 (BSDS500)
https://www2.eecs.berkeley.edu/Research/Projects/CS/vision/grouping/resources.html

Holistically-Nested Edge Detection
https://github.com/s9xie/hed
Both of these two famous works have very detailed description of the metrics of AP/OIS/ODS. If you want to play with these metrics on you own, you may refer to the instructions of
Richer Convolutional Features for Edge Detection
https://github.com/yun-liu/RCF
But the above link will ask you to install Matlab. If you do not have Matlab then maybe you can ignore it.
8. Downloding the pre-trained model.
We provide a very good pre-trained model for you to download it. This model is very good because I have trained many models and I have manually tested them one-by-one. Note that I not only tested numeric metrics but also checked and watched their results one-by-one using human eyes. This one is my favorite one and I share it here:
Google Drive:
(duplicated, see the UPDATE below.)
or if you do not have access to google
Baidu Drive (百度网盘):
(duplicated, see the UPDATE below.)
UPDATE: We have uploaded the model to the github repo. You now have this model when you clone this repo. You do not need to download again.
9. Testing the pre-trained model with an image.
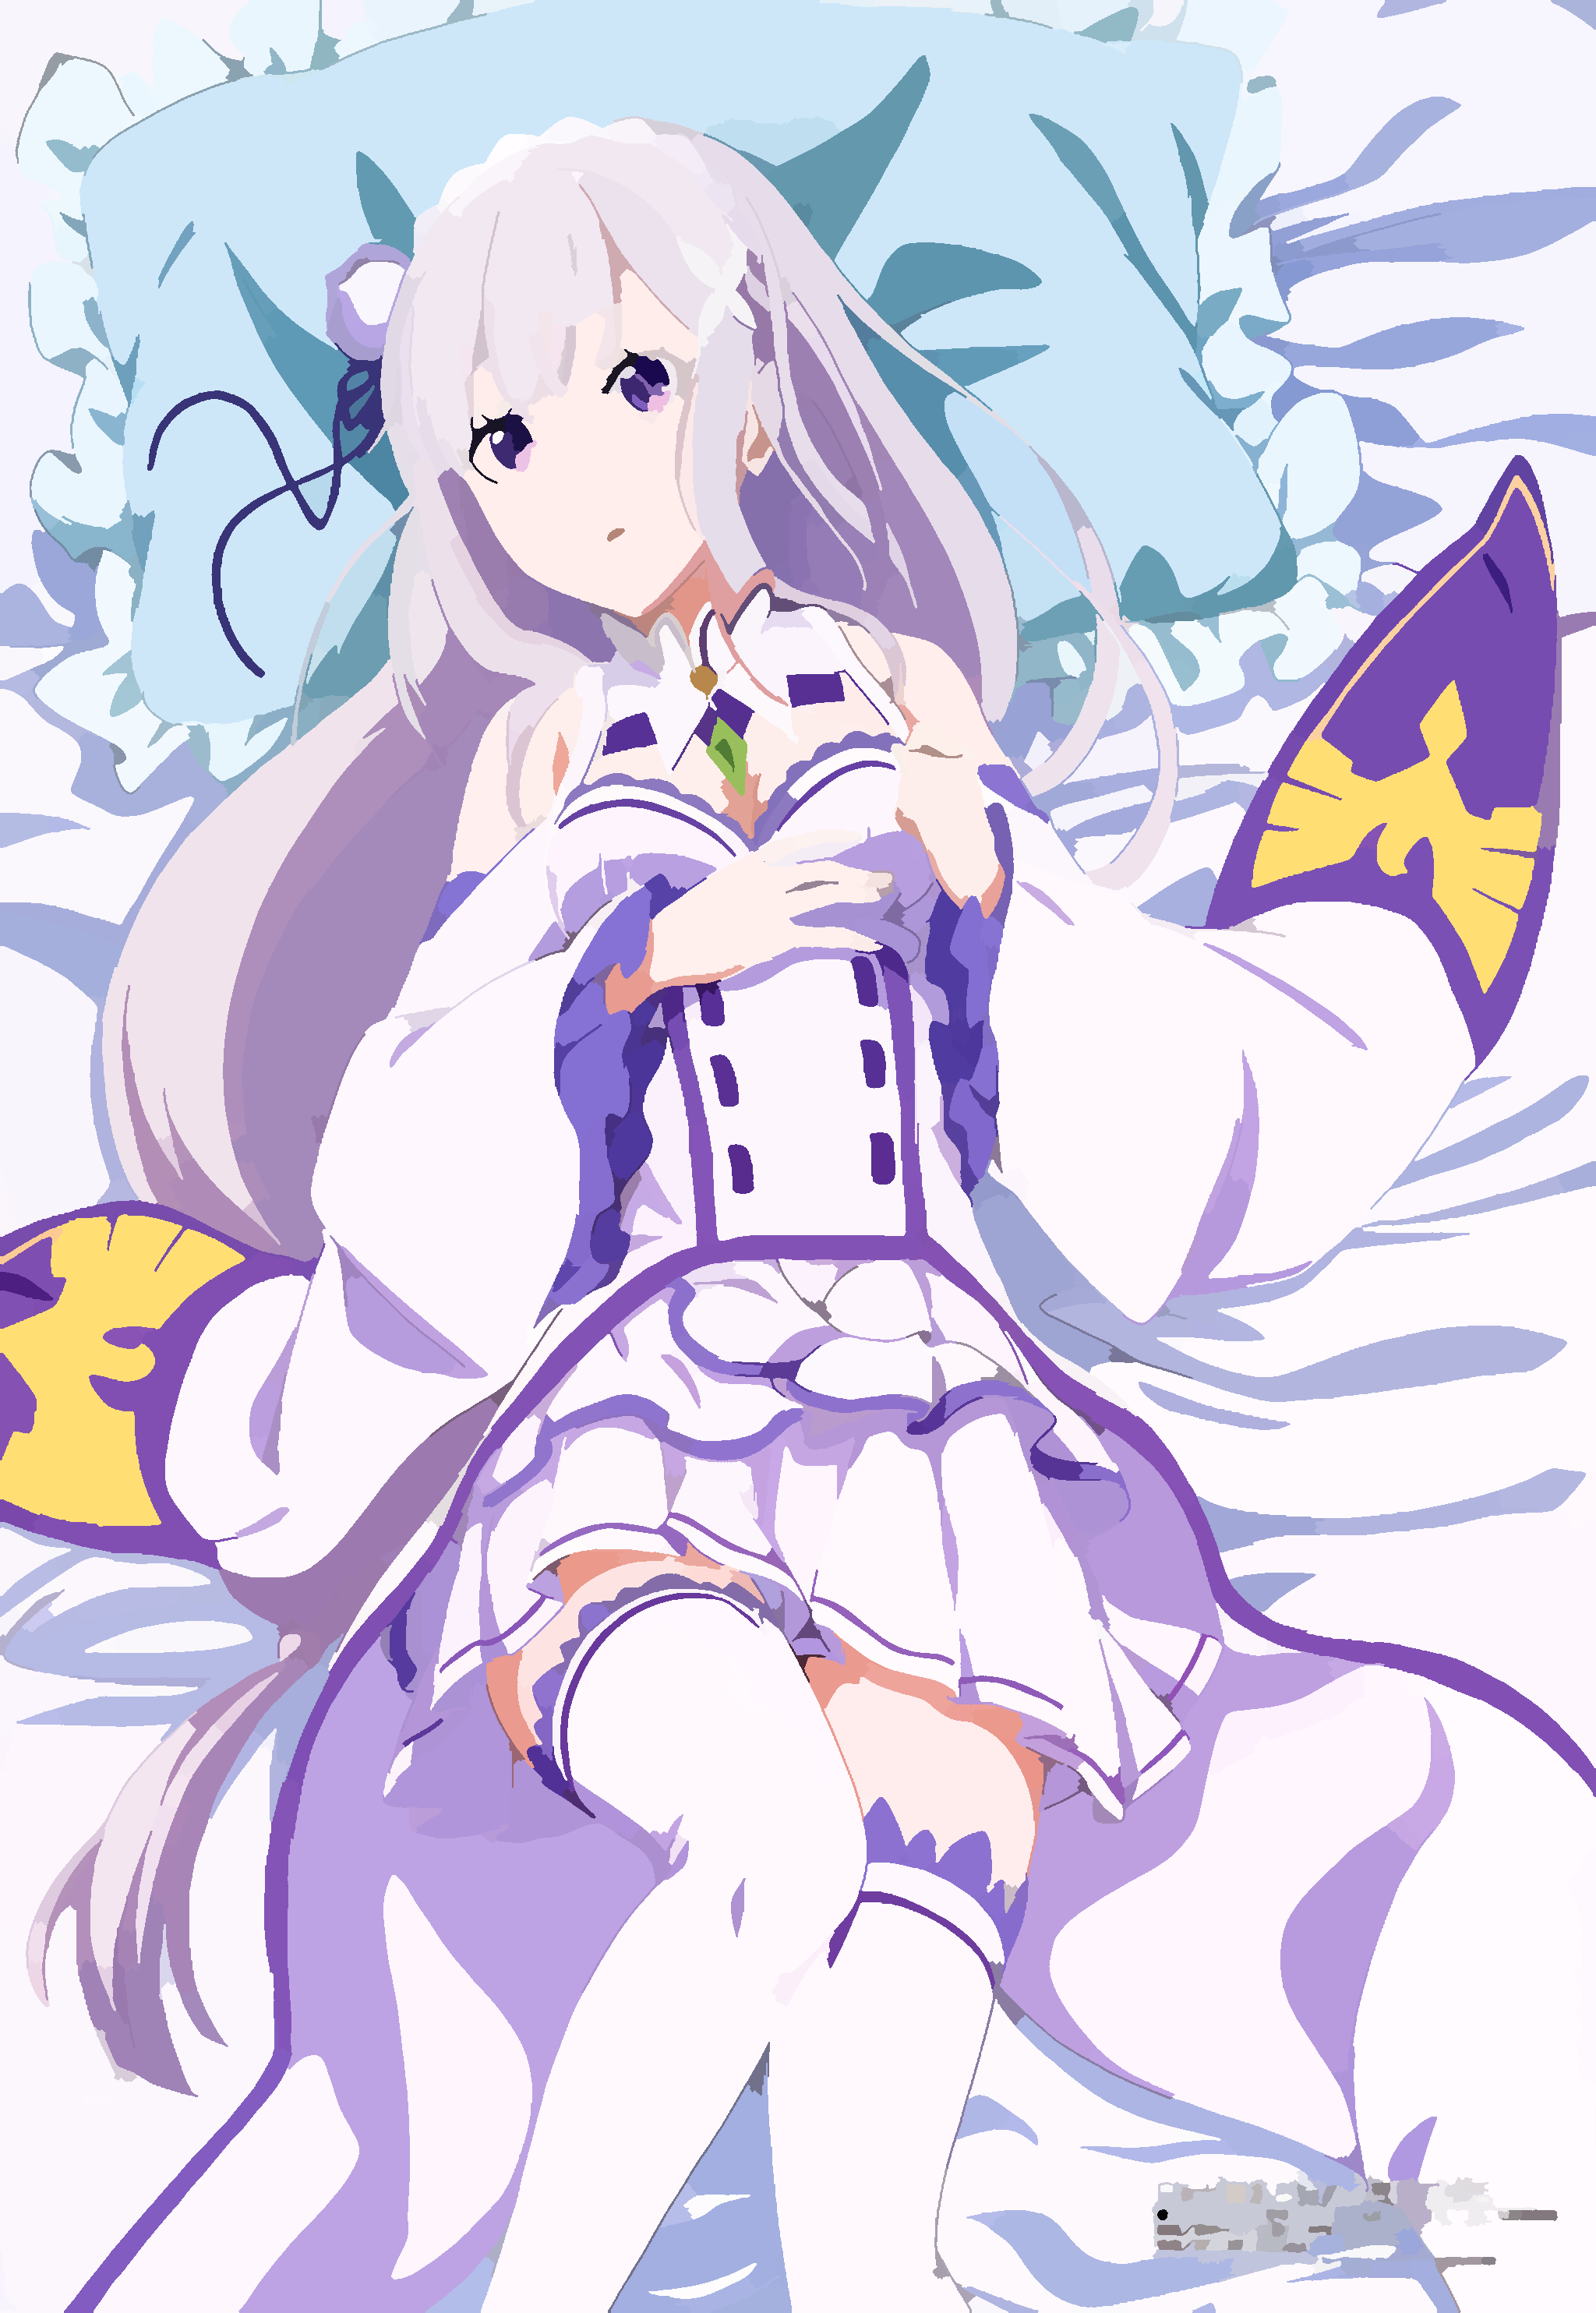
For example you have an image called "emilia.jpg":
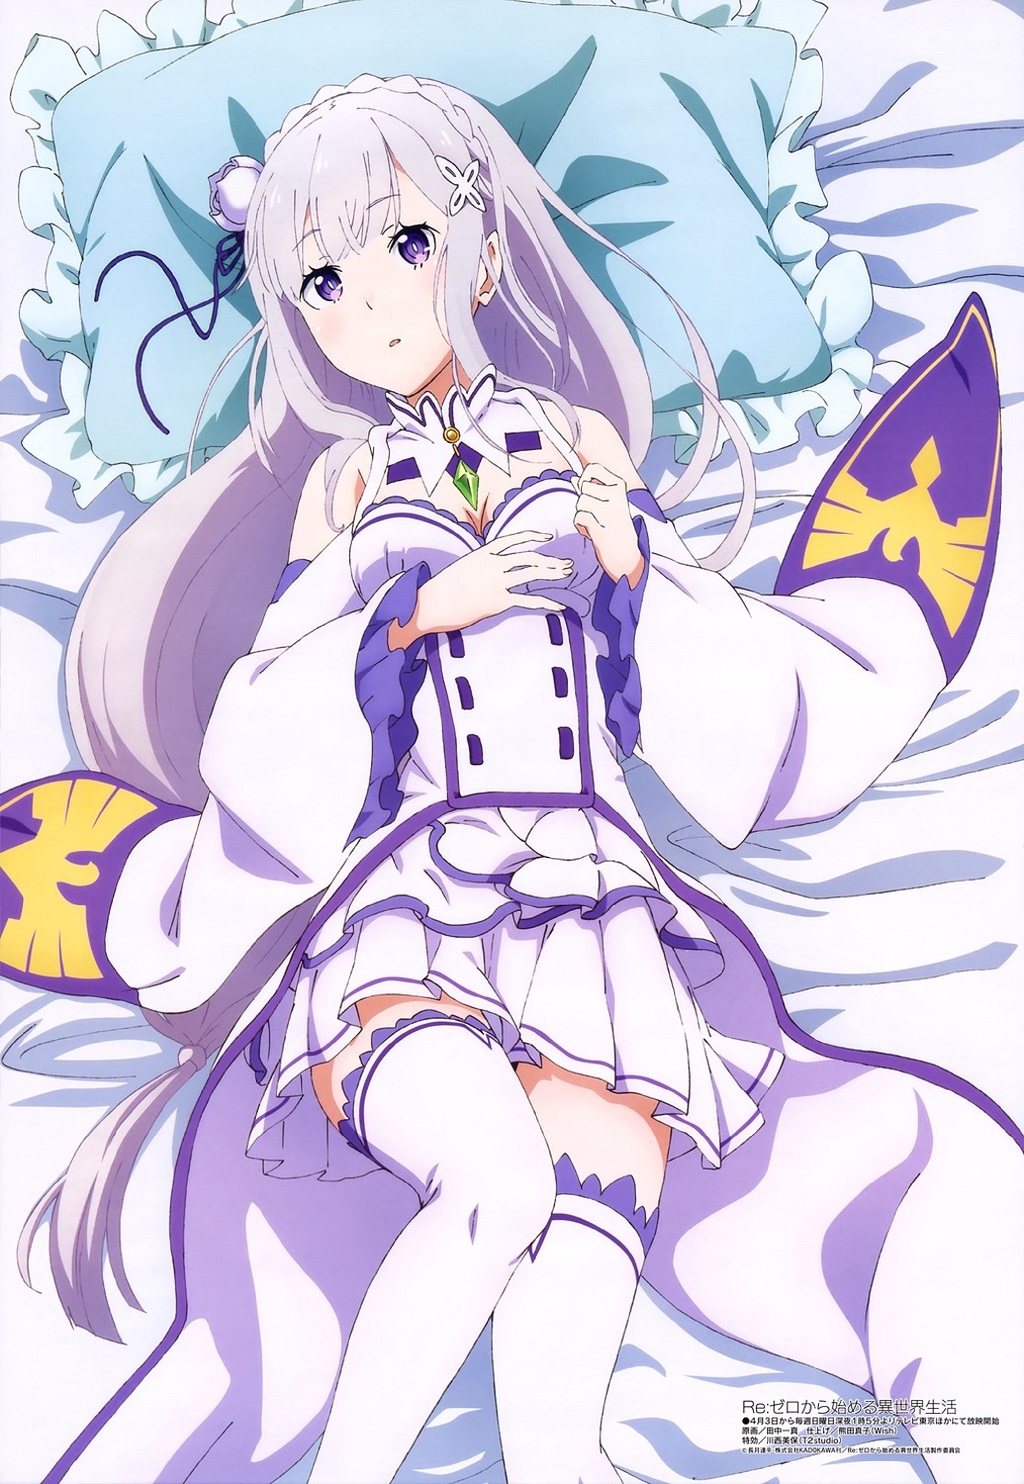
You may directly run
cd ./code/
python segment.py ./emilia.jpg
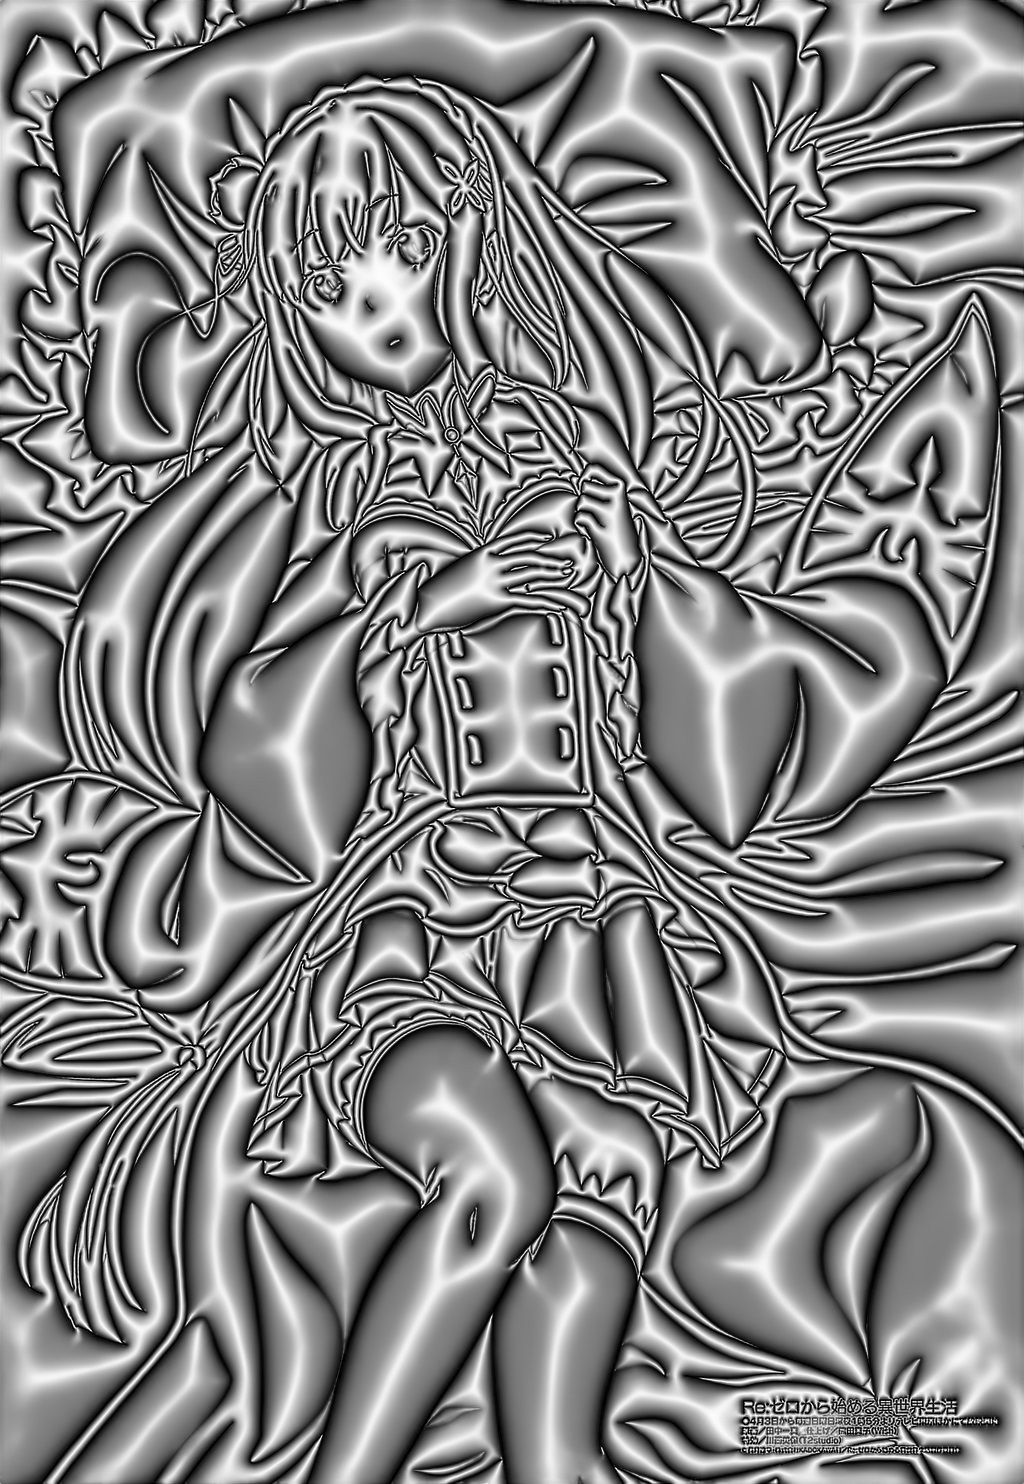
And you will get the estimated skeleton map:
The translated region map:
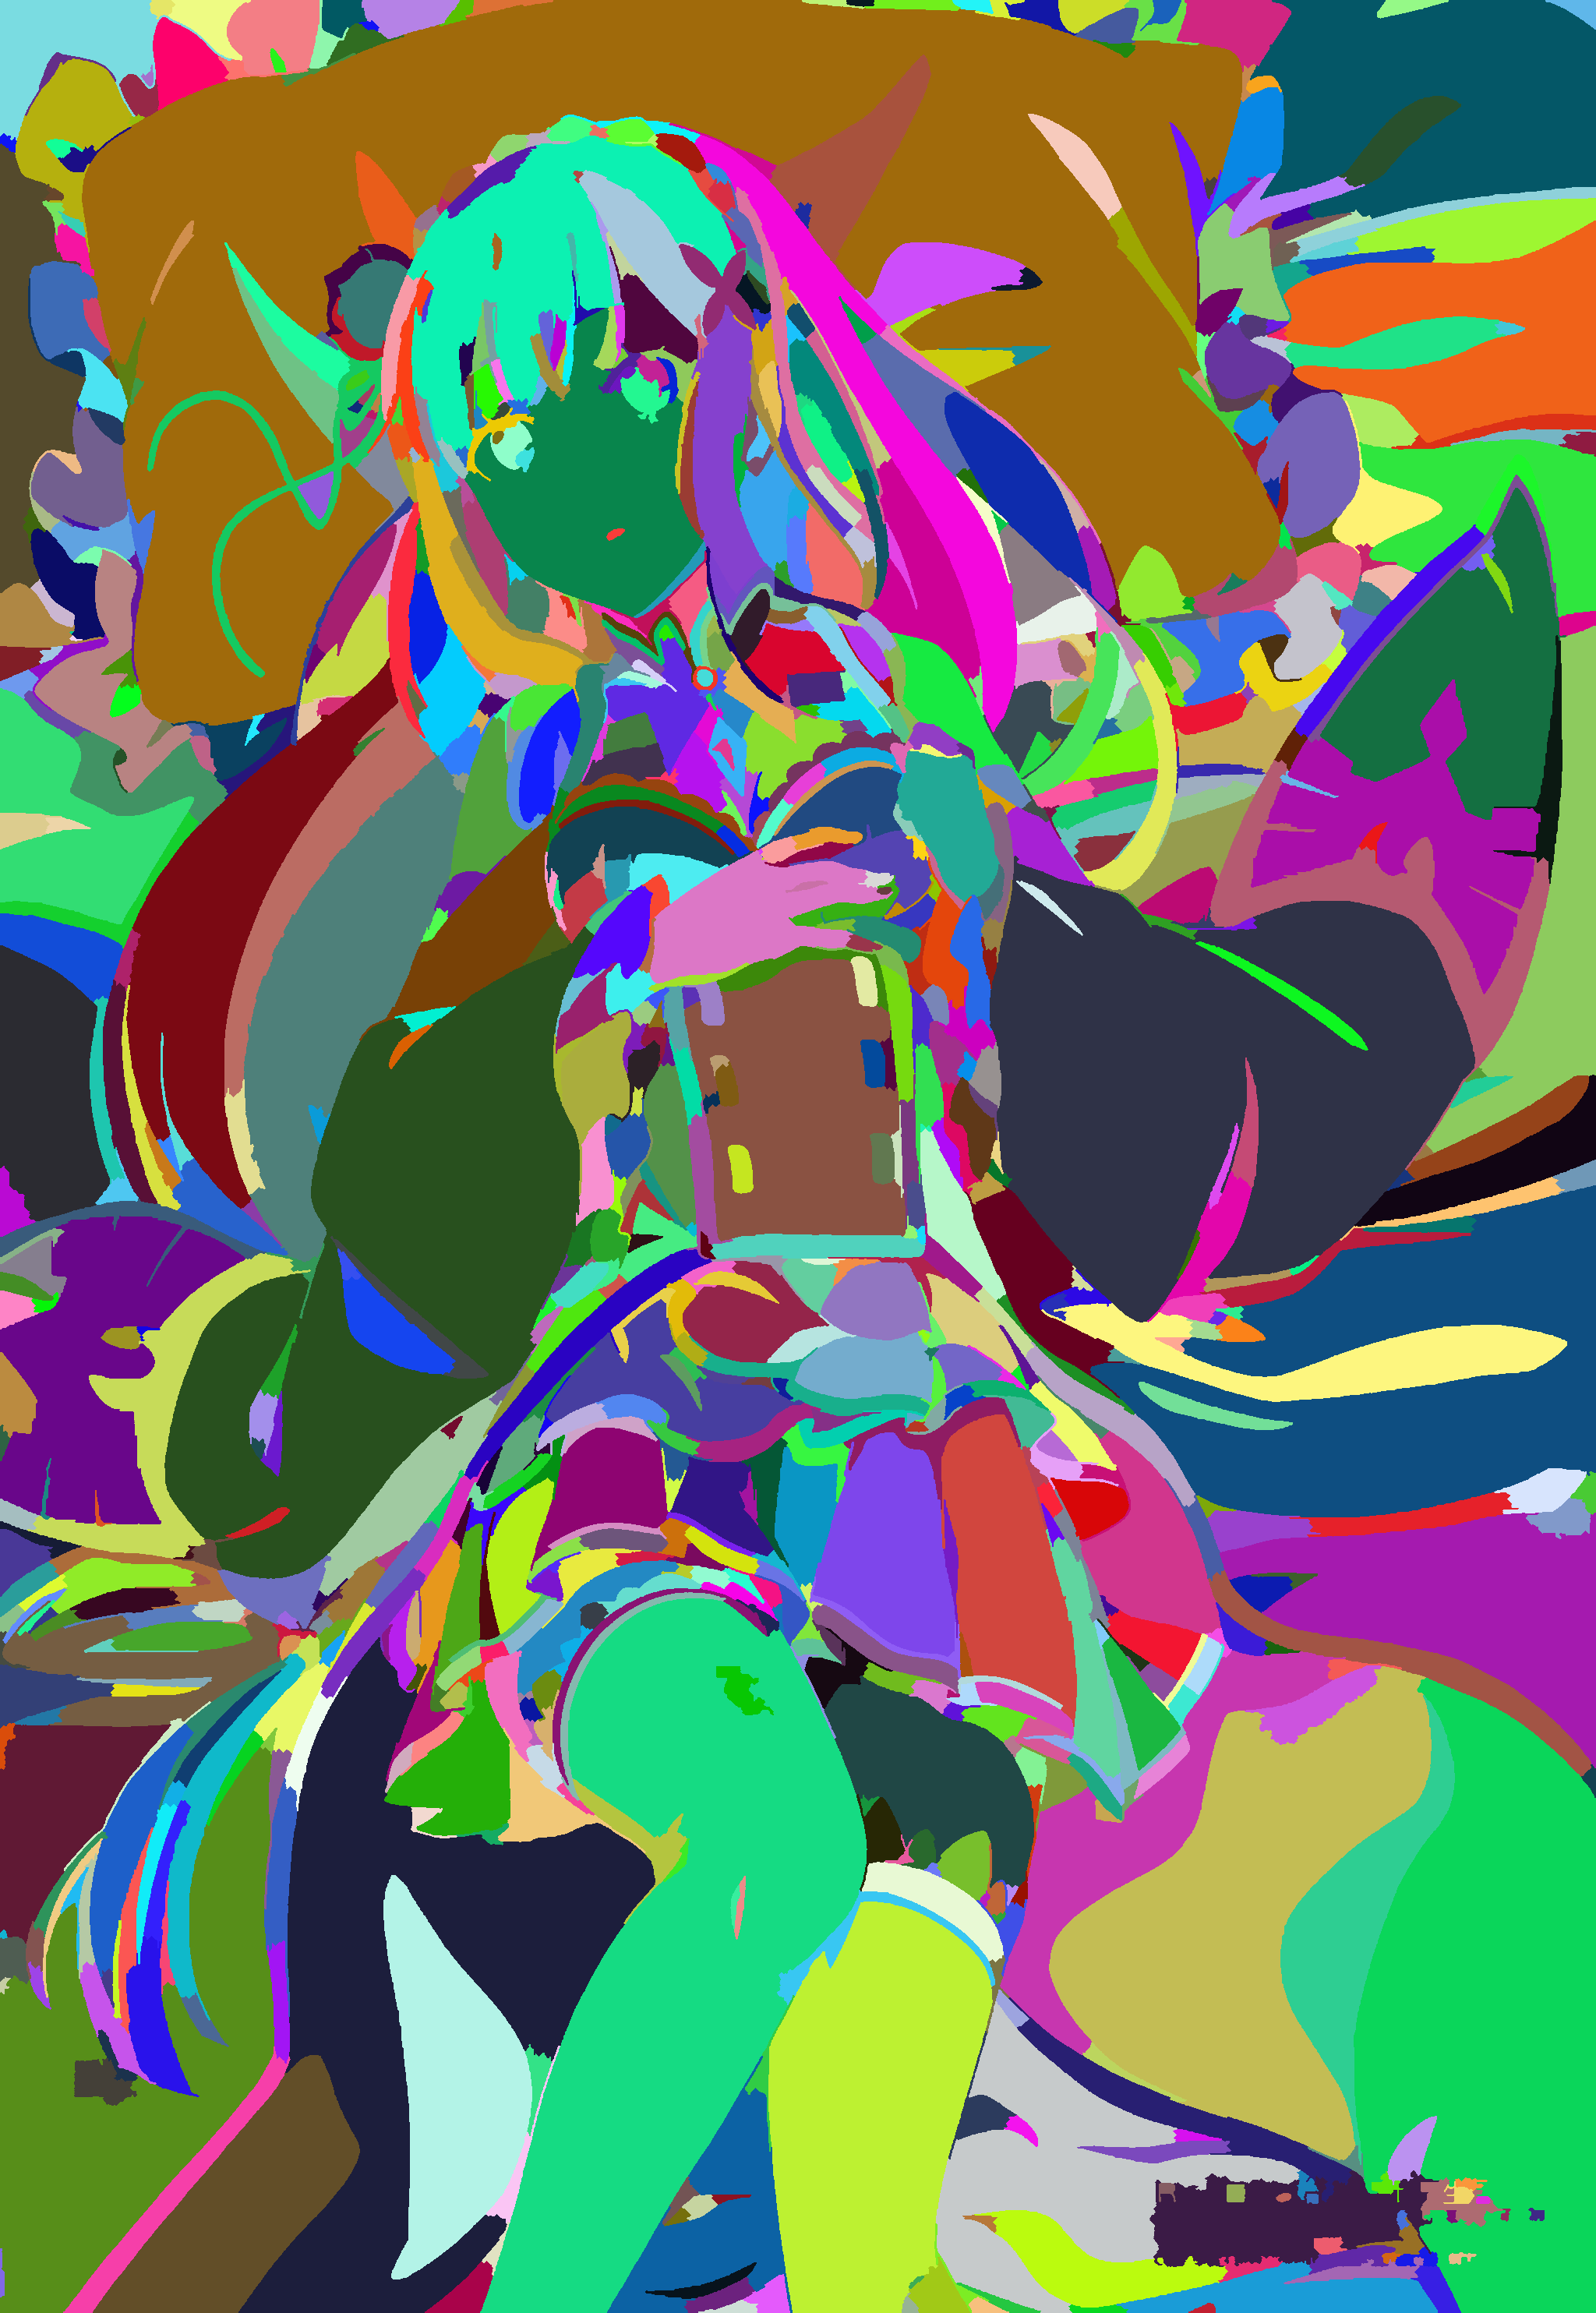
and the regions filled with original colors:
Have fun with the pre-trained model.
10. Playing with some applications.
10.1 Sketch Colorization
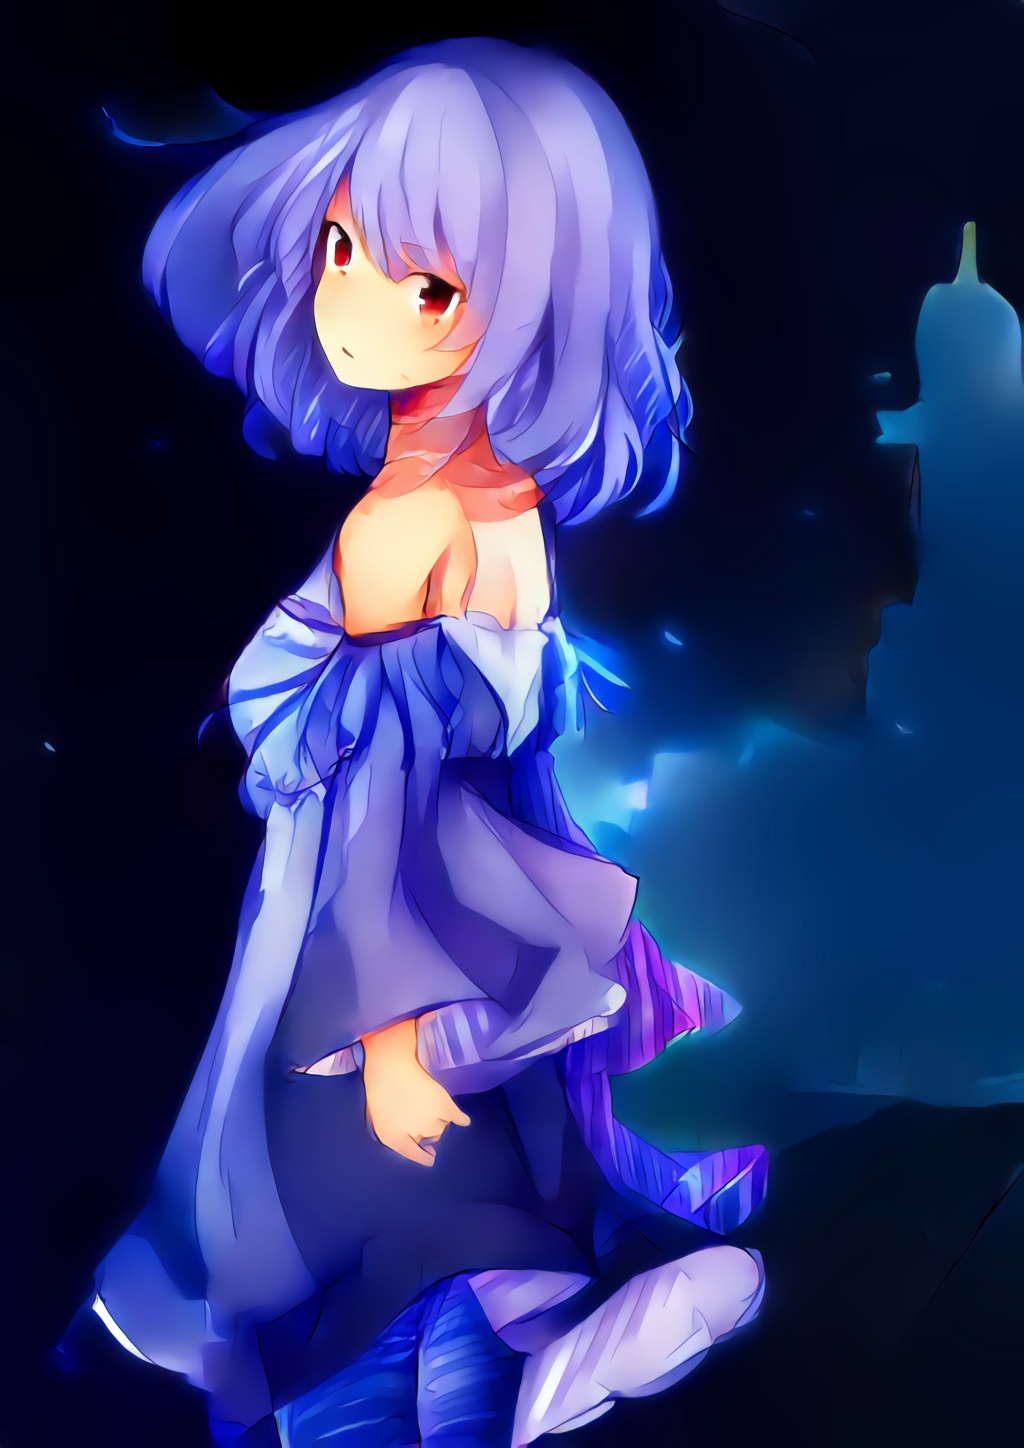
For example you have a sketch like this:

and you use Style2Paints 4.5
Style2Paints 4.5
https://github.com/lllyasviel/style2paints
and you get this result
then you directly run
cd ./code/
python segment.py ./app1.jpg
You will get this pretty cool flat colorization
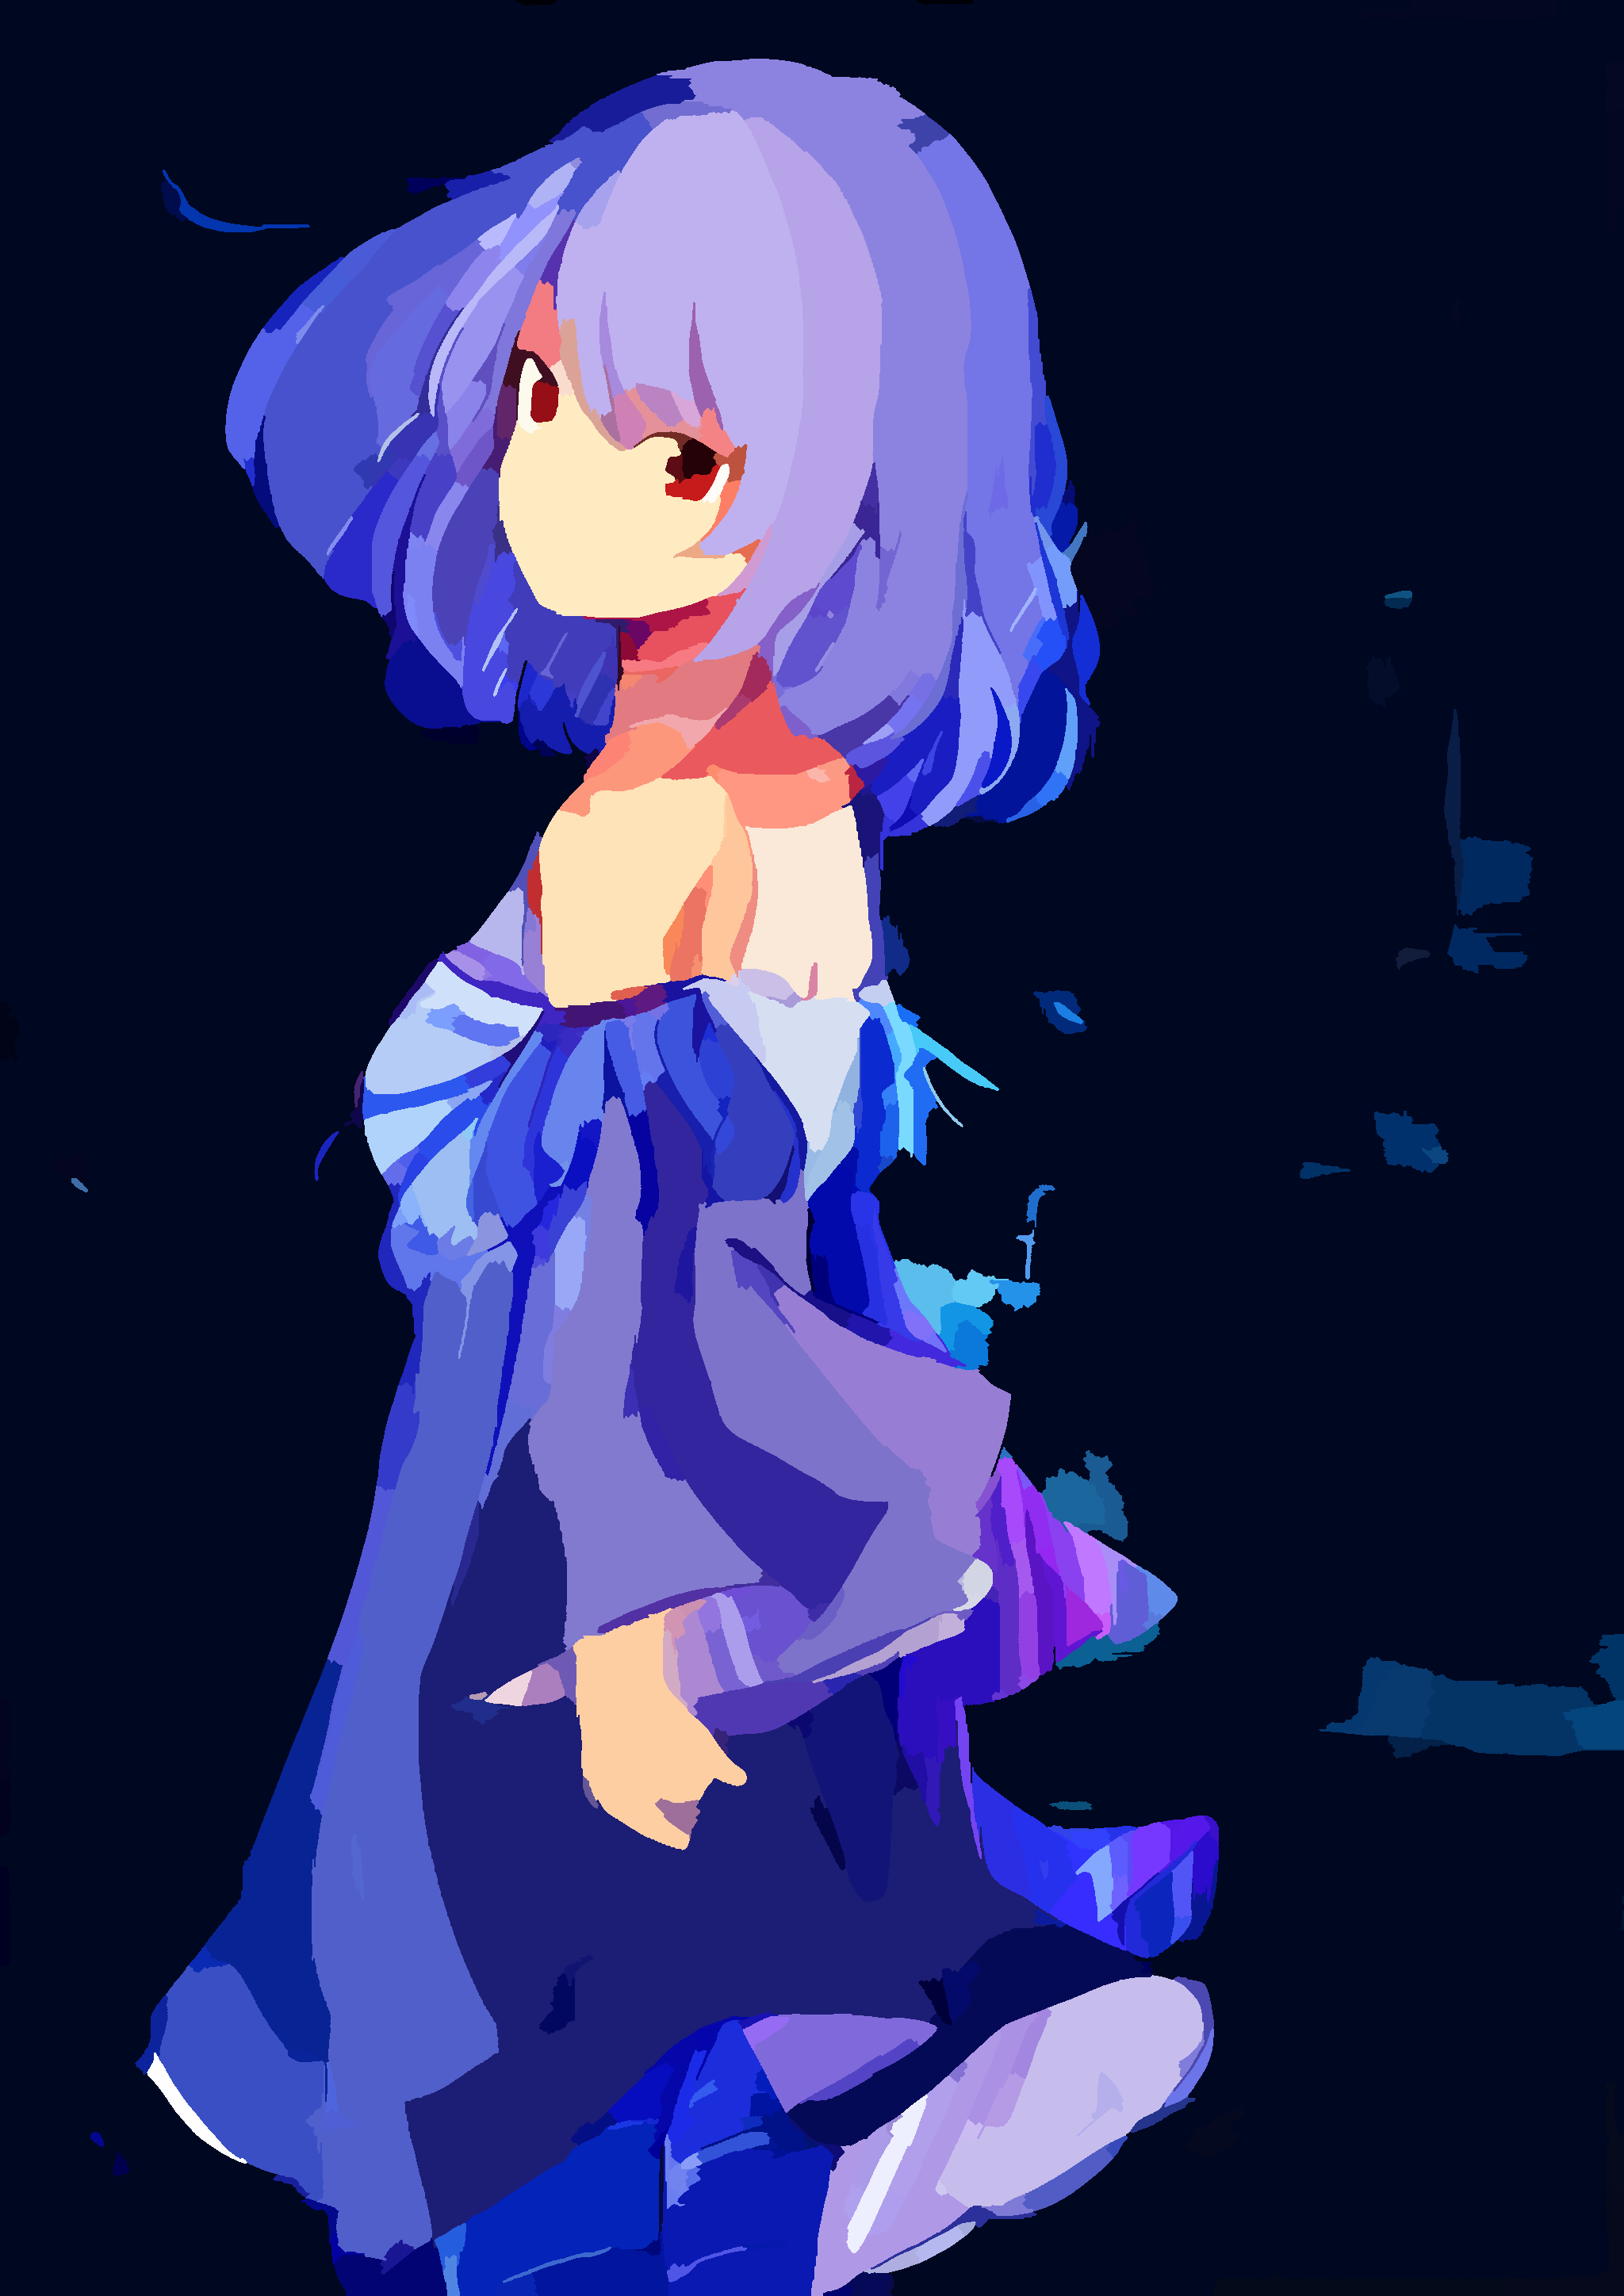
and this is usually called cell coloring (固有色上色/基本色着色) in Celluloid (赛璐璐) workflow (板绘工作流).
This technique will be embedded to Style2Paints 5.0 later.
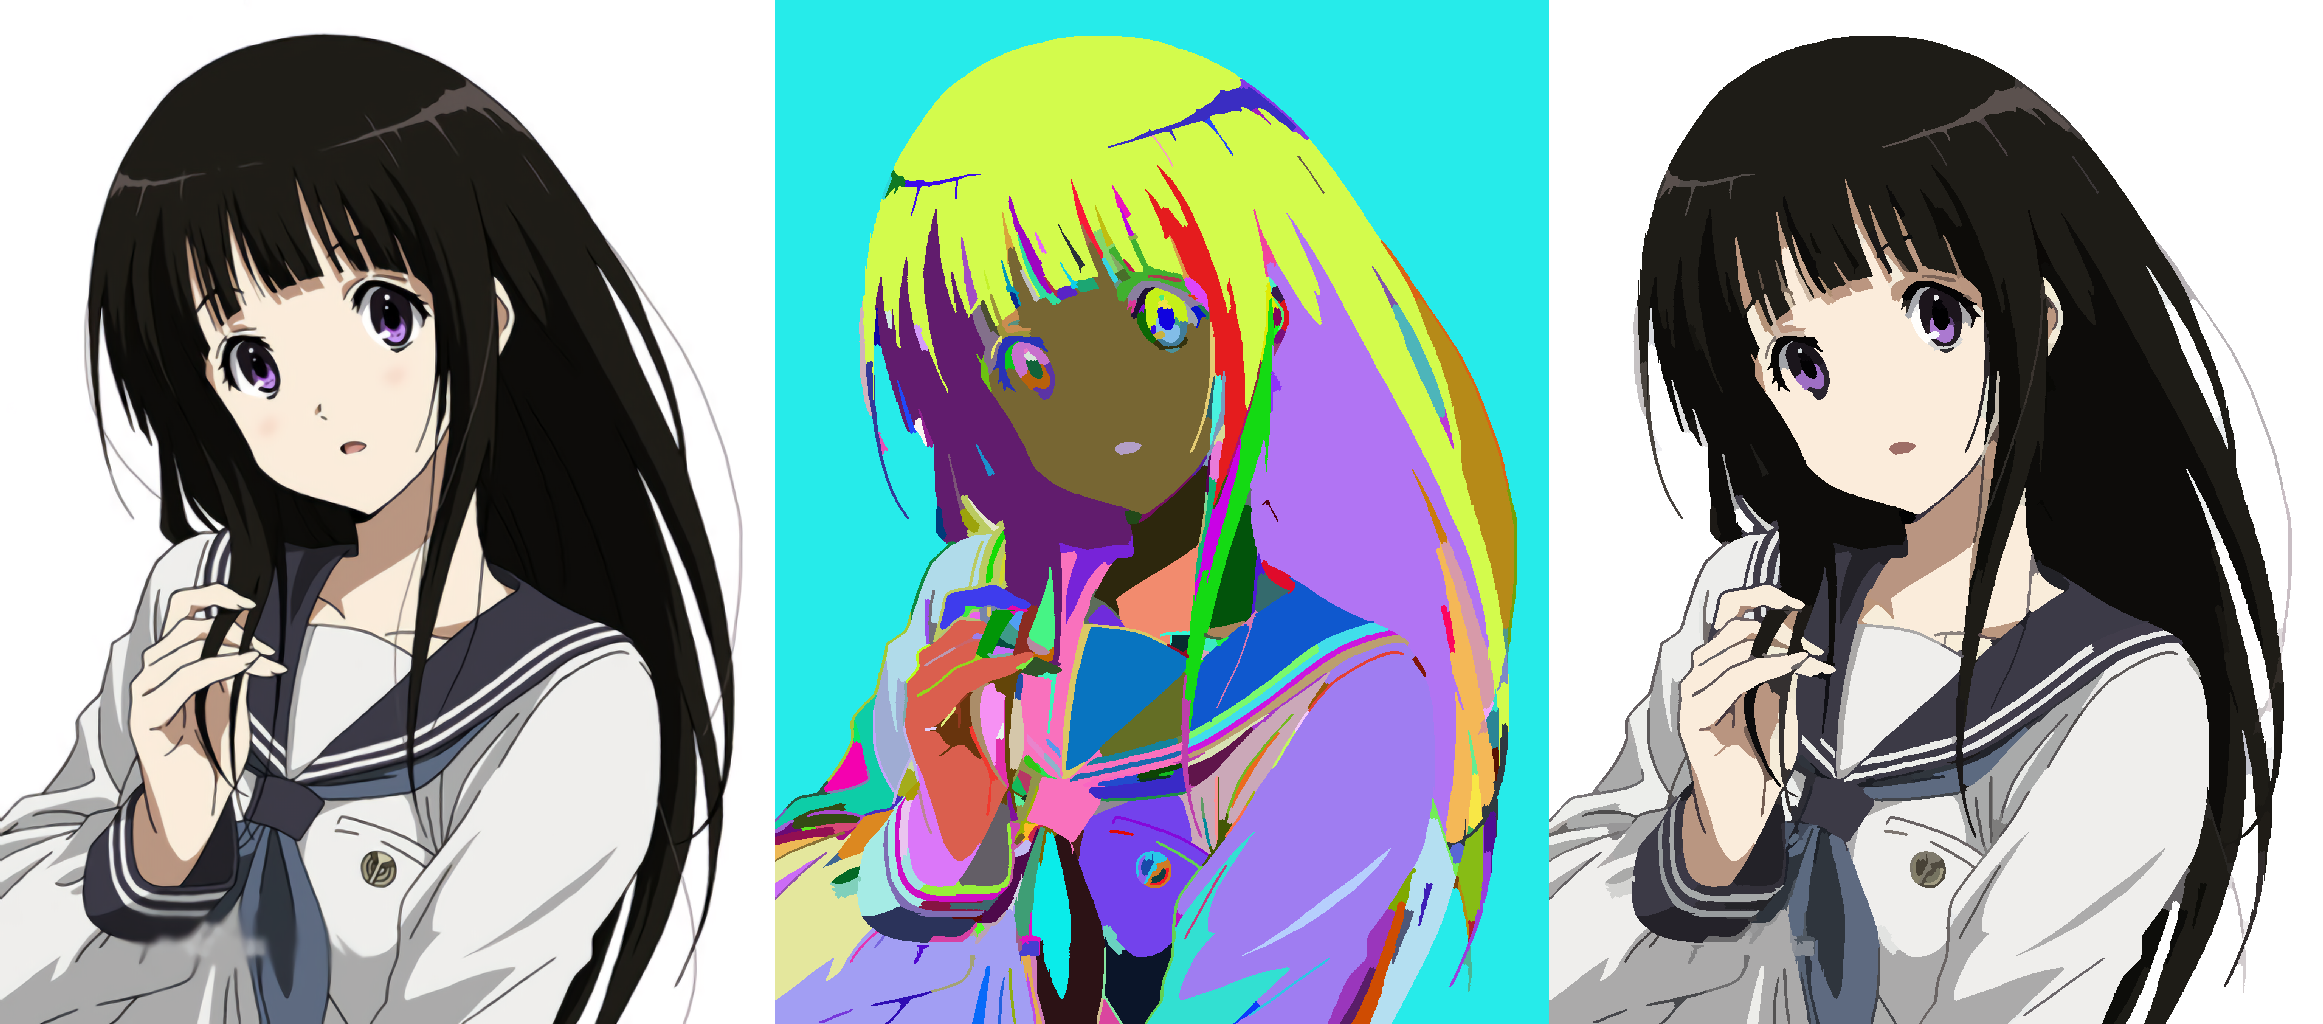
10.1 Cartoon Region Tracking
We can decompose cartoon image into some regions and then fill colors into the regions to reconstruct the cartoon image.
For example, in the below image, form left to right are the input image, the extracted regions, and the filled regions.
This example can be reproduced by
cd ./code/
python segment.py ./app2.jpg
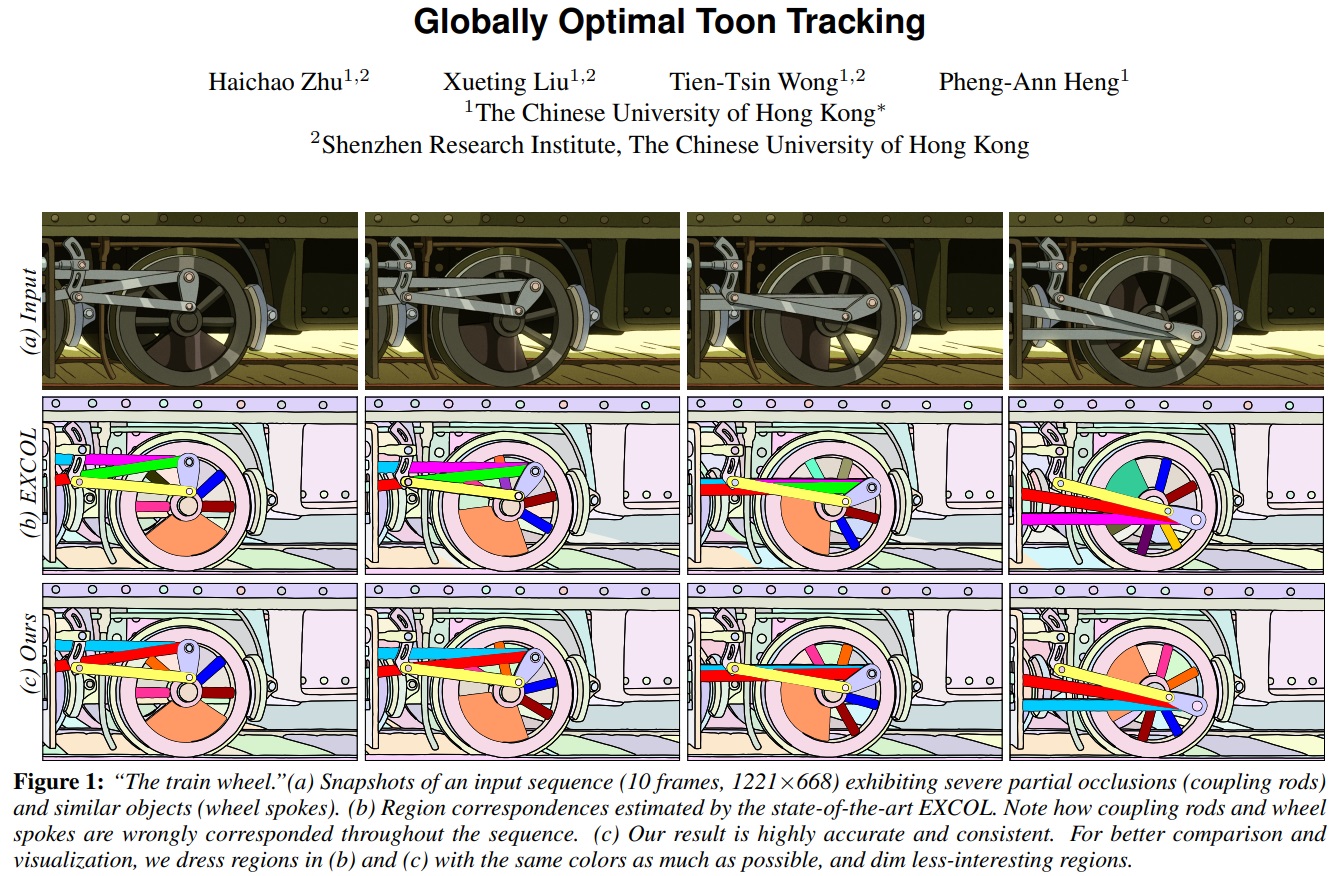
In this way we can track cartoon images with this technique:
Globally Optimal Toon Tracking
http://www.cse.cuhk.edu.hk/~ttwong/papers/toontrack/toontrack.html
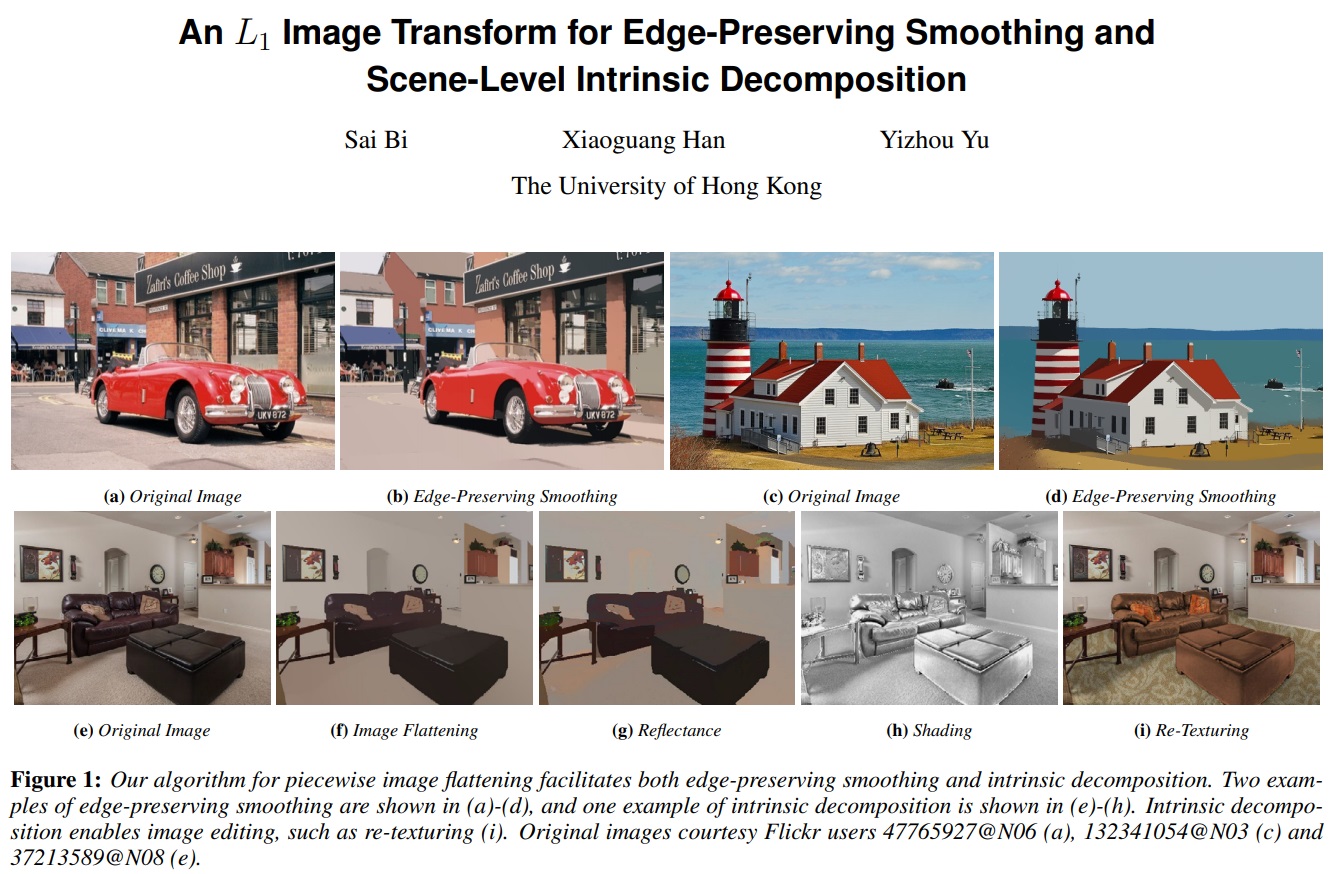
10.3 Cartoon Intrinsic Decomposition
The regions can also be used to decompose illumination:
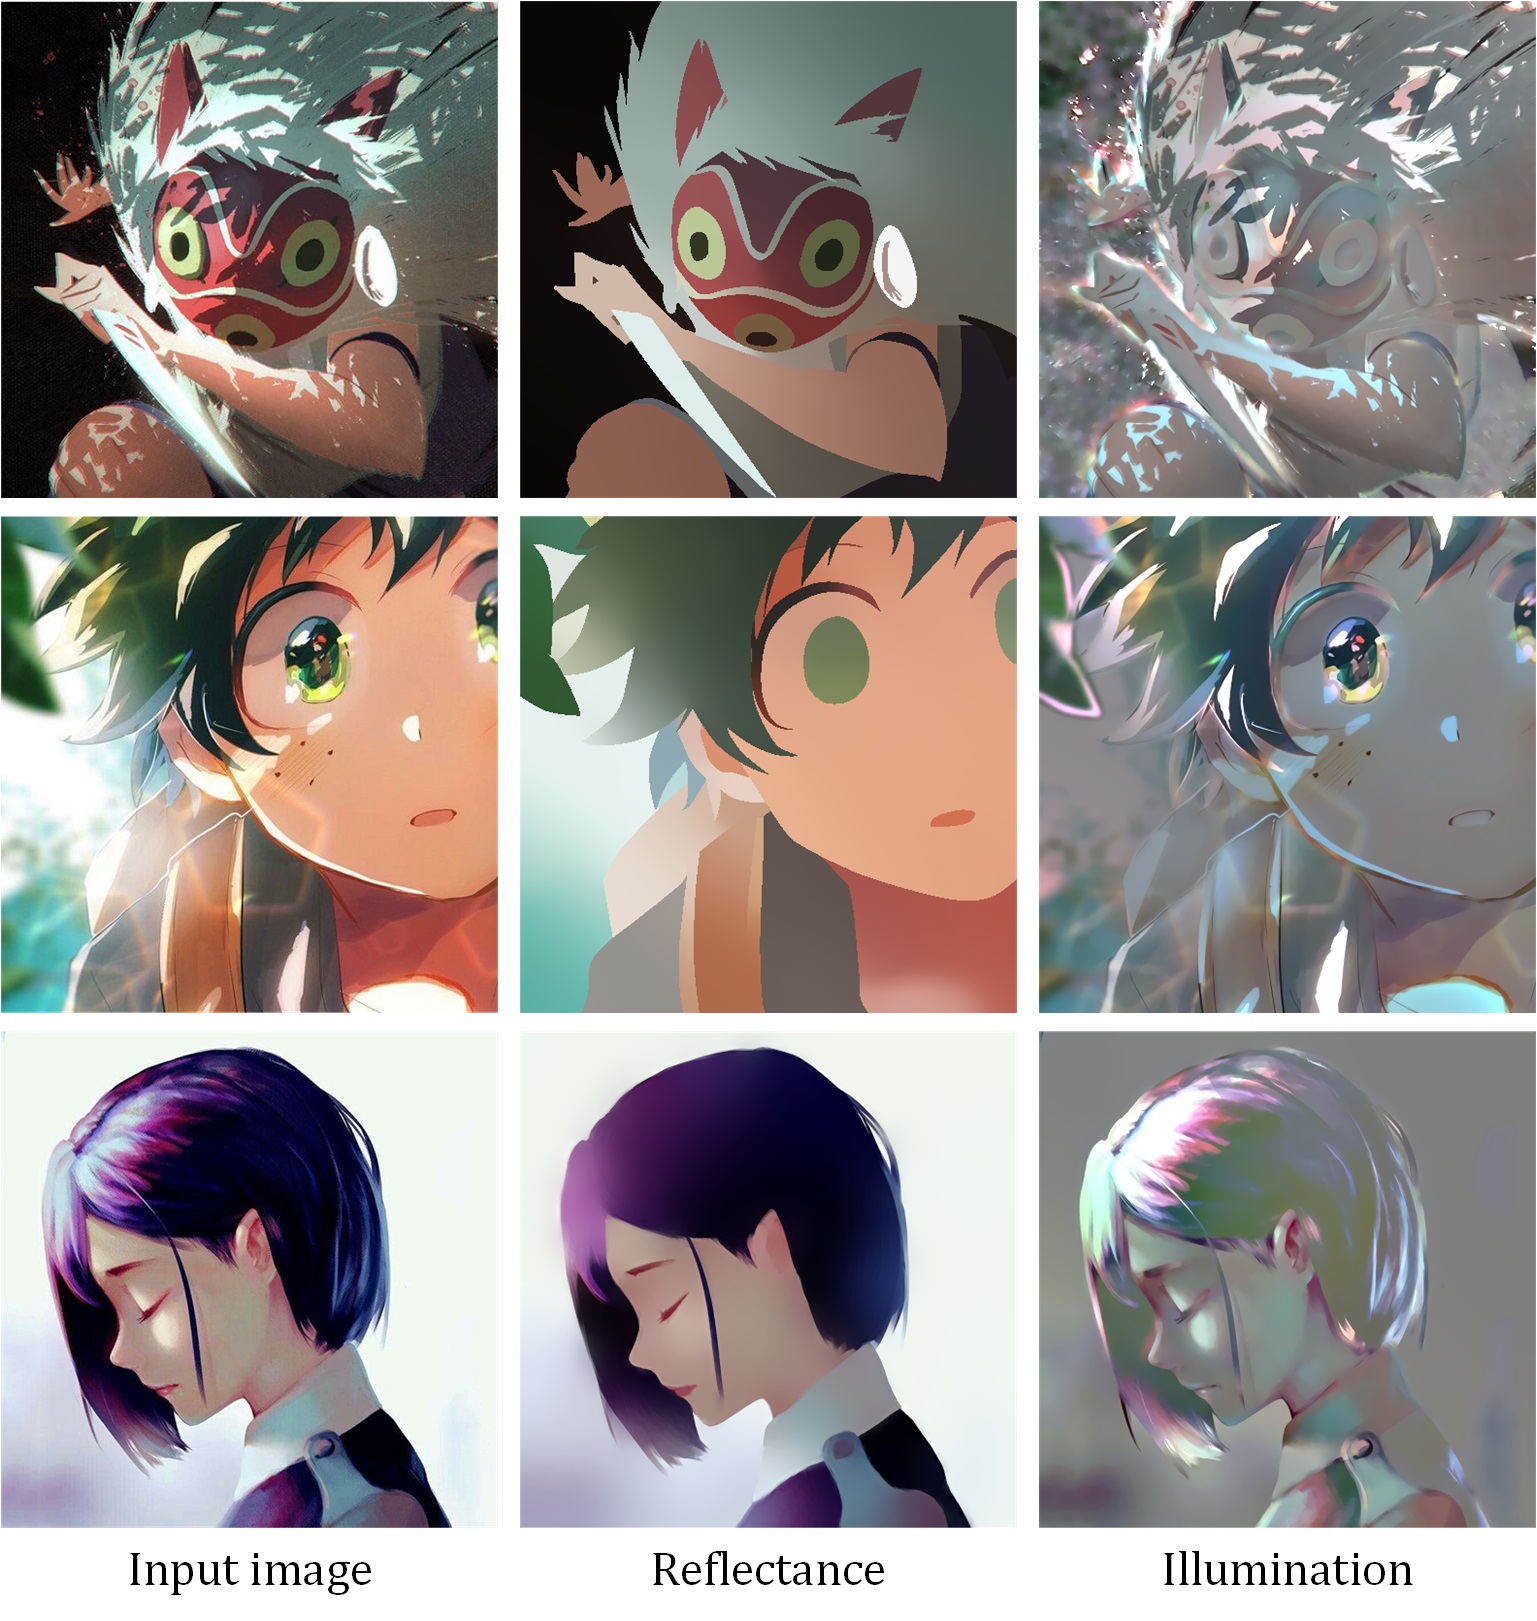
The involved technique is
An L1 Image Transform for Edge-Preserving Smoothing and Scene-Level Intrinsic Decomposition
http://cseweb.ucsd.edu/~bisai/project/siggraph2015.html
https://github.com/soundsilence/L1Flattening
Please see also our main paper for details.
FAQ
Q: I have downloaded the dataset. Why there is no annotations in the "test" folder?
A: We only provide train&val annotations. Please see also the section "7. Benchmarking
   the performace of your model". Please send your predictions to my e-mail address so
   that I will report the model performace on the test set as a respond and benchmark
   your score.
.
Q: Can you give me the full resolution images in your paper?
A: No. Some of thoese images are actually in the test set and giving those full
   resolution images will cause testing annotation leakage problem.
.
Q: Why I cannot find some paper images in the dataset?
A: Most of the highest-quality annotations are in our test set and we will not
   provide them to avoid test annotation leakage problem. Those paper images
   might be our test annotations.
.
Q: Can I use this model or data in a commercial software?
A: No. But if you must do that please contact "lvminzhang@acm.org" or
   "lvminzhang@siggraph.org". Currently we preserve all rights of these models and data.
.
Q: I am writing a SIGGRAPH paper. Can I put images from this dataset in my paper?
A: Yes, but be carful that we do not have the copyright of these images. ACM Digital
   Library managers may ask you to remove all images without copyrights in your
   camera-ready SIGGRAPH papers.
Citation
If you use this code for your research, please cite our paper:
@InProceedings{DanbooRegion2020,
author={Lvmin Zhang, Yi JI, and Chunping Liu},
booktitle={European Conference on Computer Vision (ECCV)},
title={DanbooRegion: An Illustration Region Dataset},
year={2020},
}
中文社区
我们有一个除了技术什么东西都聊的以技术交流为主的宇宙超一流二次元相关技术交流吹水群“纸片协会”。如果你一次加群失败,可以多次尝试。
纸片协会总舵:184467946